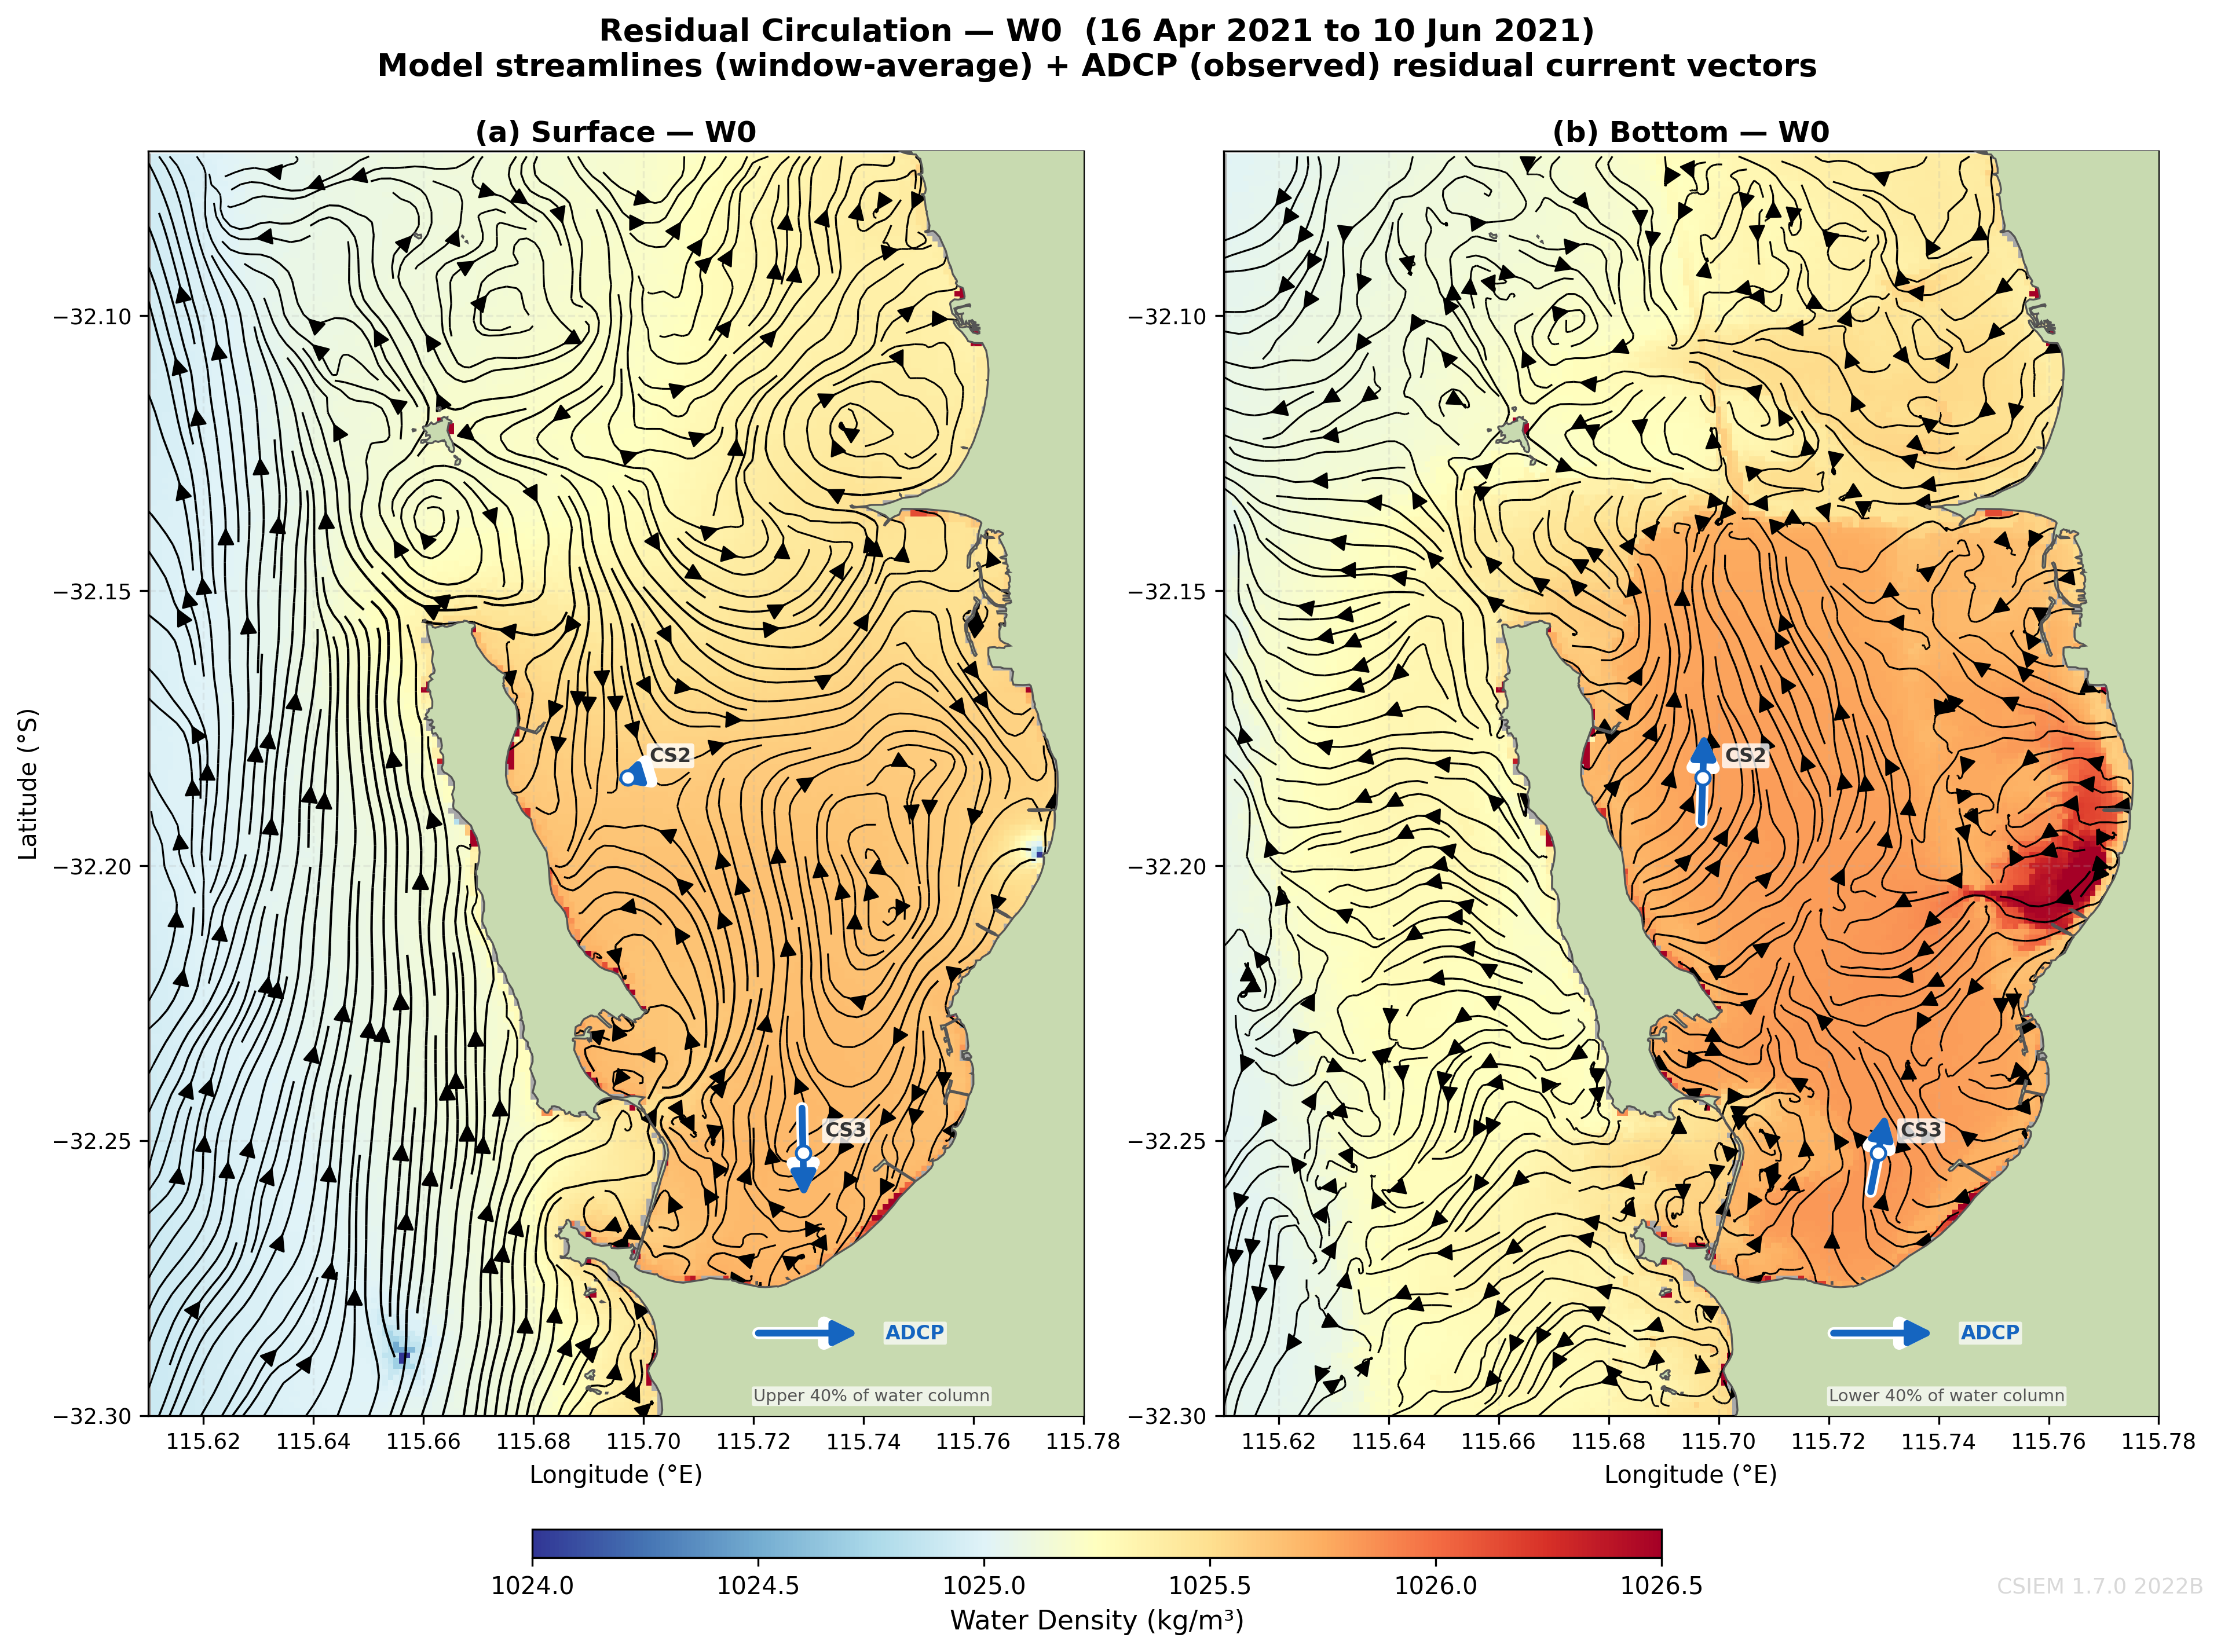
Shift from light easterlies toward winter wind regime
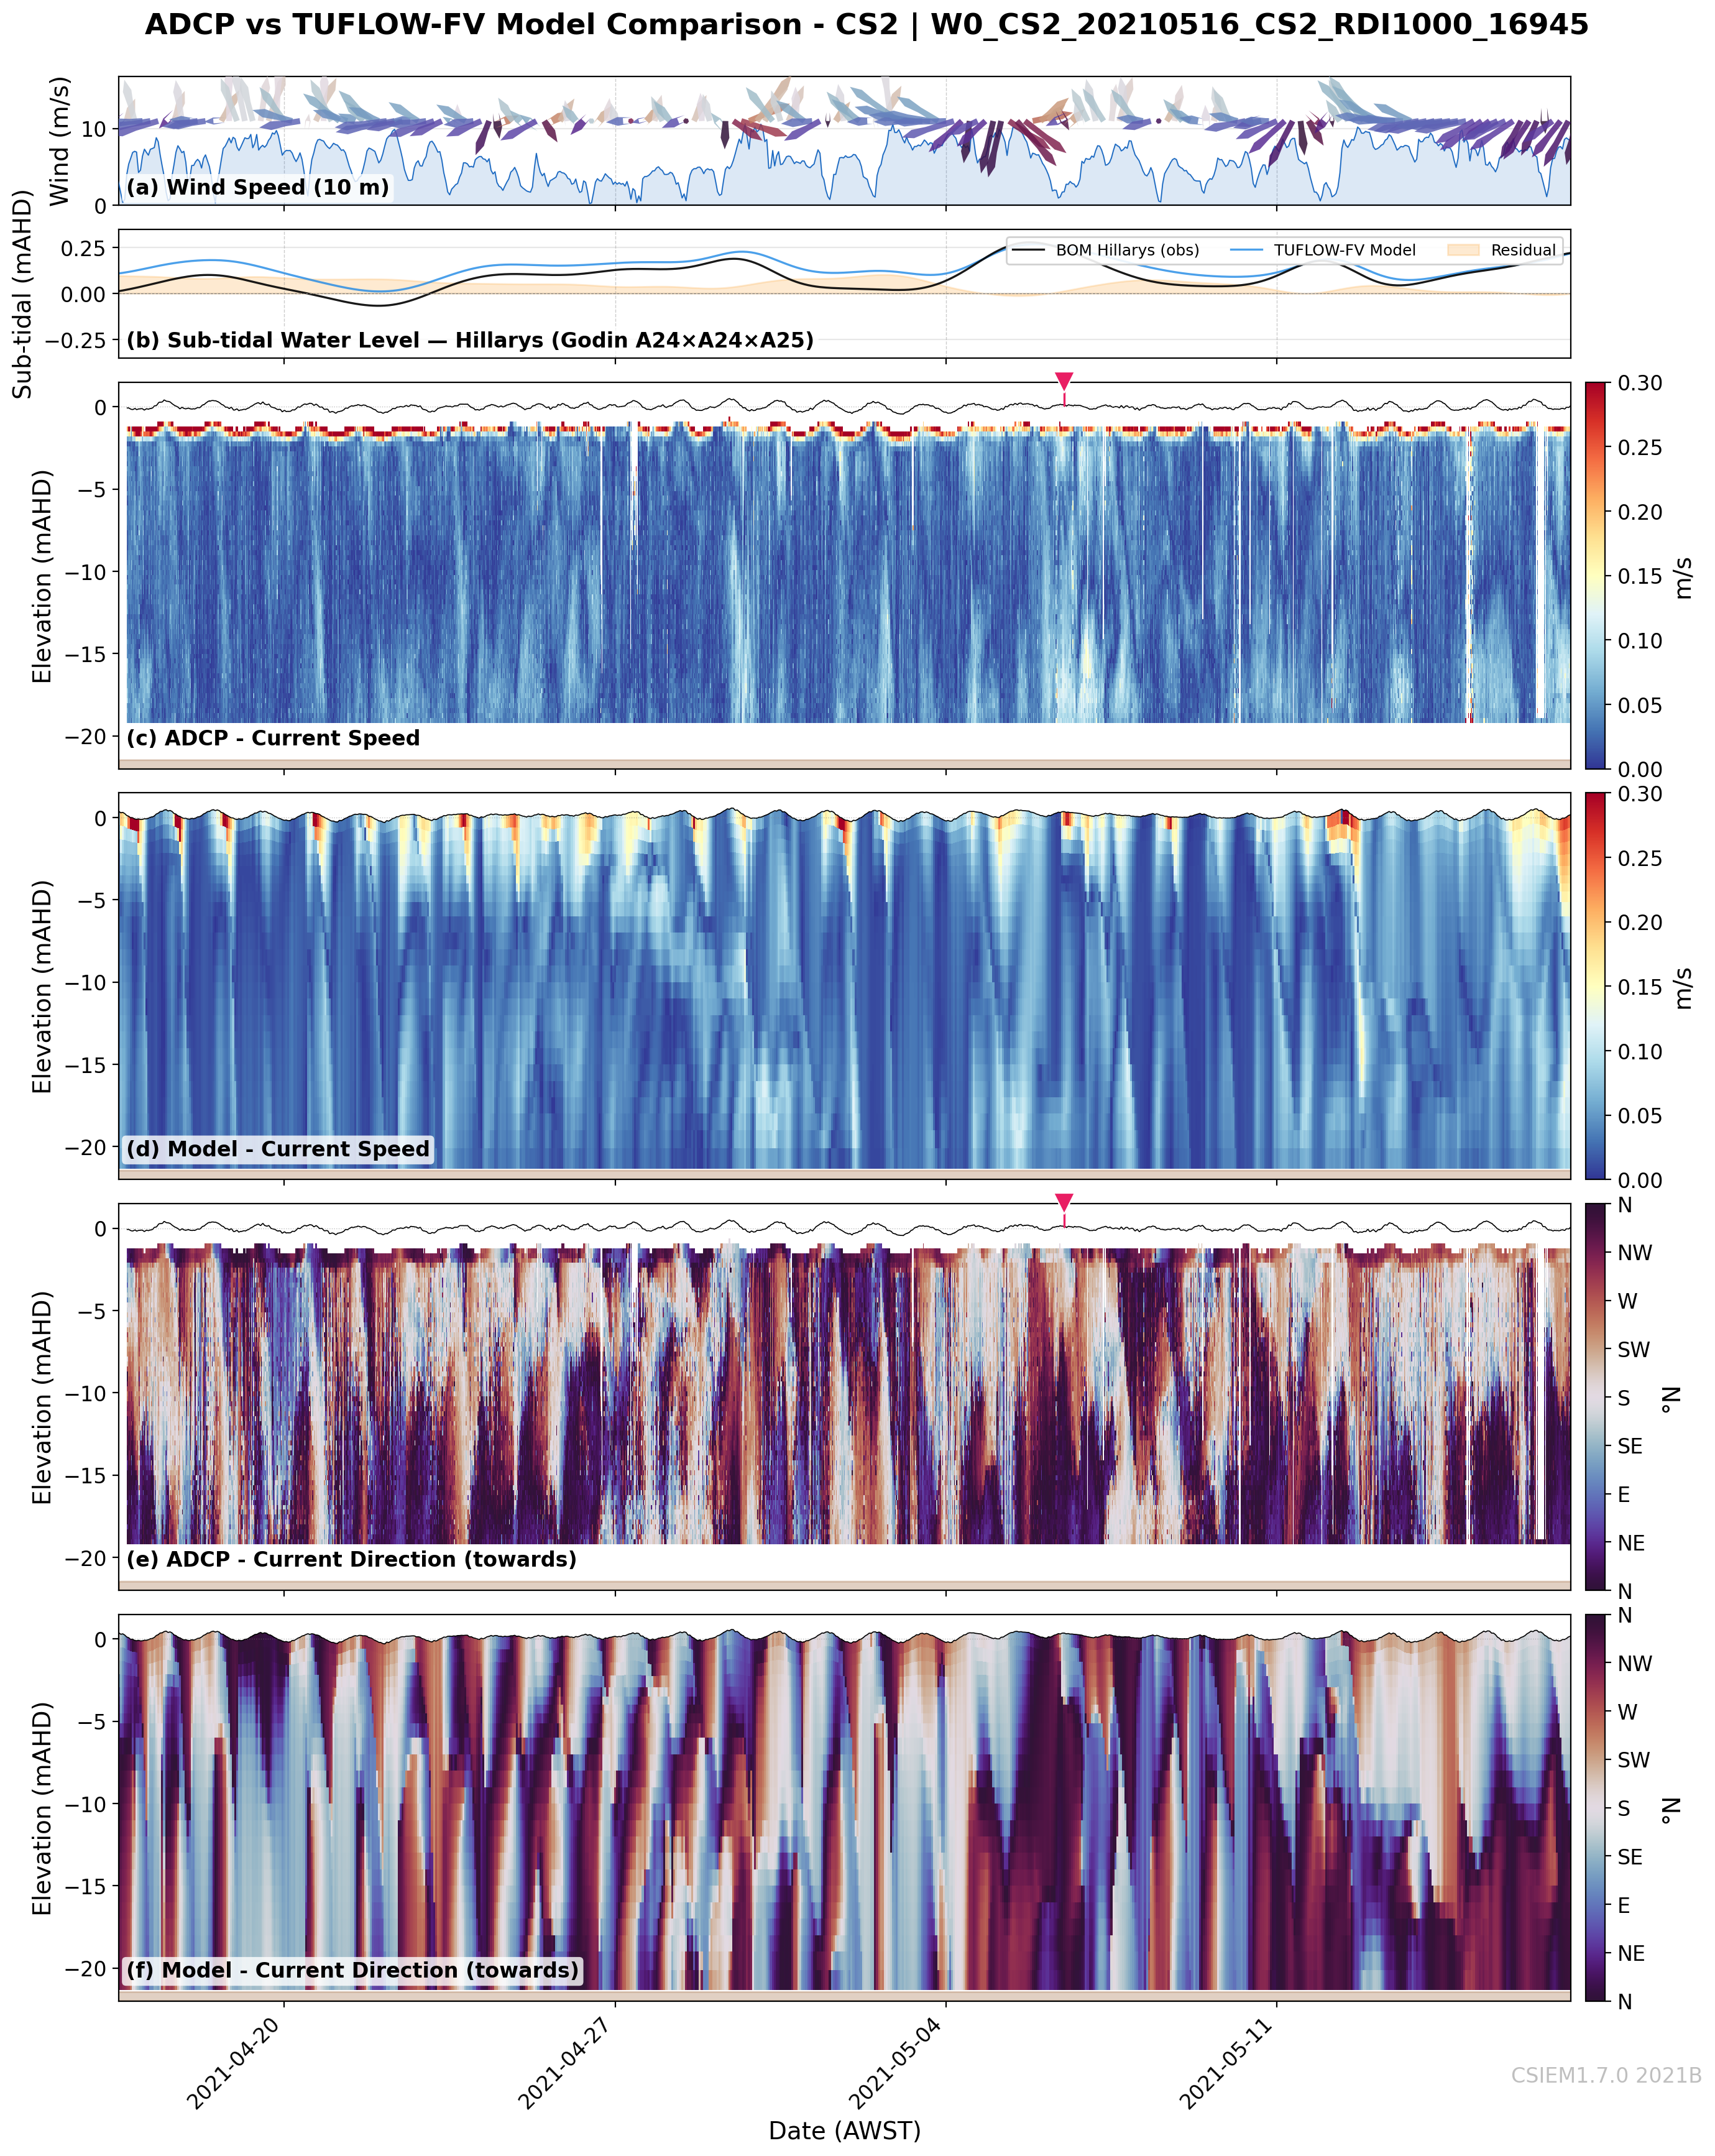
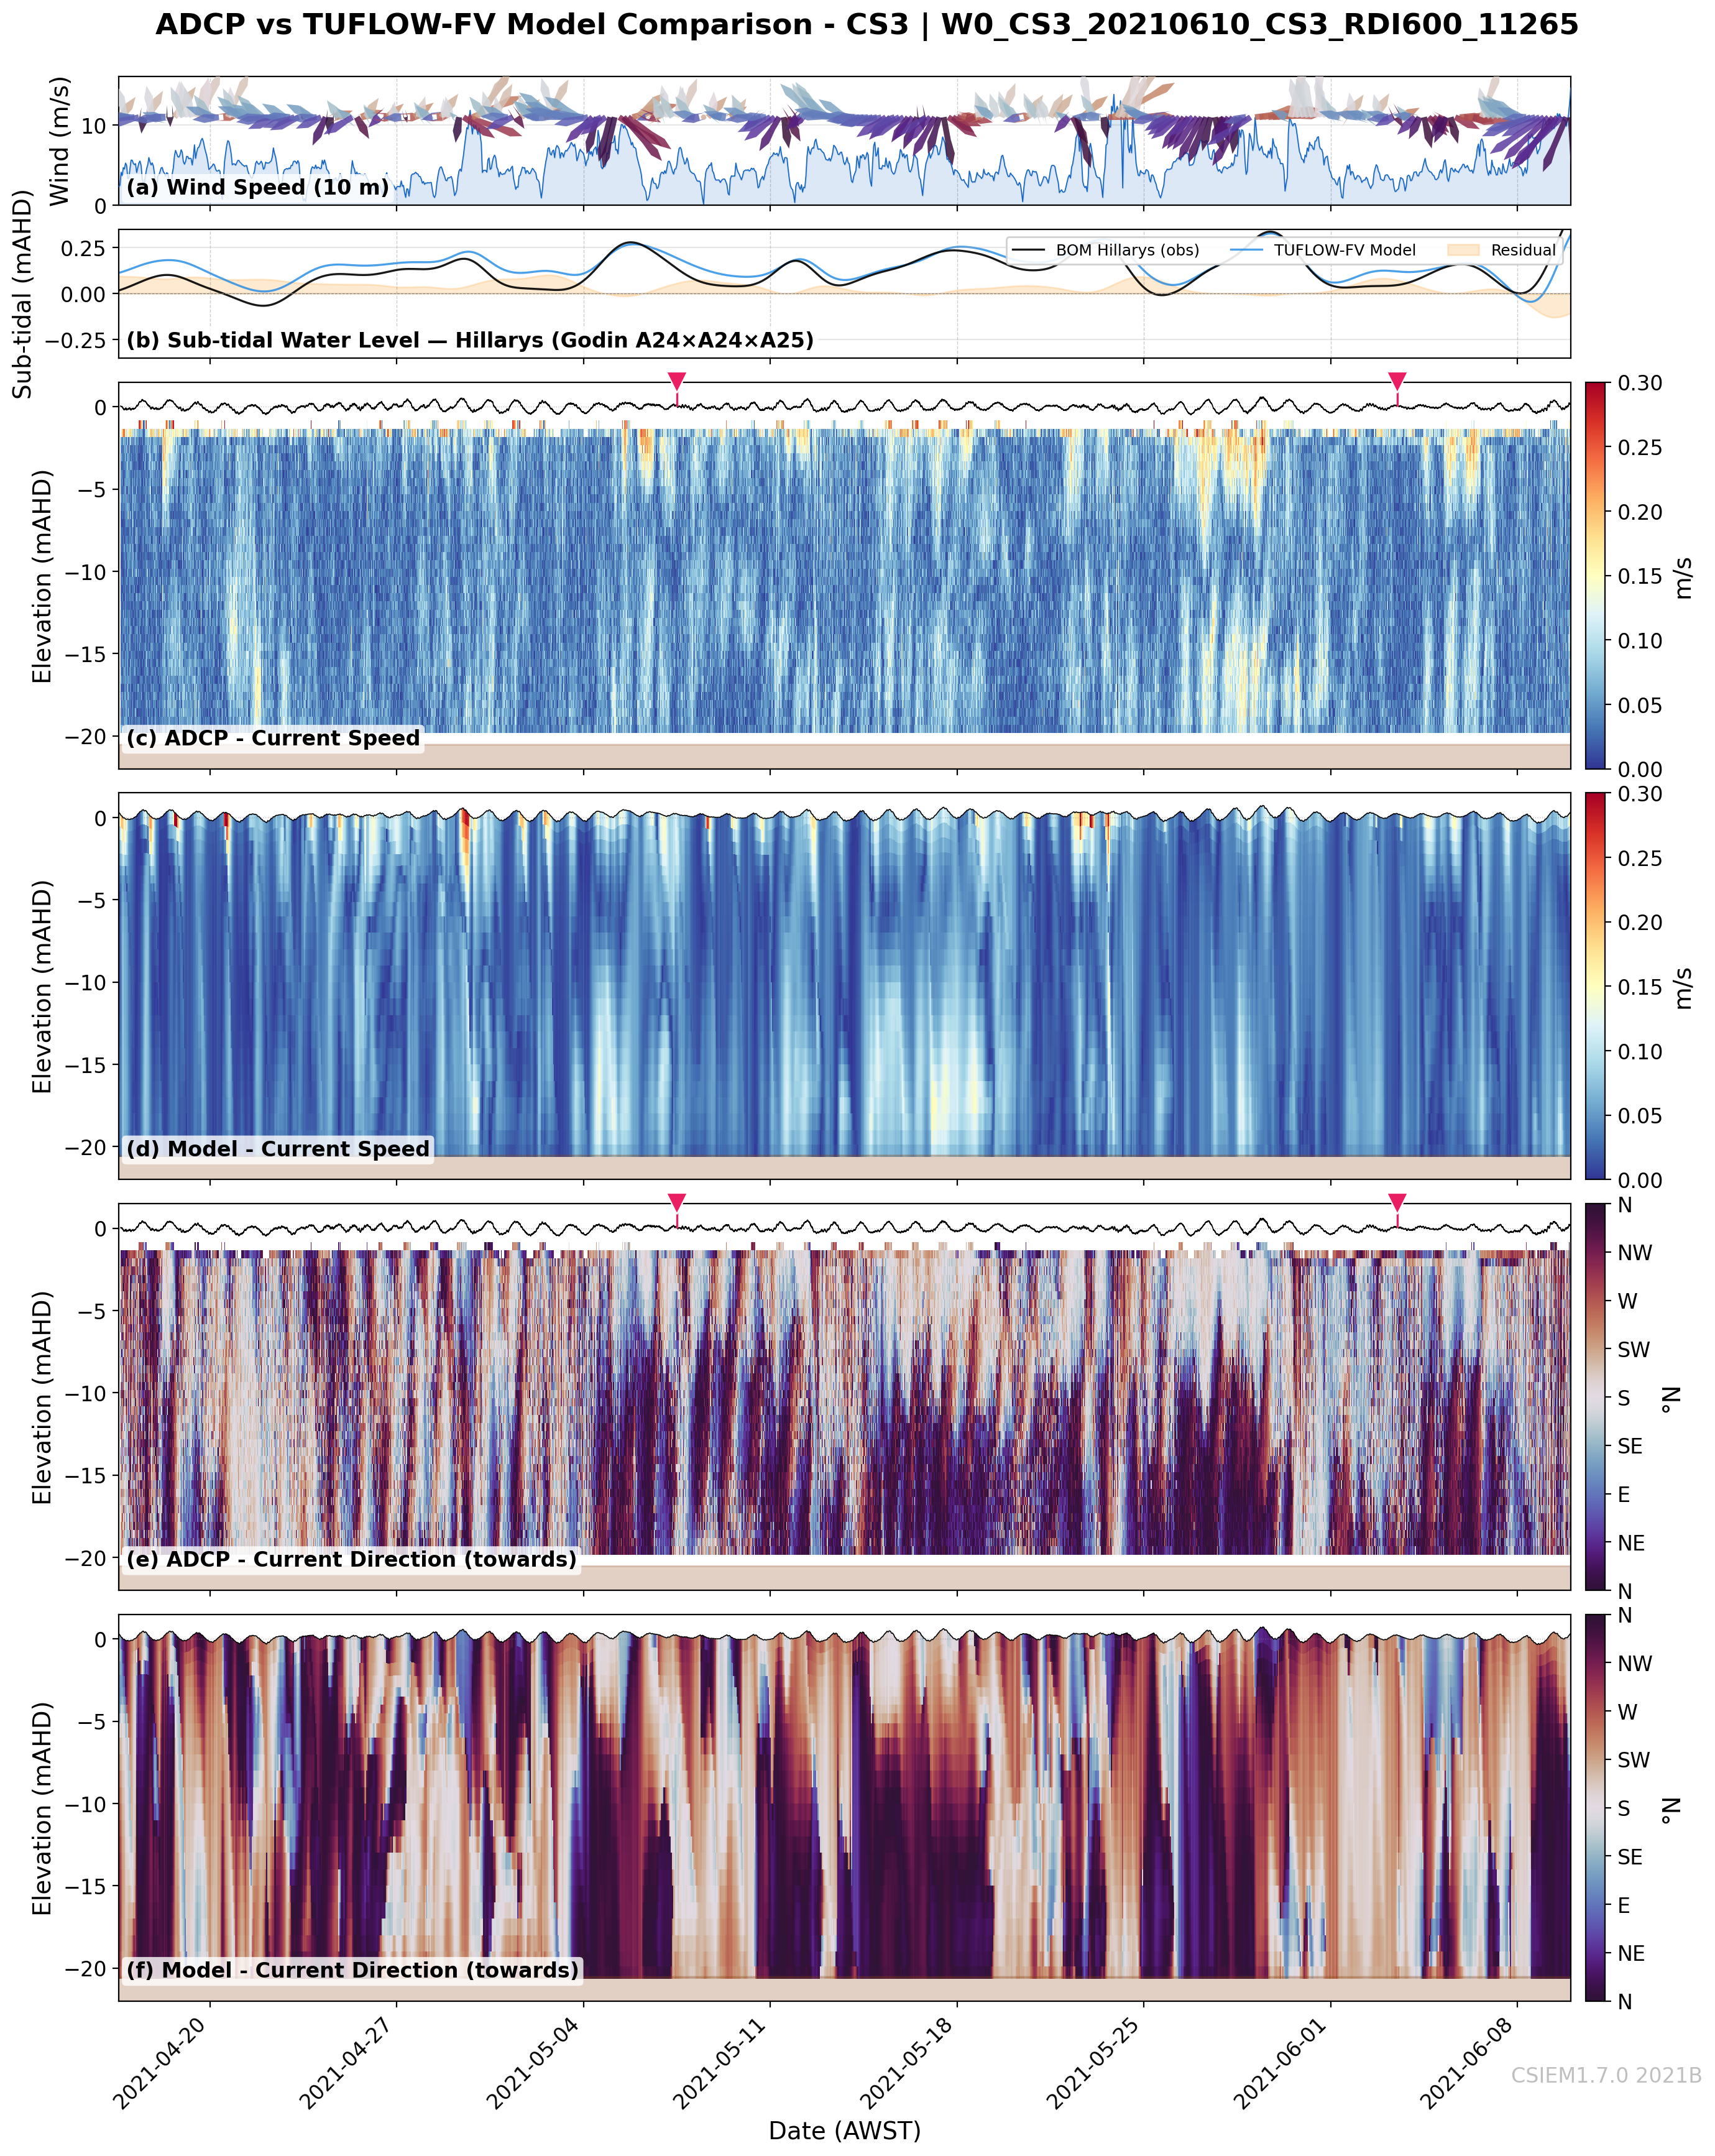
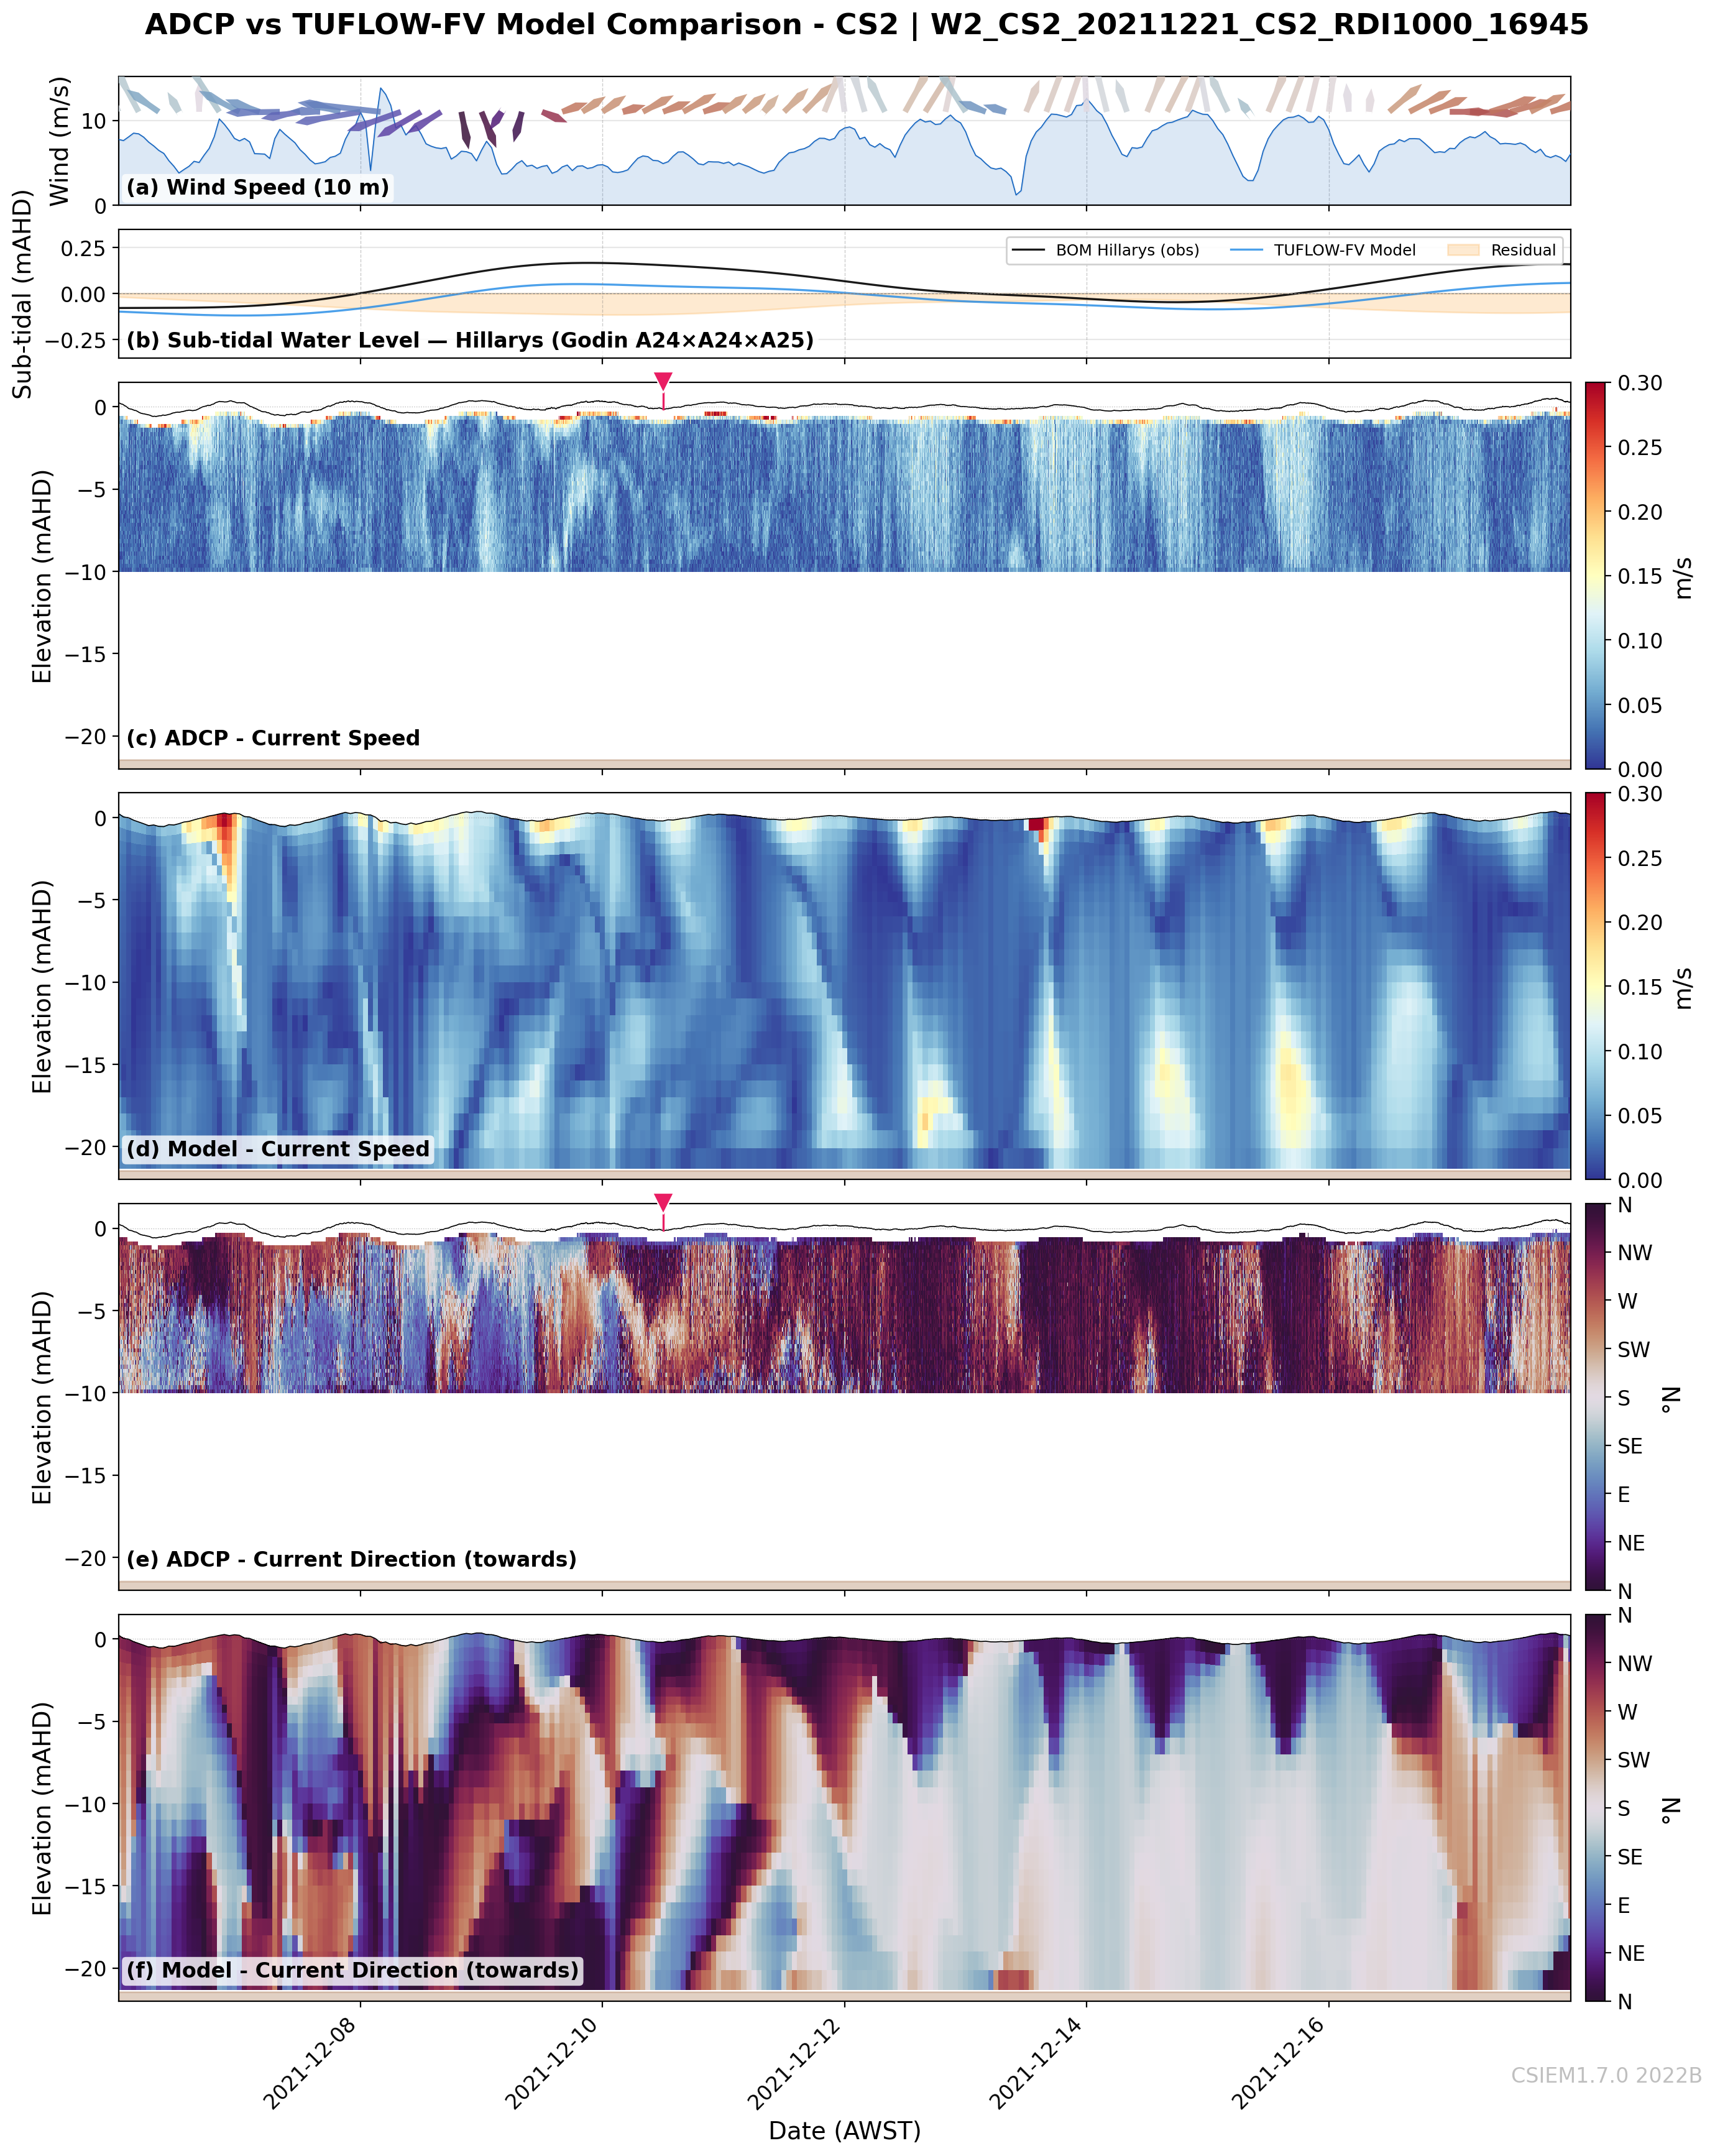
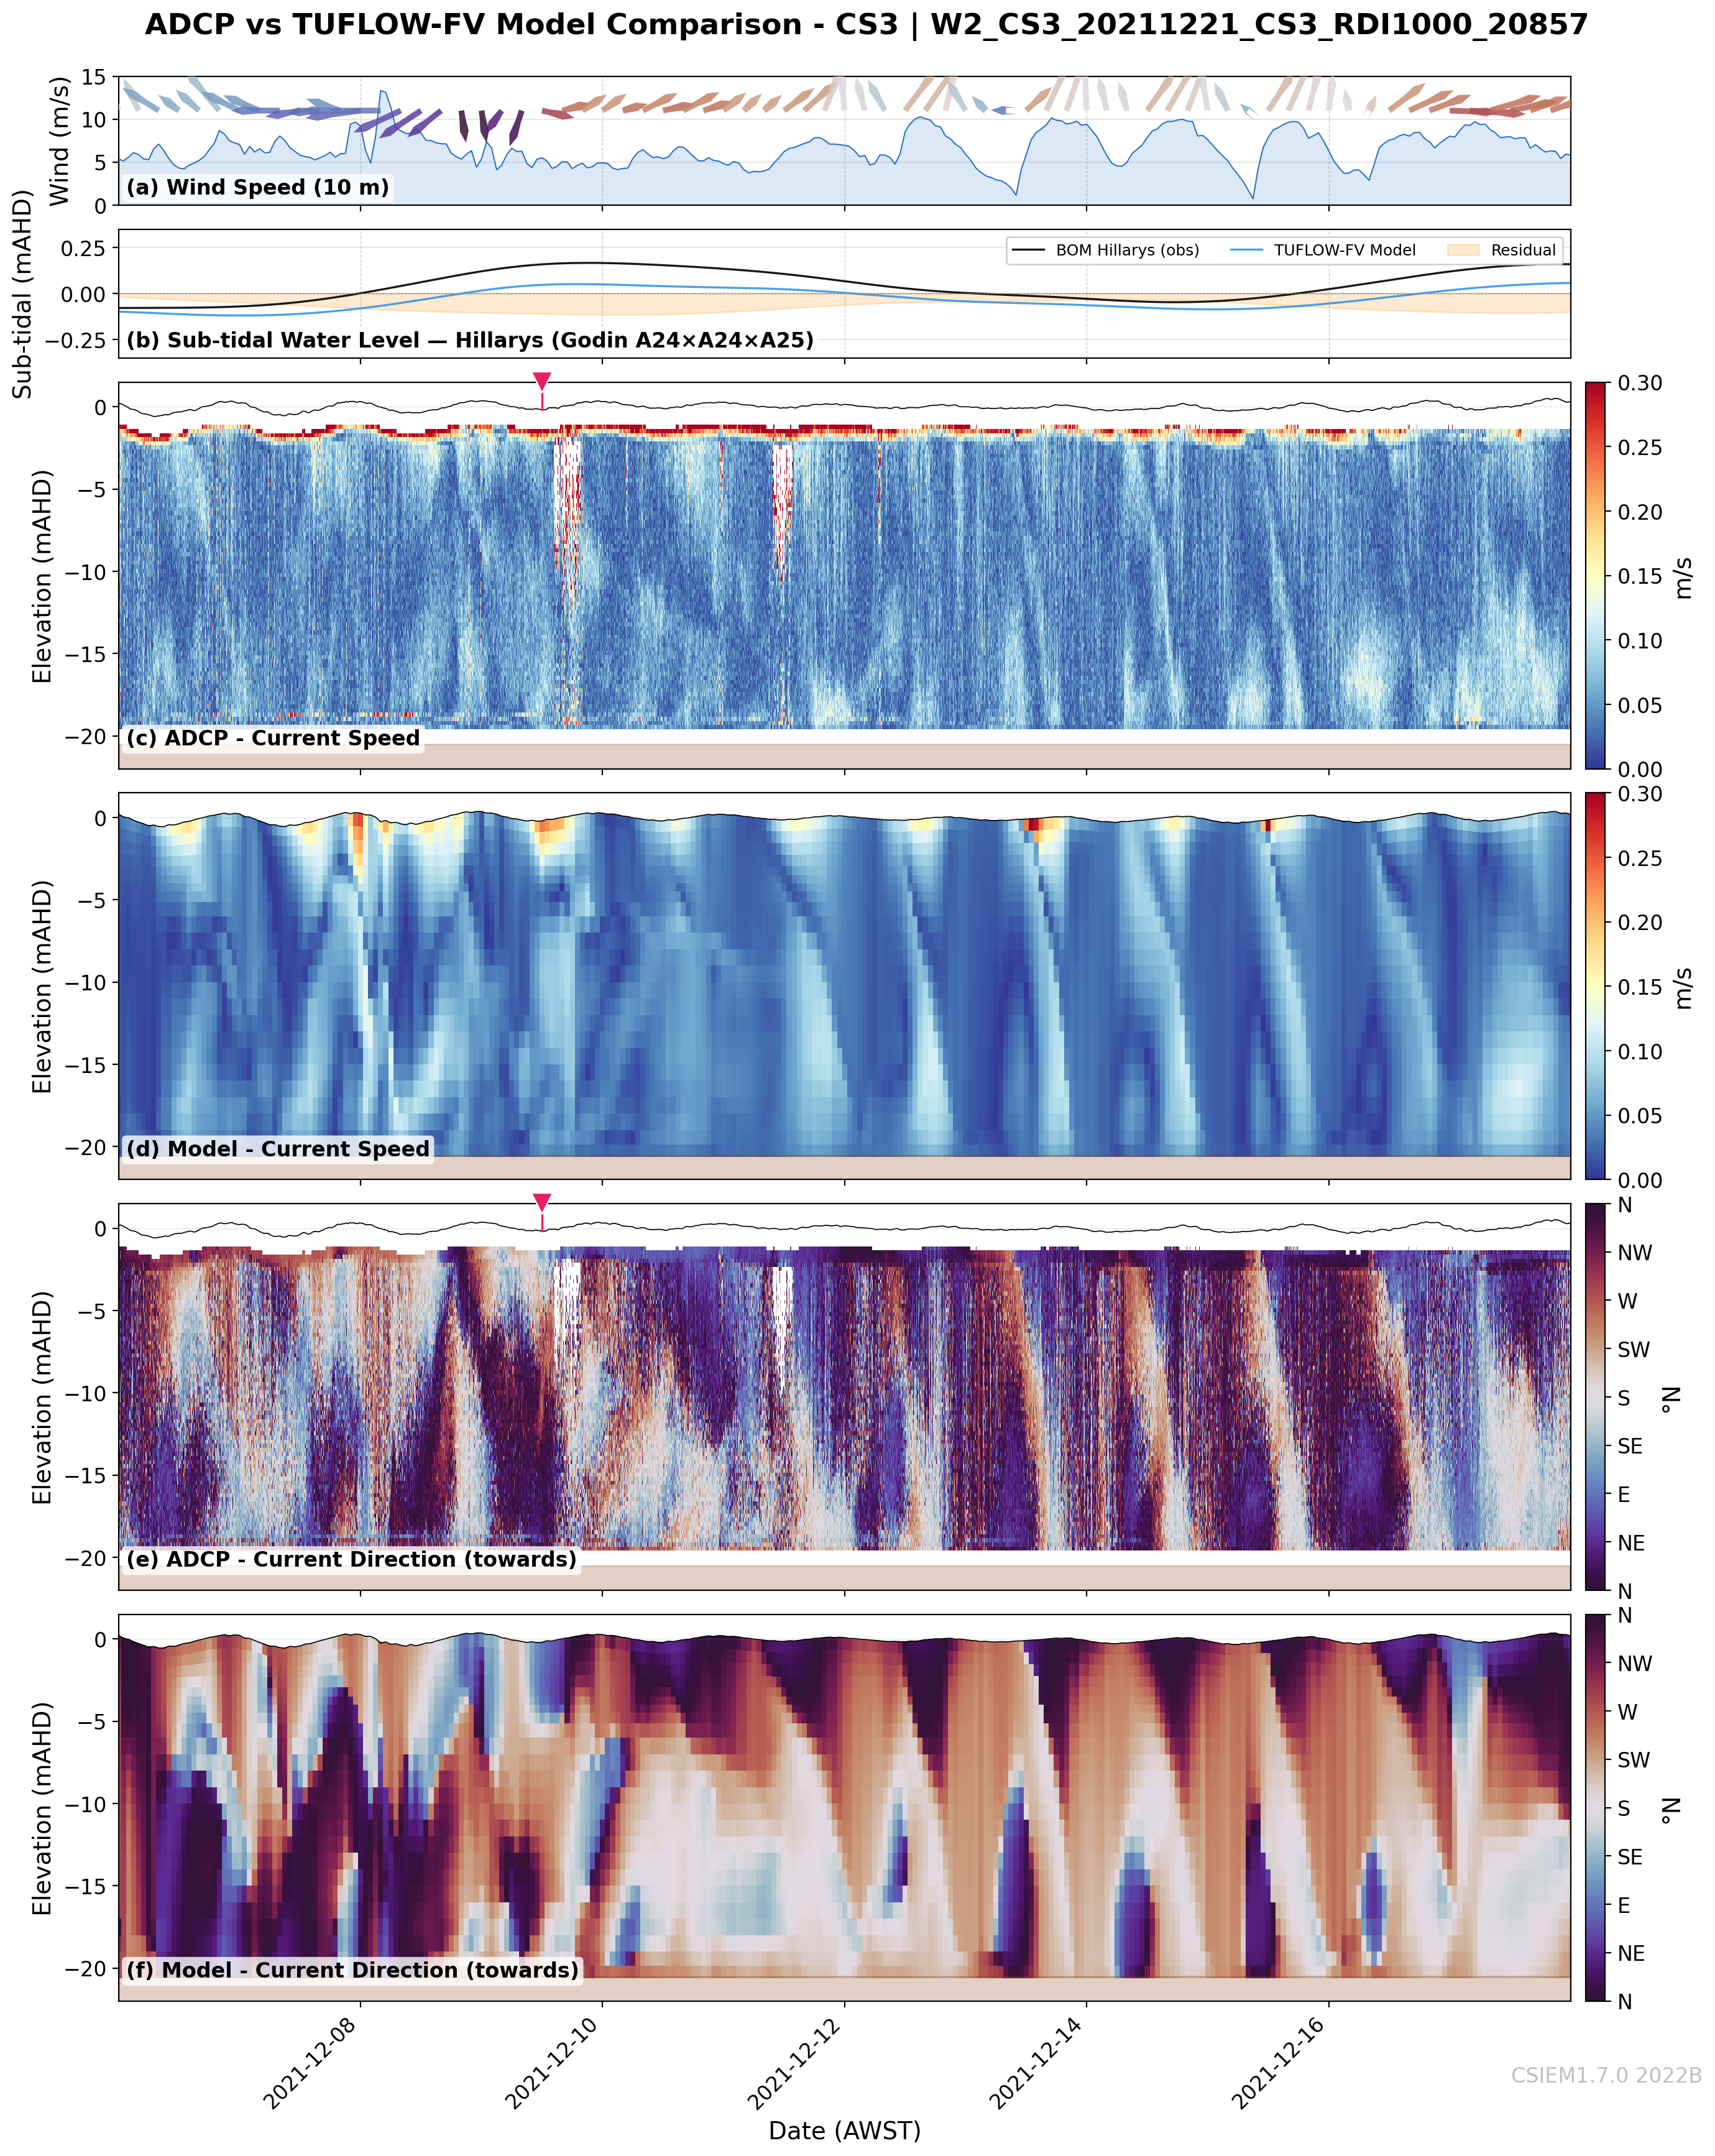
Baseline test at two deep basin sites (CS2, CS3) during seasonal transition
Model notes: Uses 2021B simulation (separate year to W1–W7). Model reproduces stratification–destratification cycles during intermittent calm/wind periods. DWER profiling mooring comparisons confirm model slightly overestimates upper-column temperature; timing of cooling events well captured. CS3 persistent directional offset in lower water column already apparent.
CS6 not available
CS2 (20m) — Basin (mid-west)
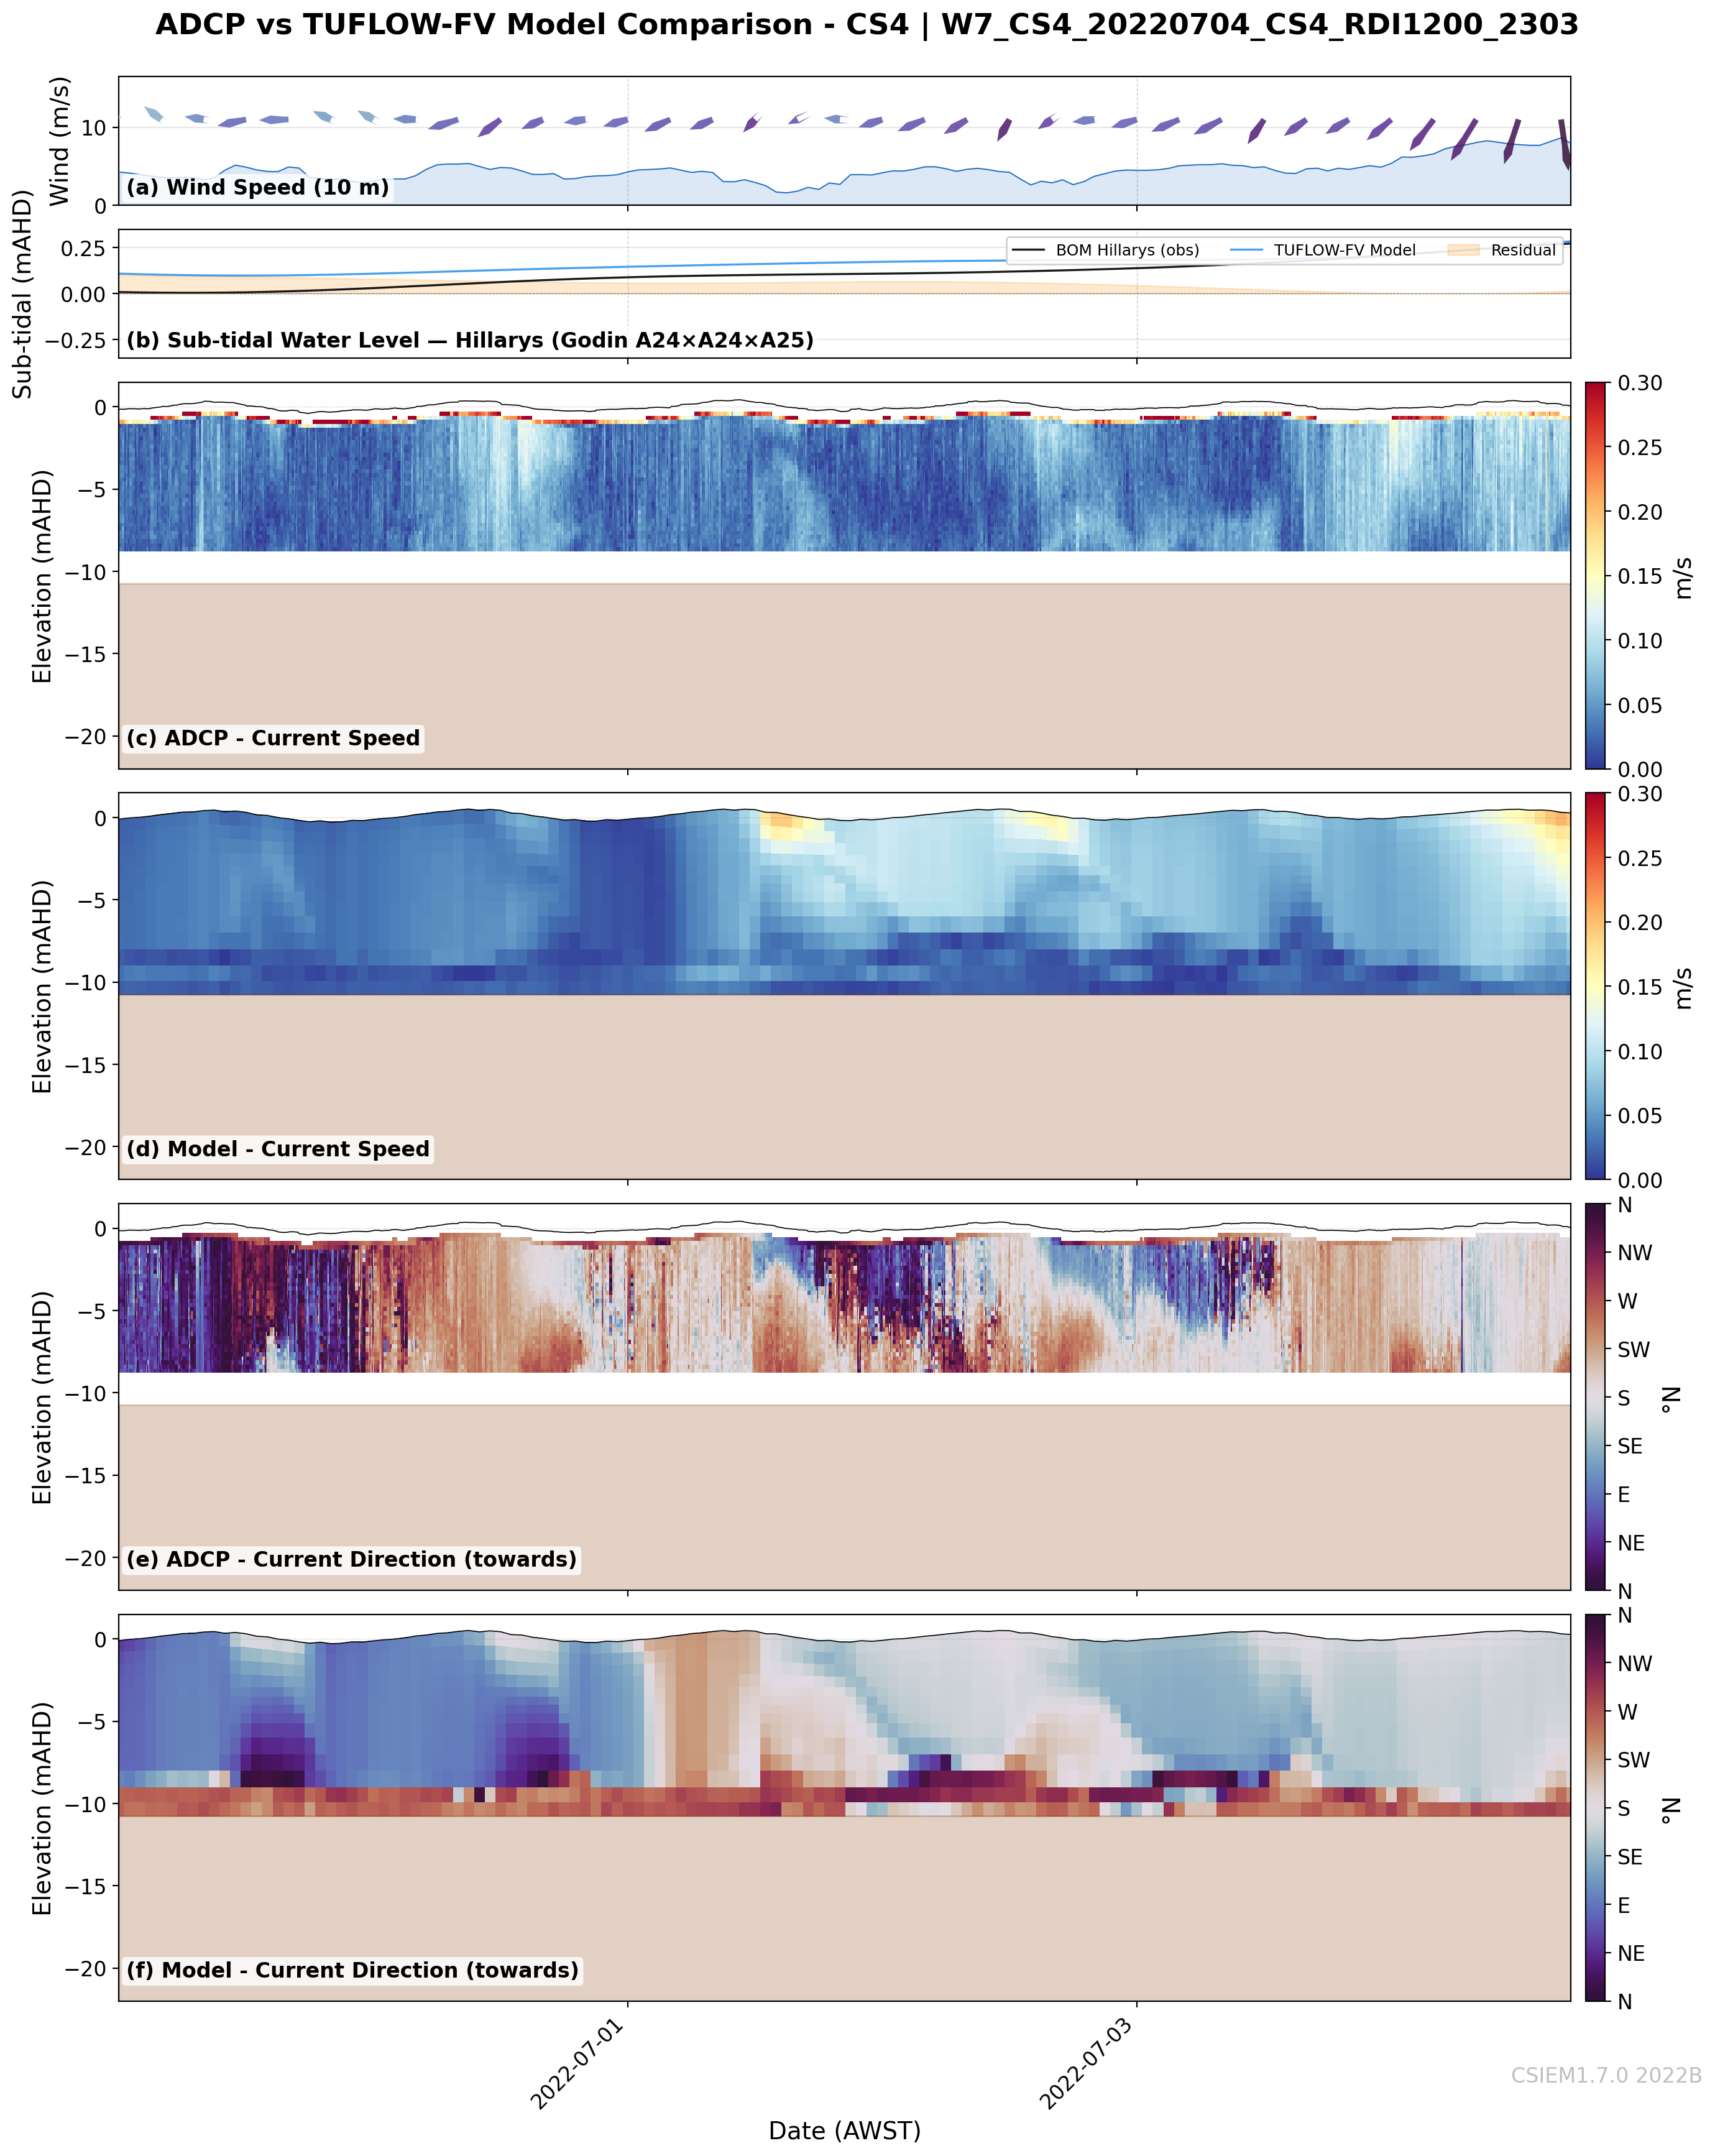
CS4 not available
CS7 not available
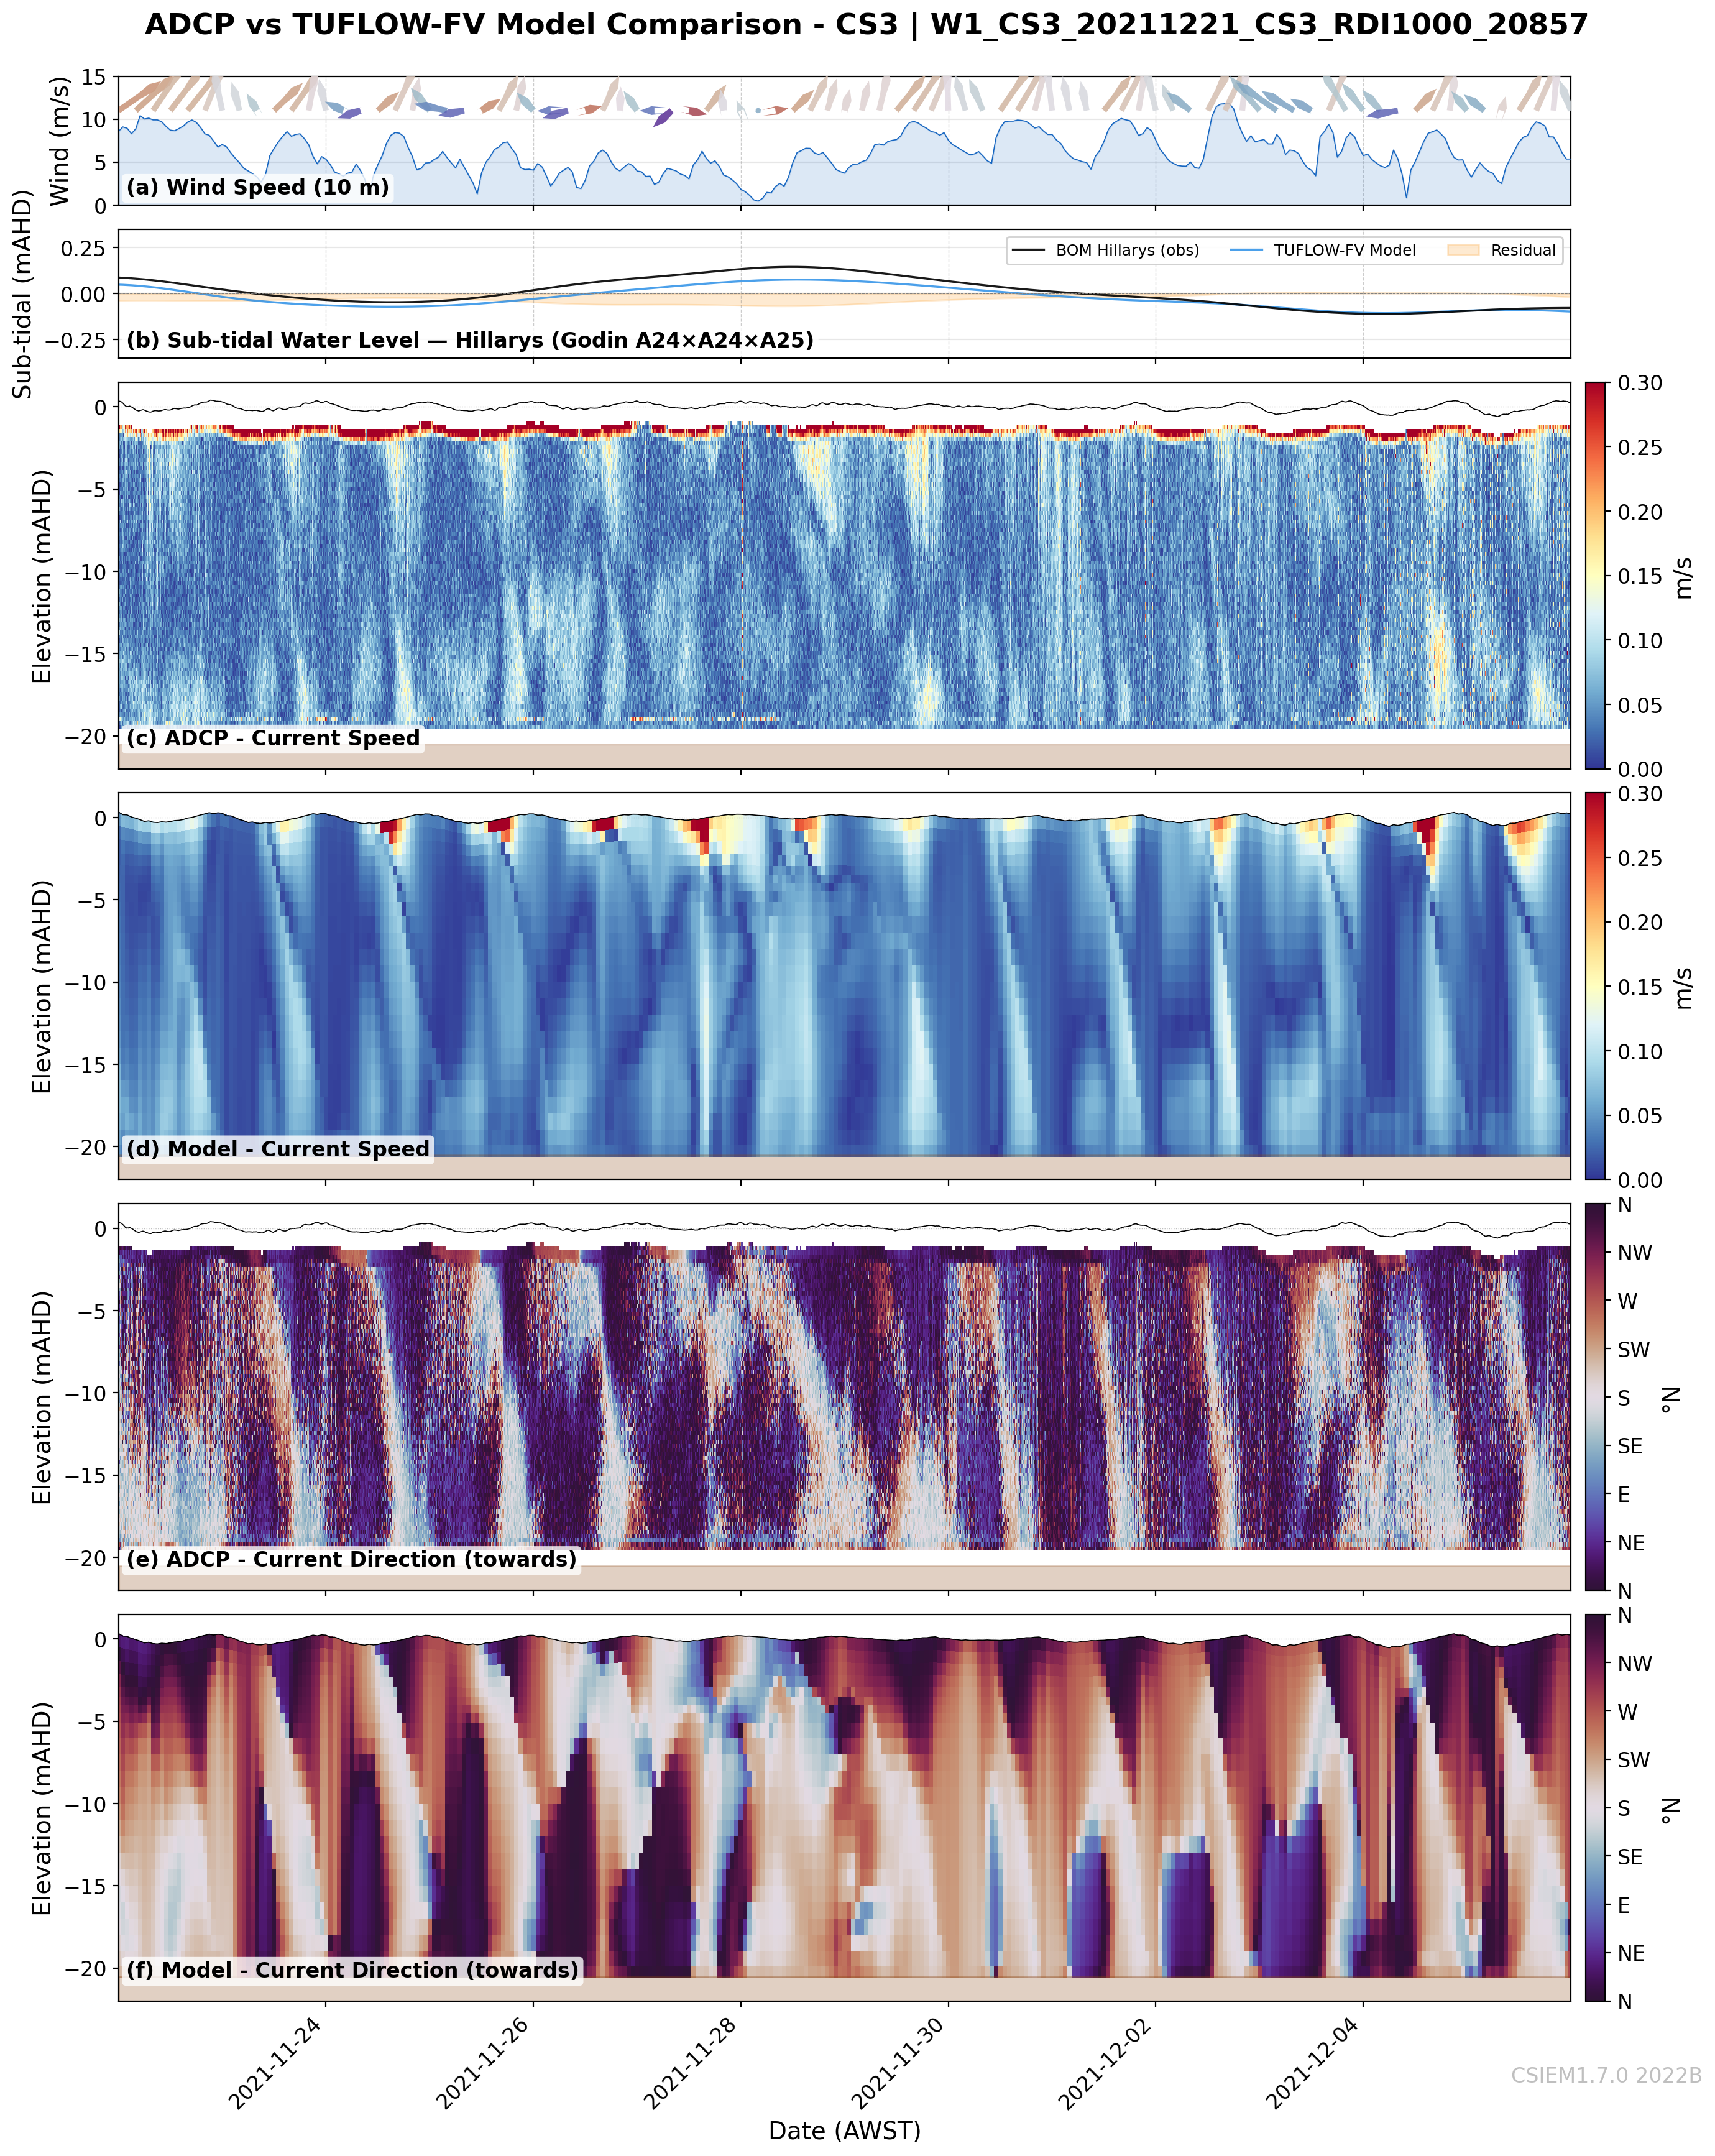
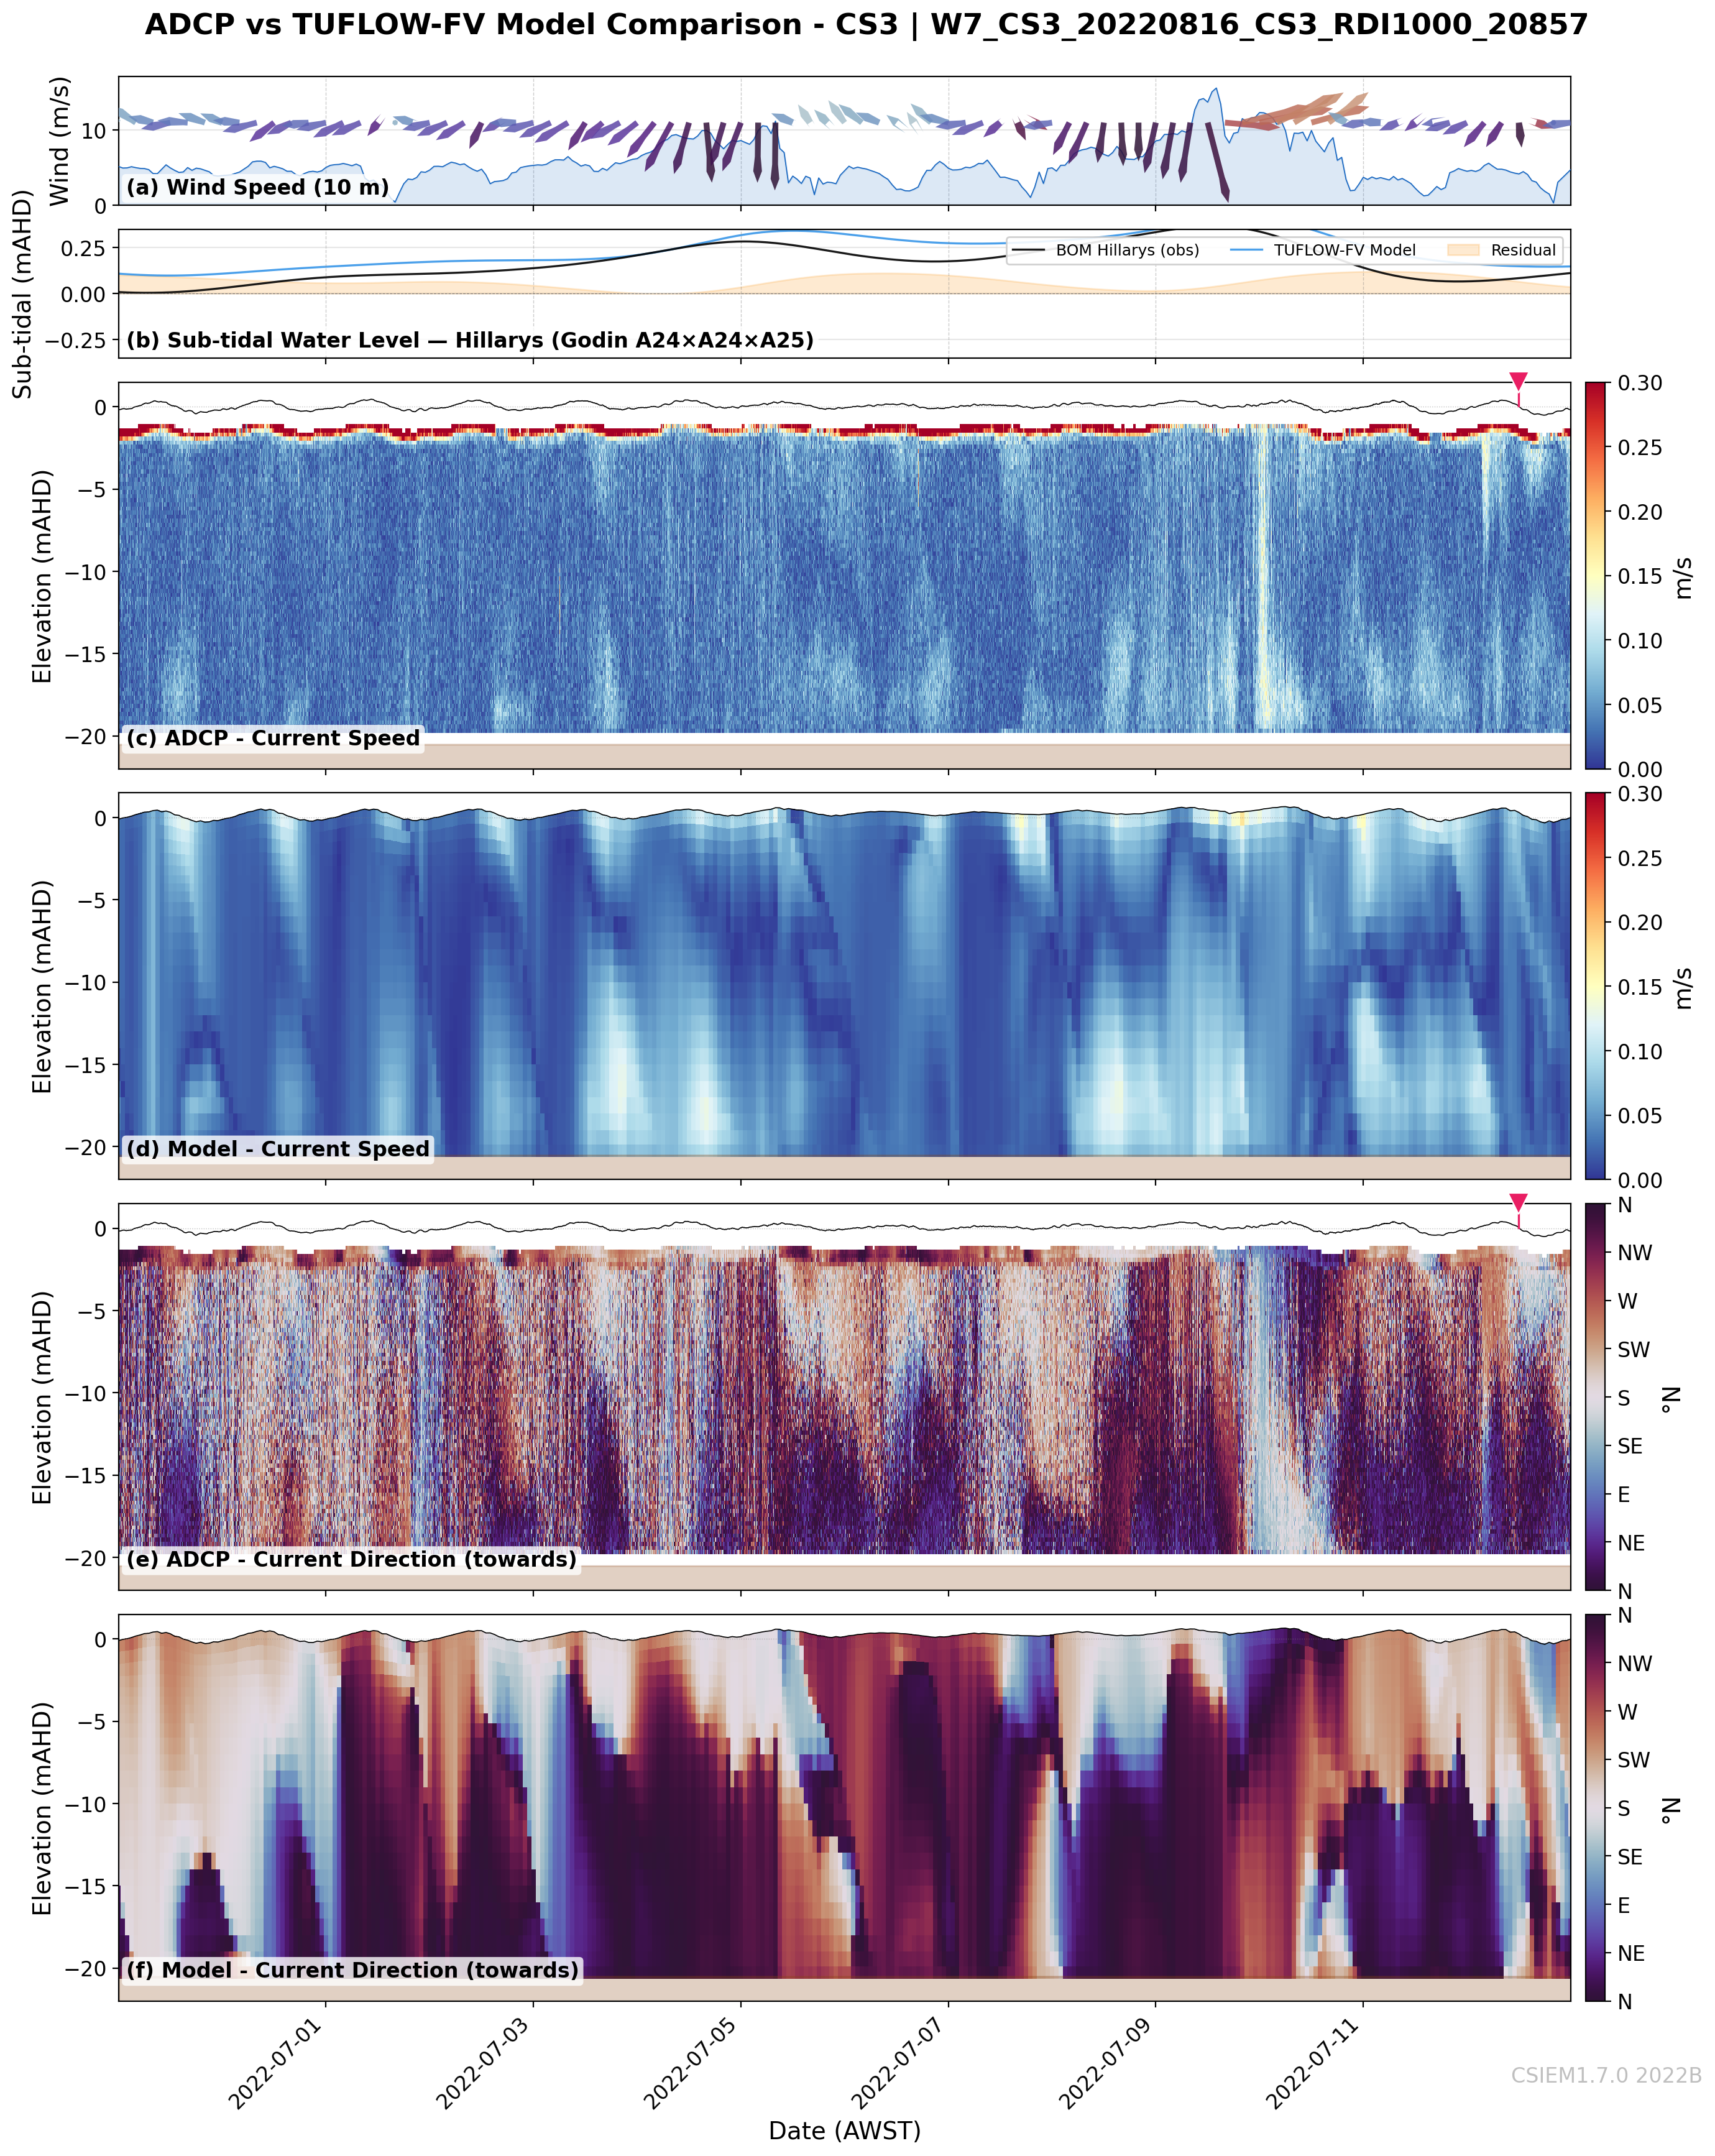
CS3 (20m) — Basin (south)
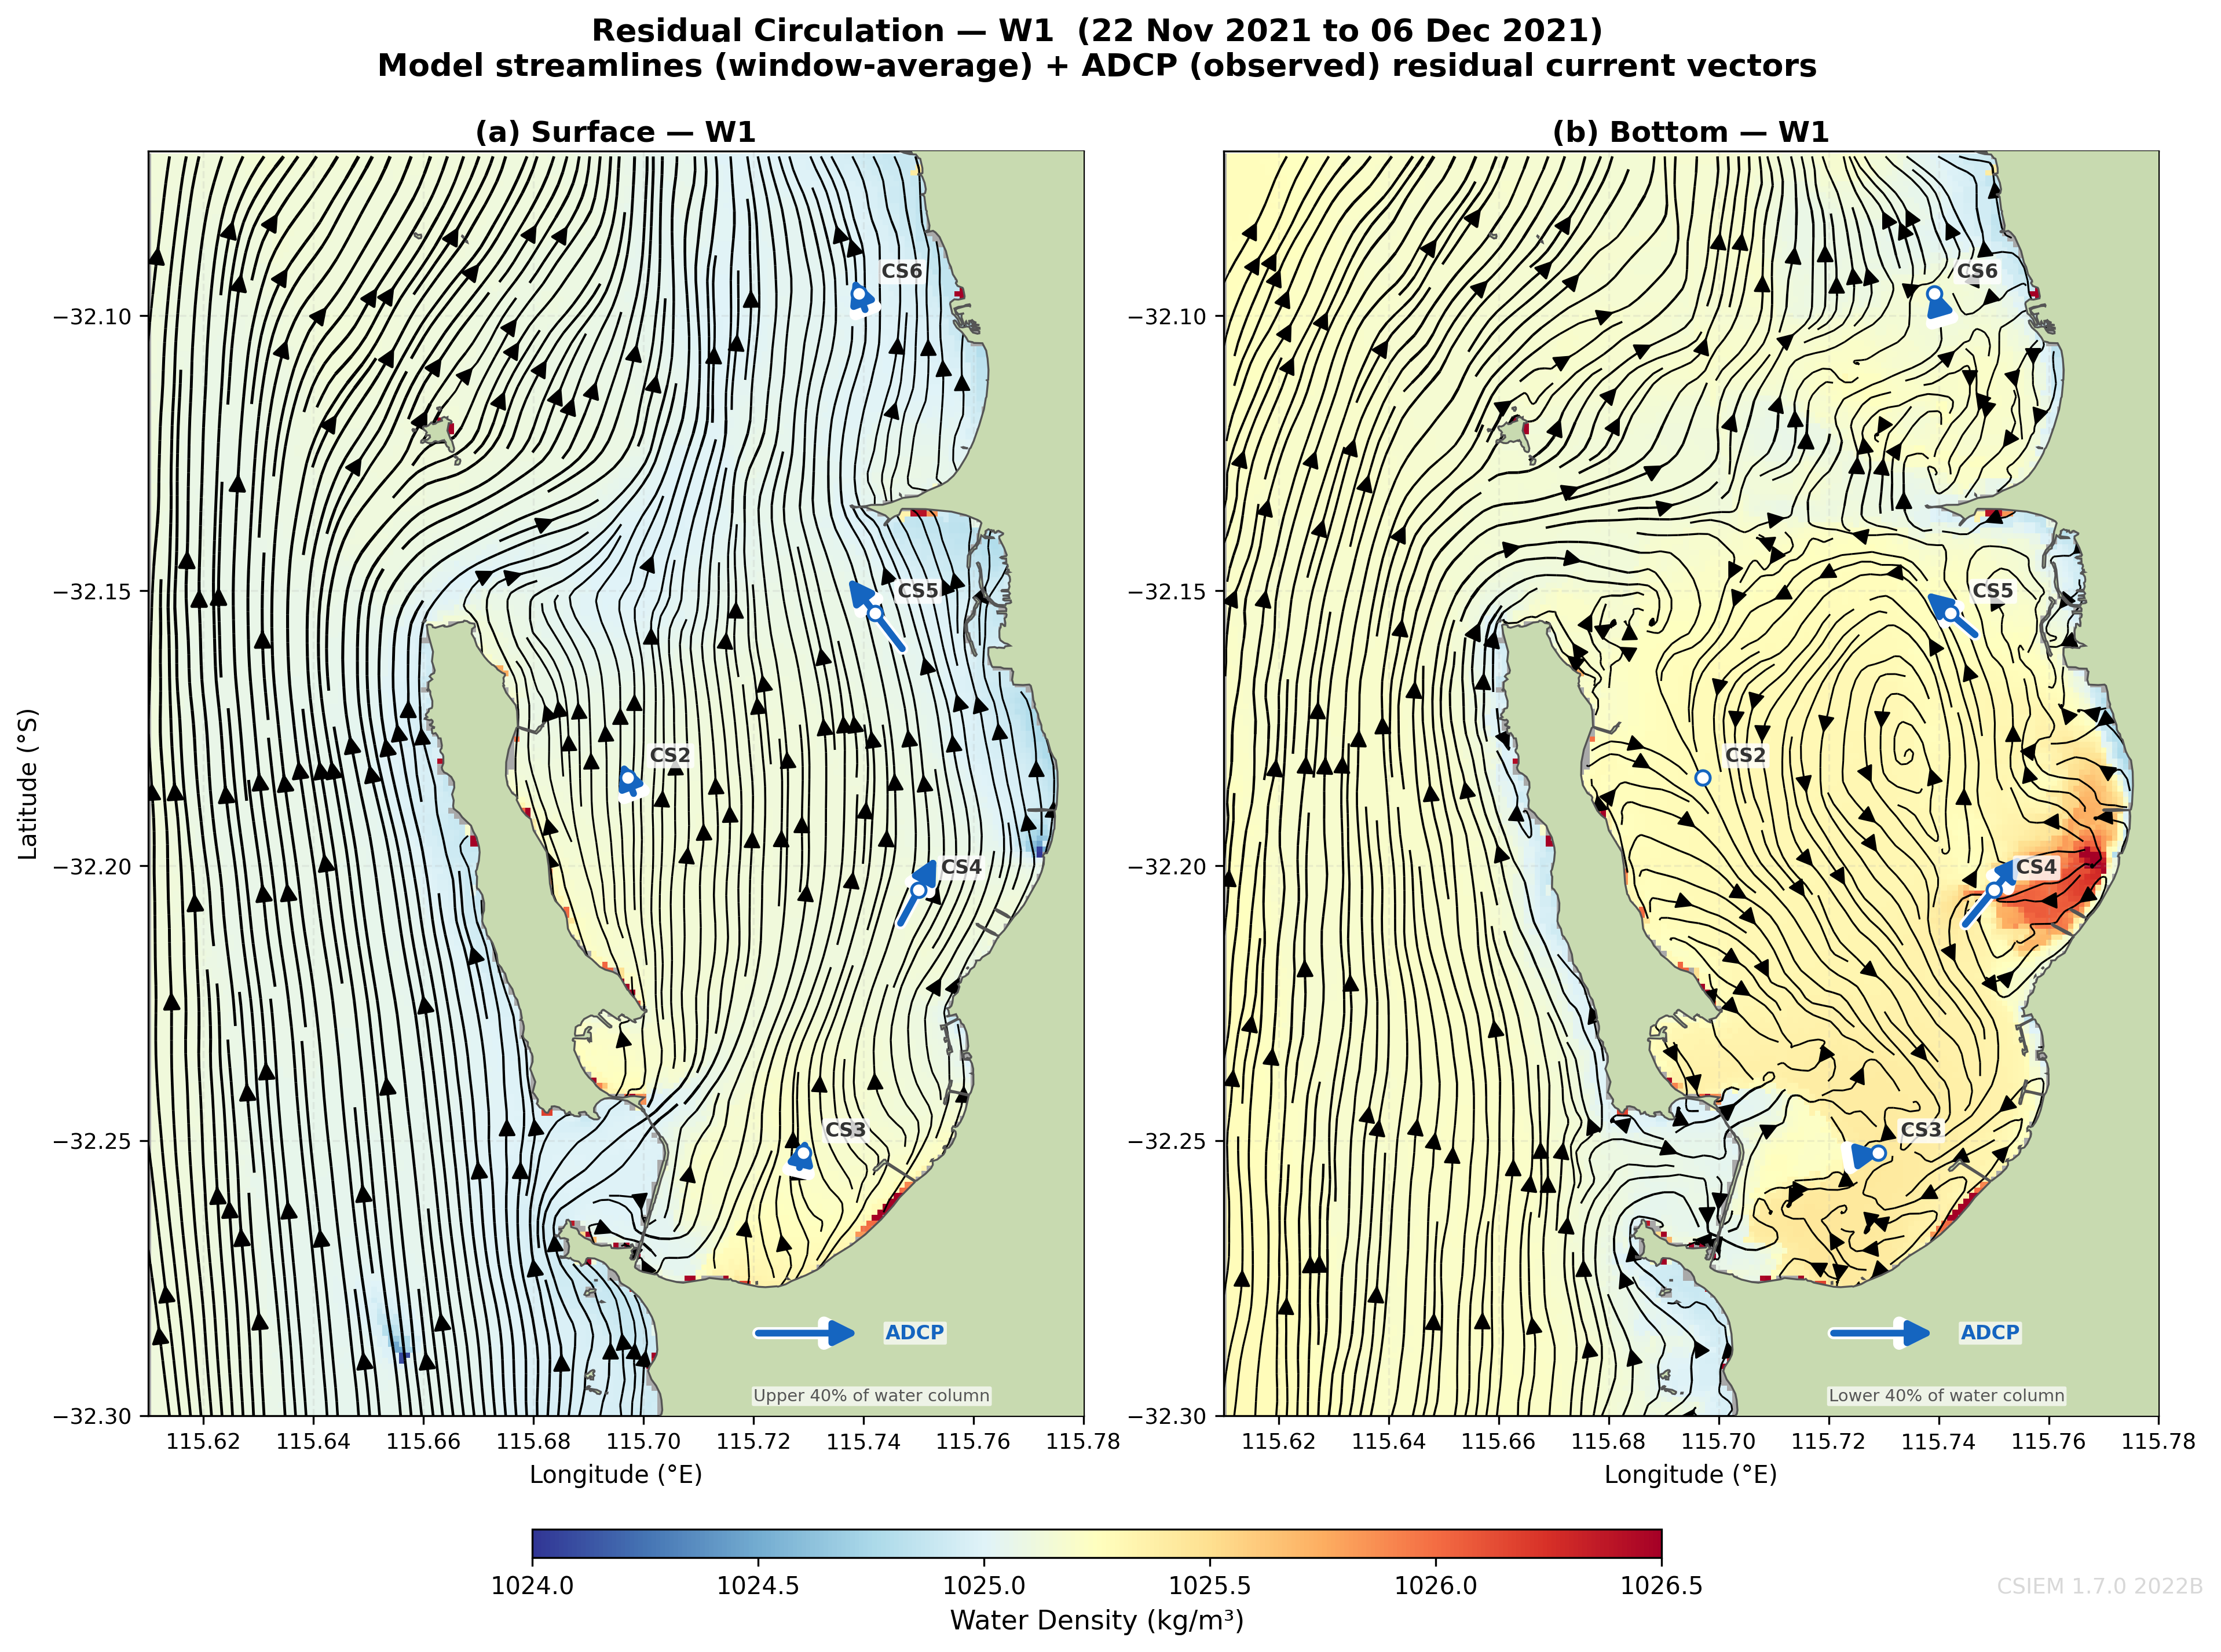
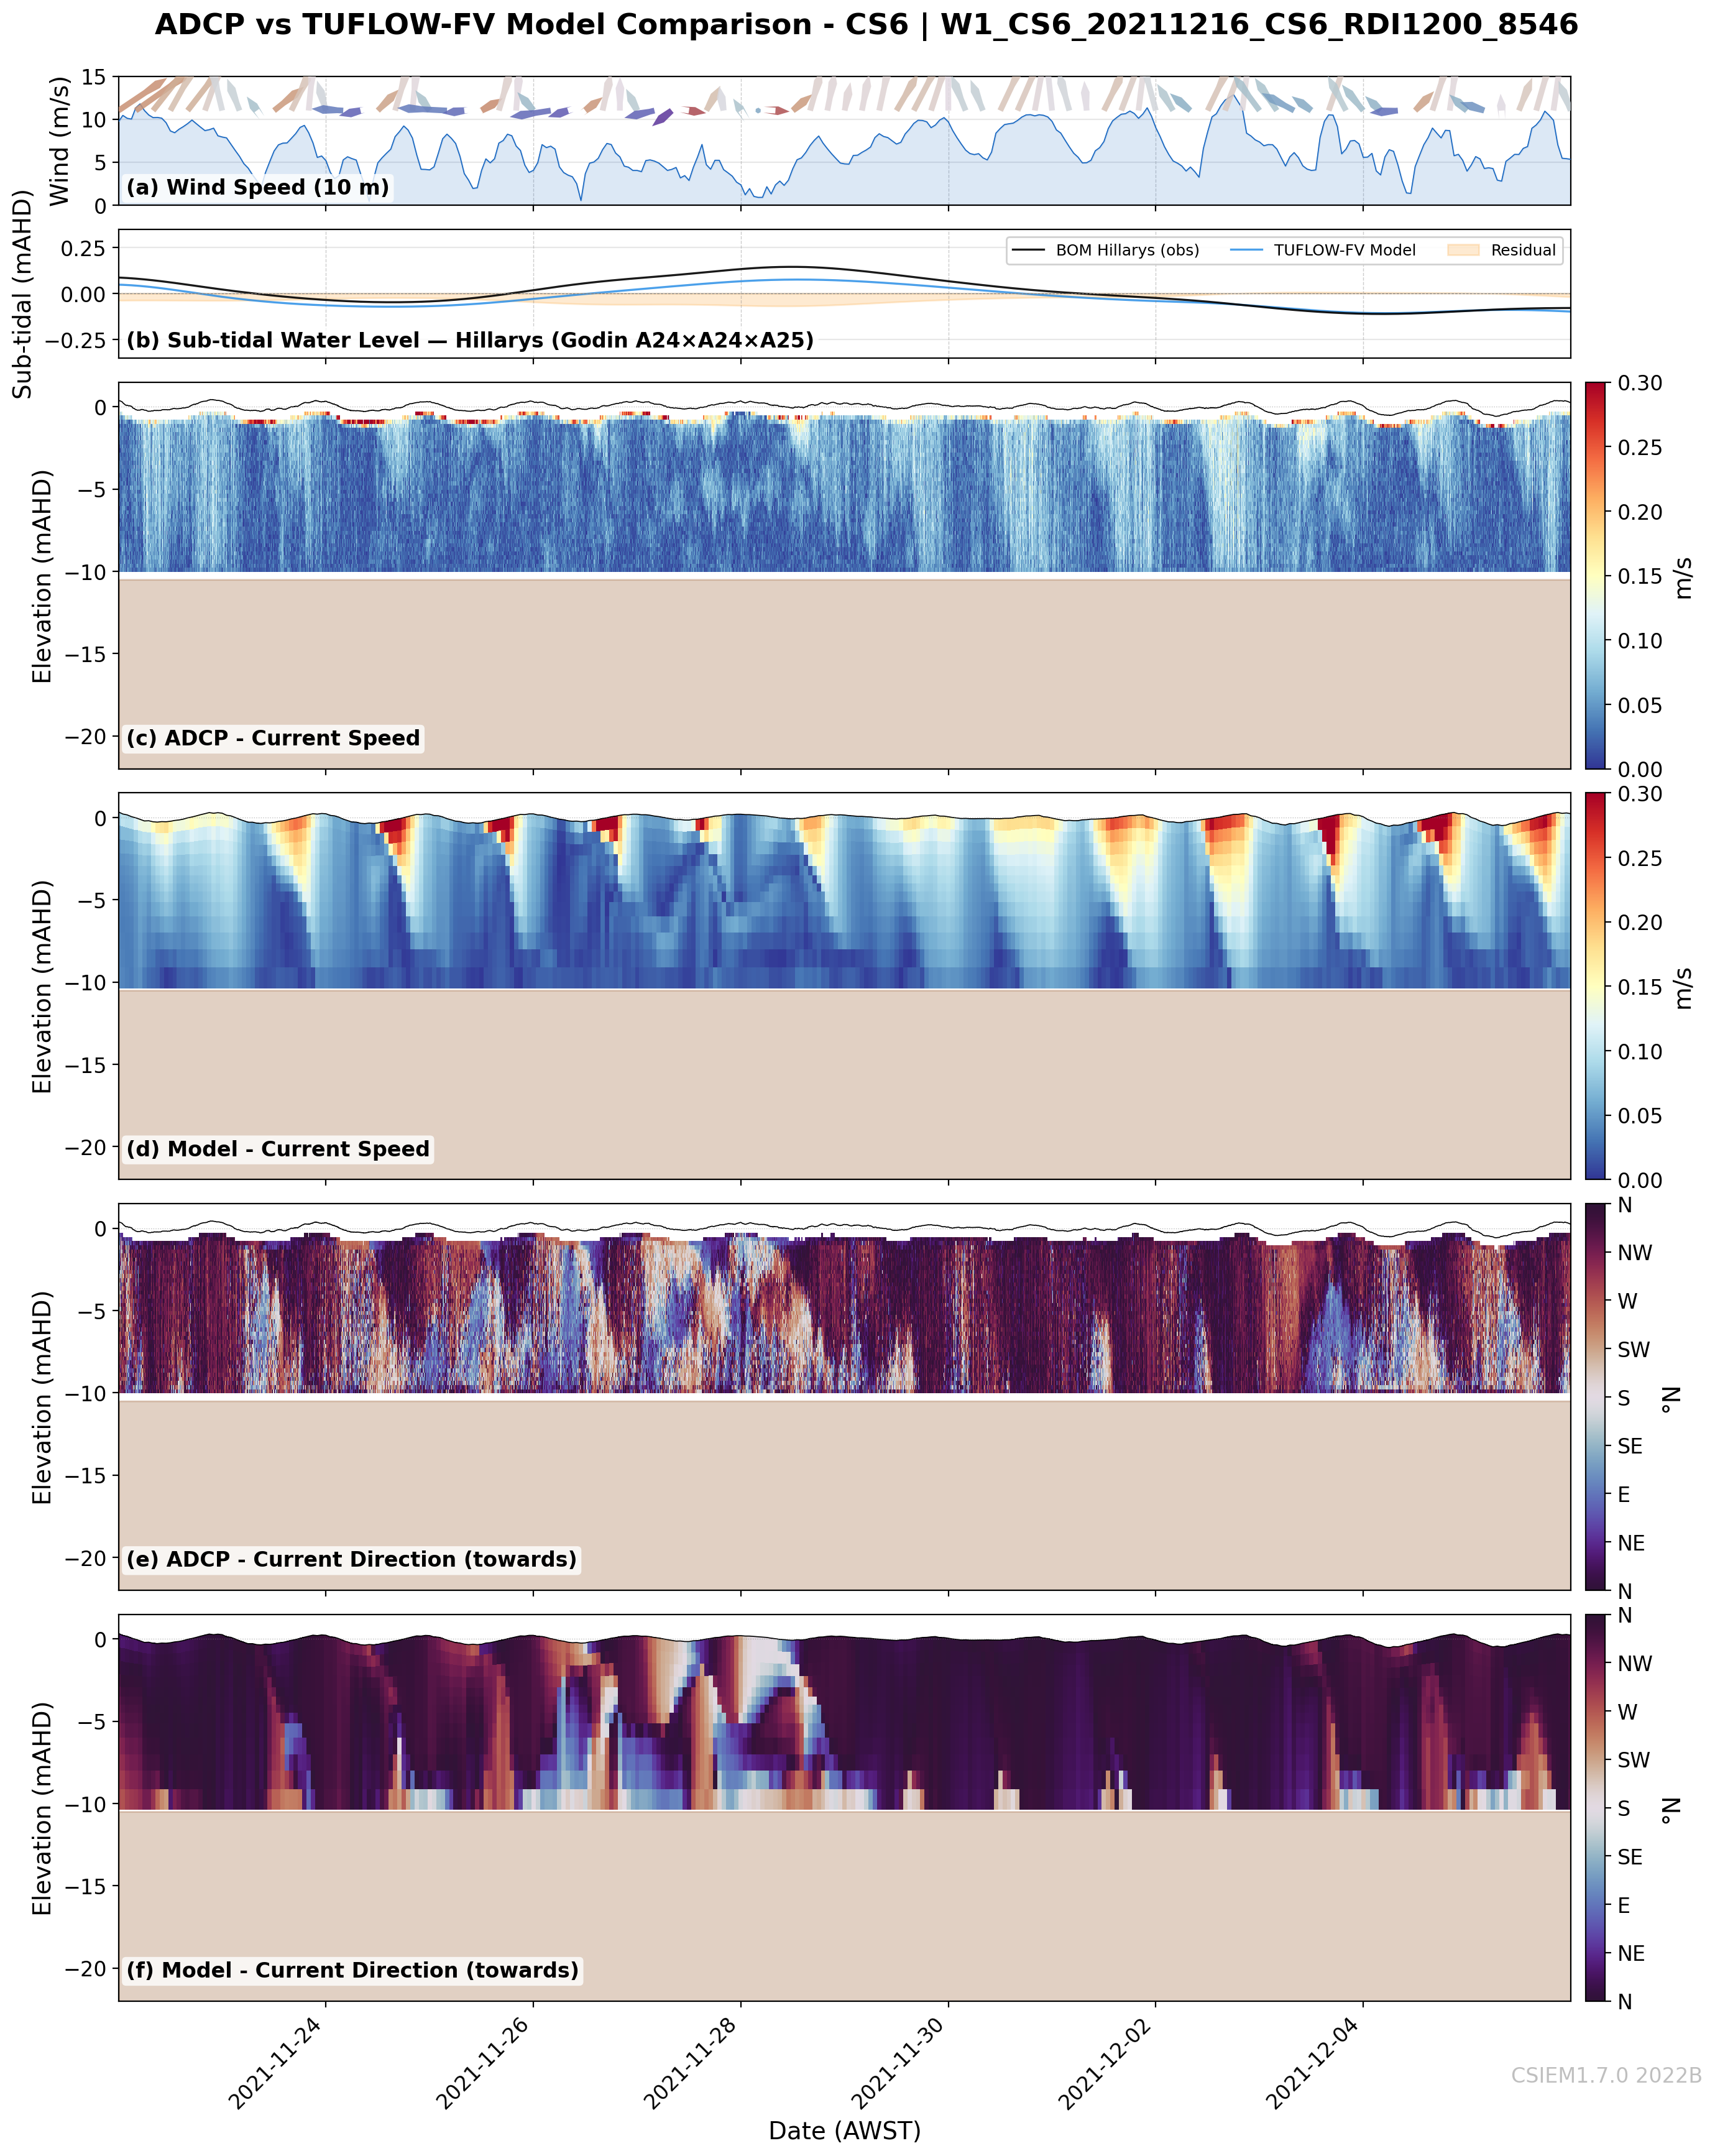
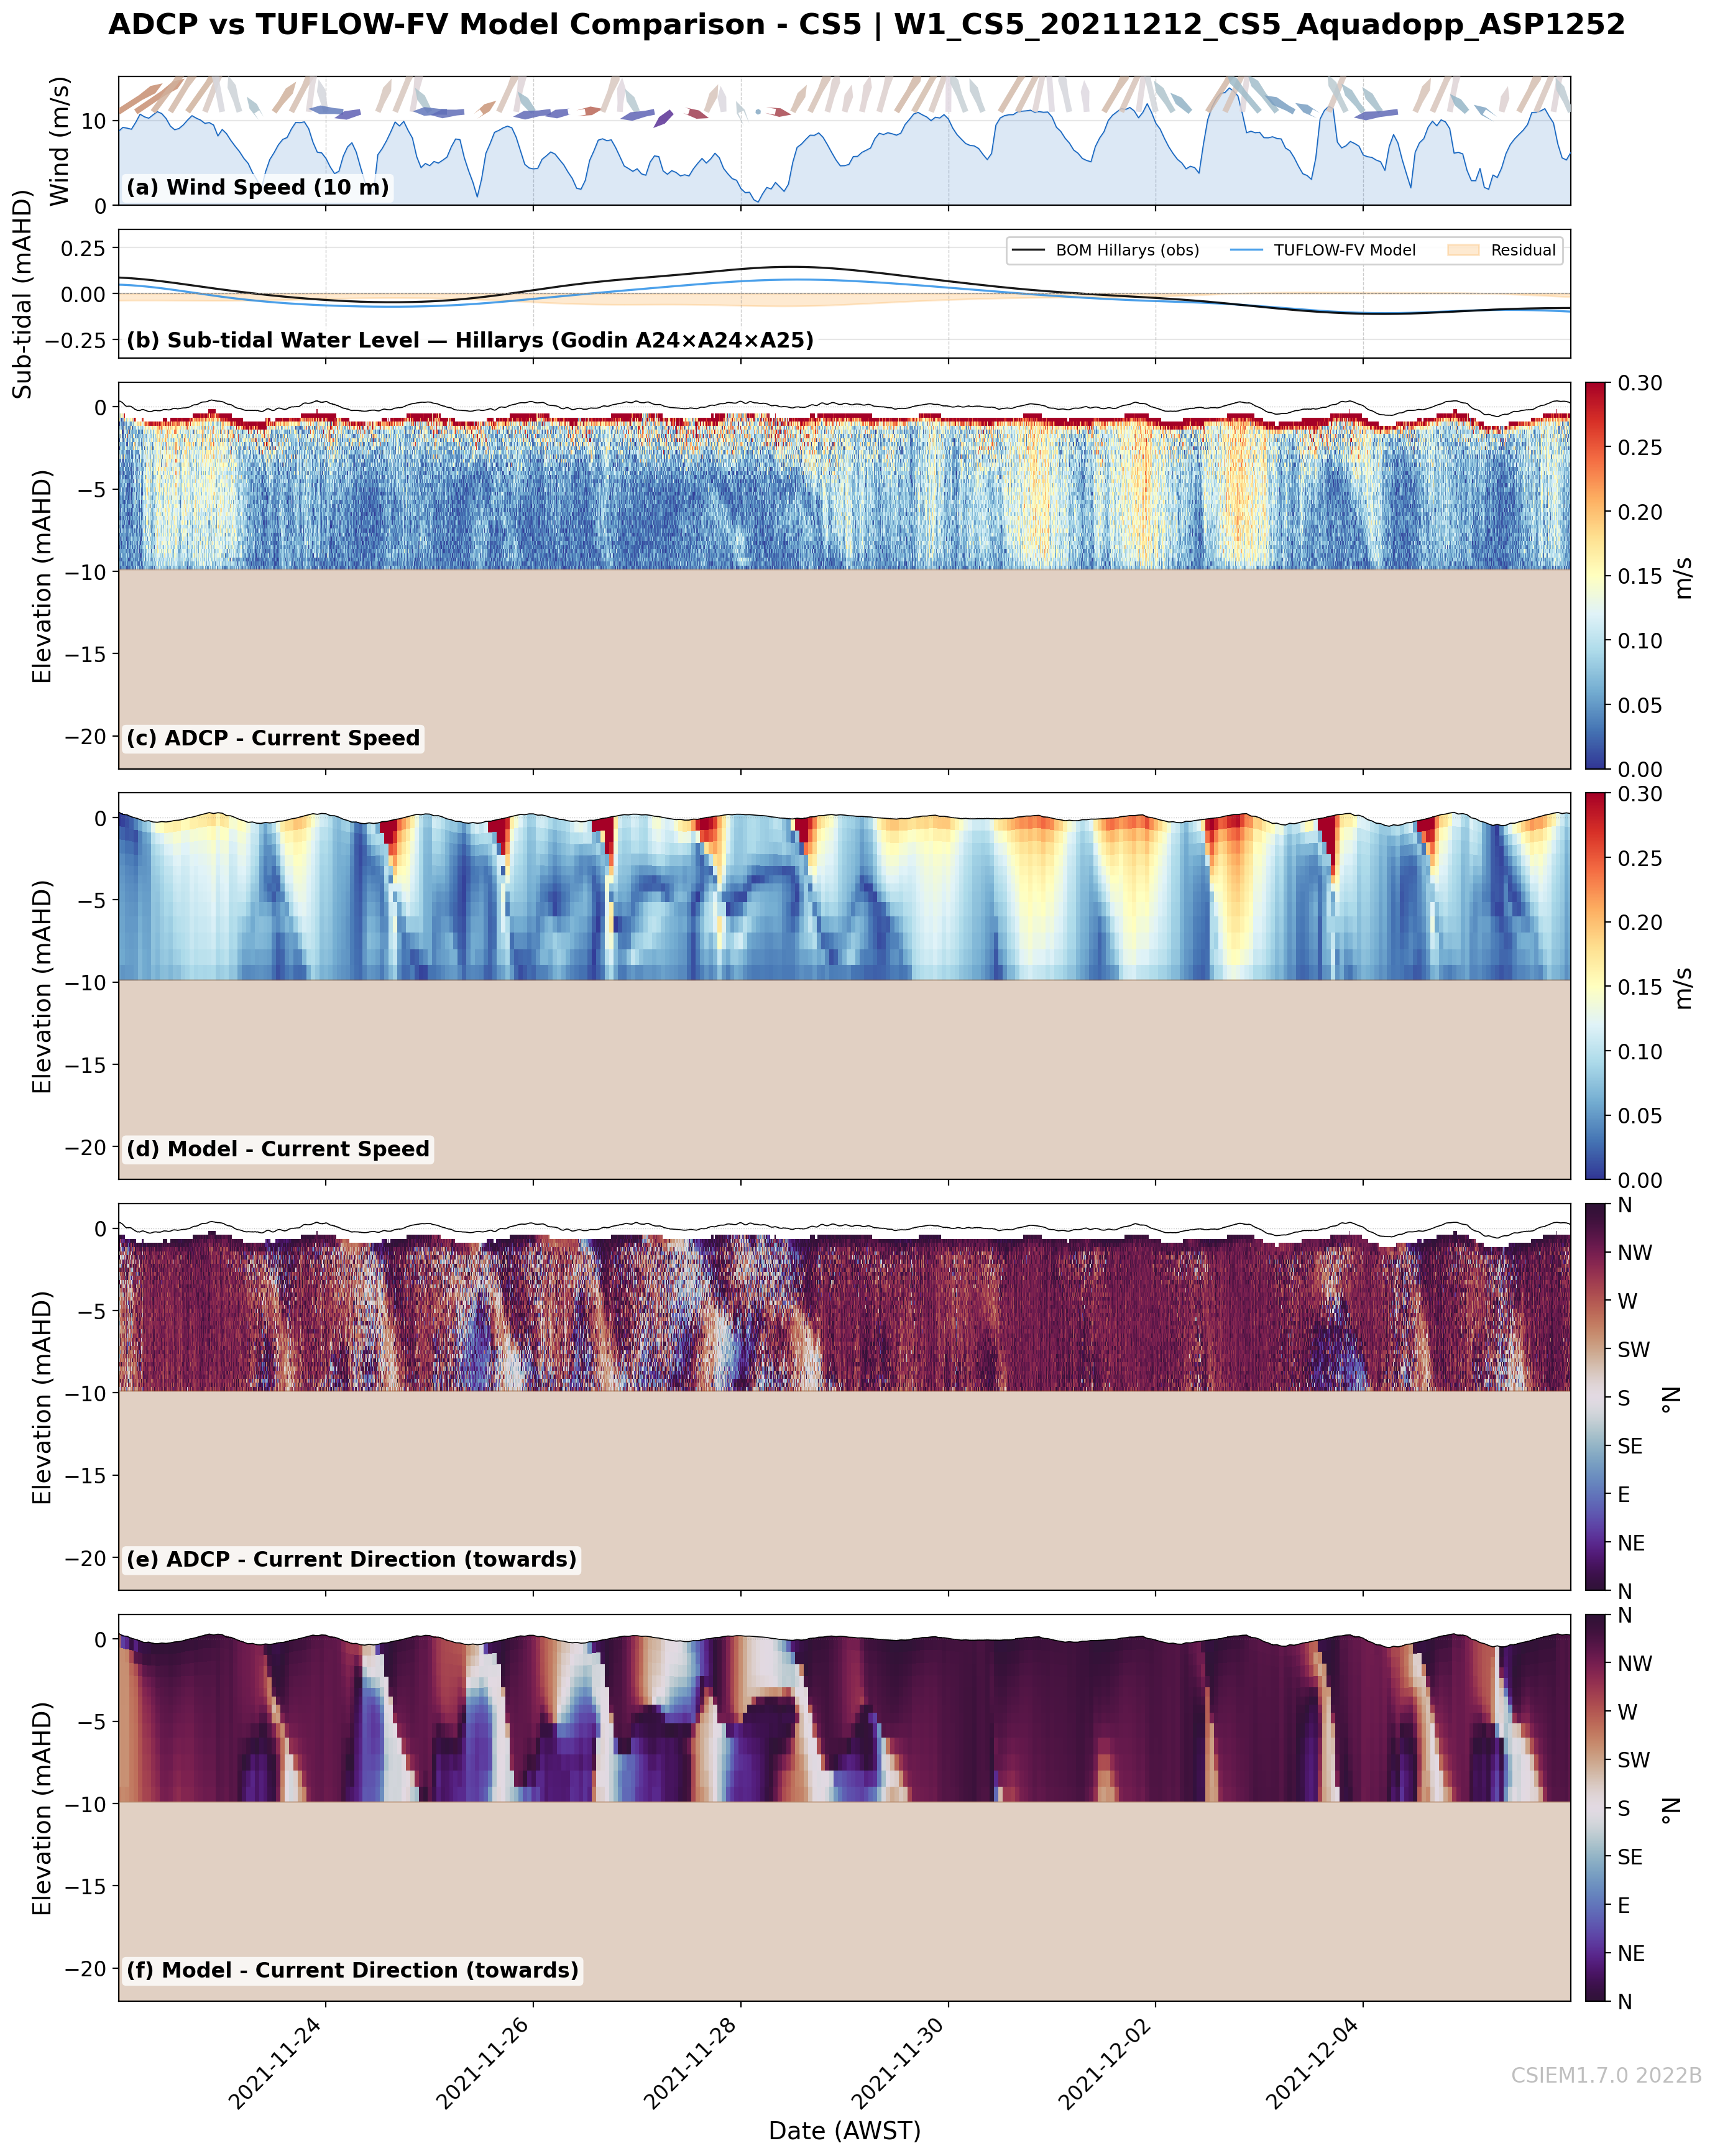
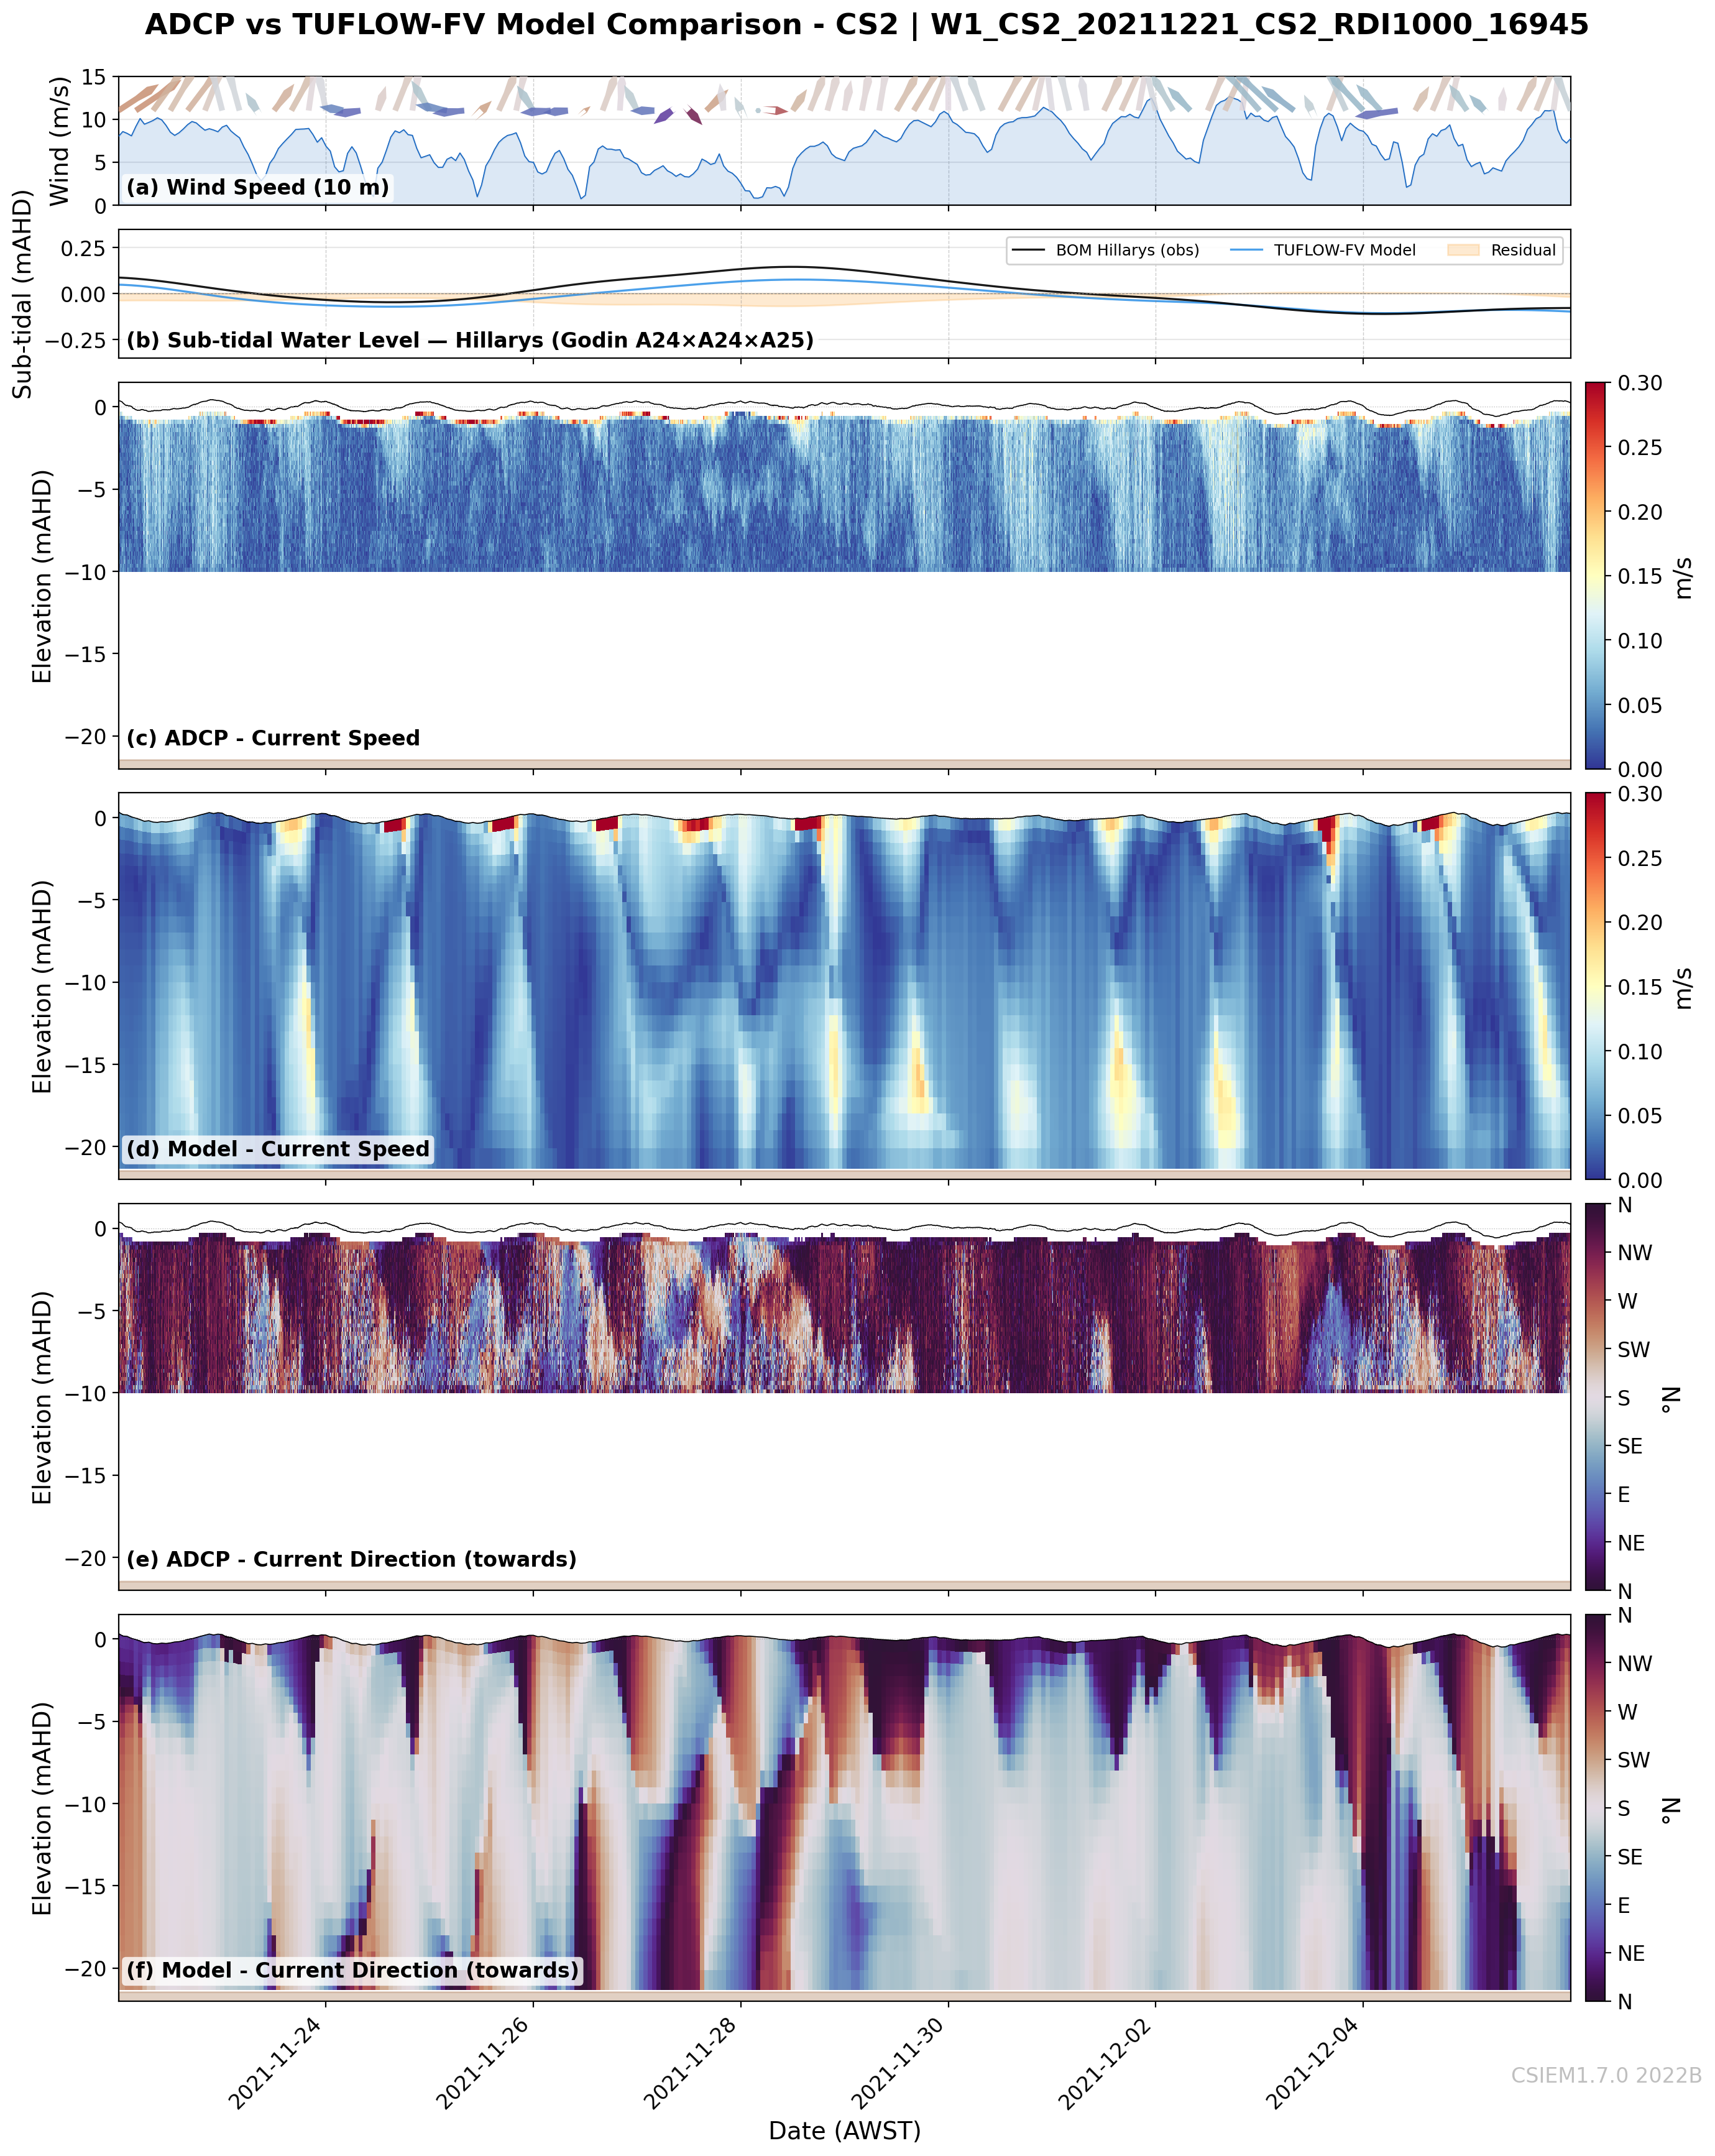
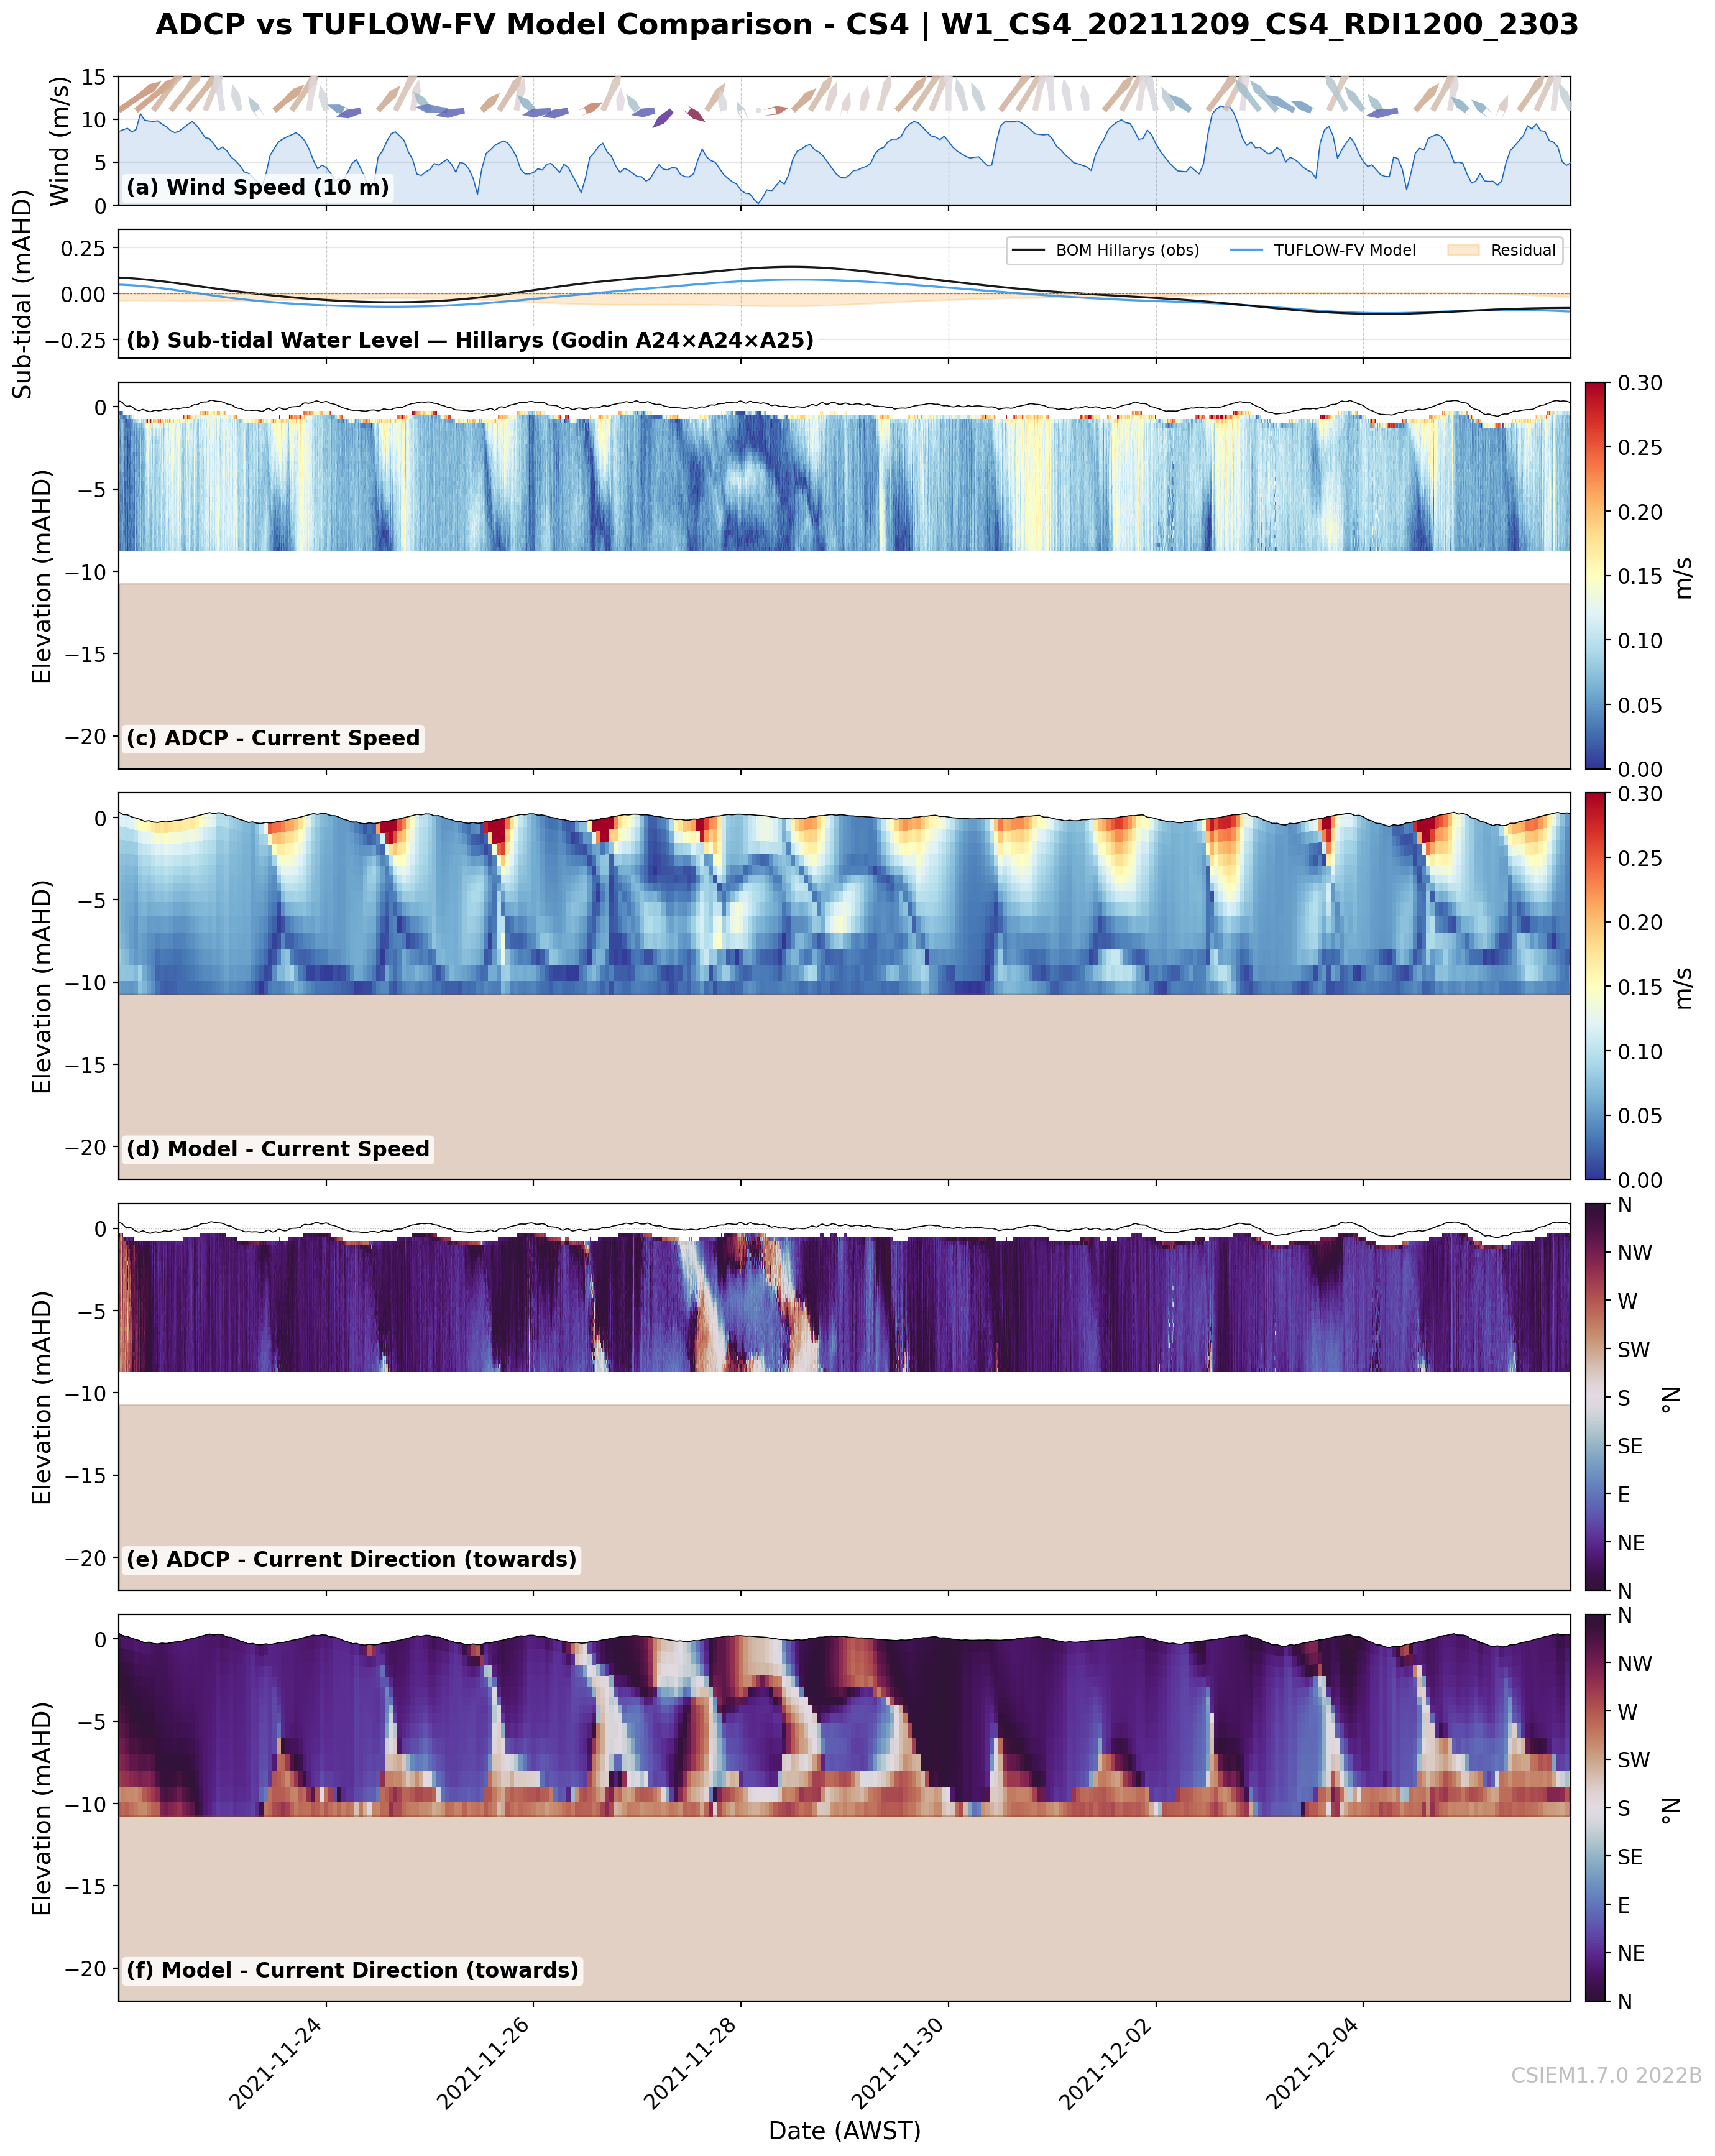
W1: Summer Sea-Breeze
Established diurnal sea-breeze pattern; S/SW winds dominate (69%), 8–12 m/s afternoons
Regular two-layer flow: wind-driven northward surface over southward bottom return
Model captures phasing and depth of velocity reversal with good fidelity
Purest sea-breeze forcing window of the campaign
Model notes: Good fidelity in diurnal reversal phasing and depth of velocity shear at all sites. Near-bottom observed speeds occasionally exceed model during strongest sea-breeze events. CS3 shows persistent directional offset in lower water column. CS6 (Owen Anchorage) observed directional variability broader than modelled — local reef/coastal geometry effects not fully resolved by mesh.
CS6 (11m) — Owen Anchorage
CS1 not available
CS5 (11m) — Shelf (north)
CS2 (20m) — Basin (mid-west)
CS4 (11m) — Shelf (south)
CS7 not available
CS3 (20m) — Basin (south)
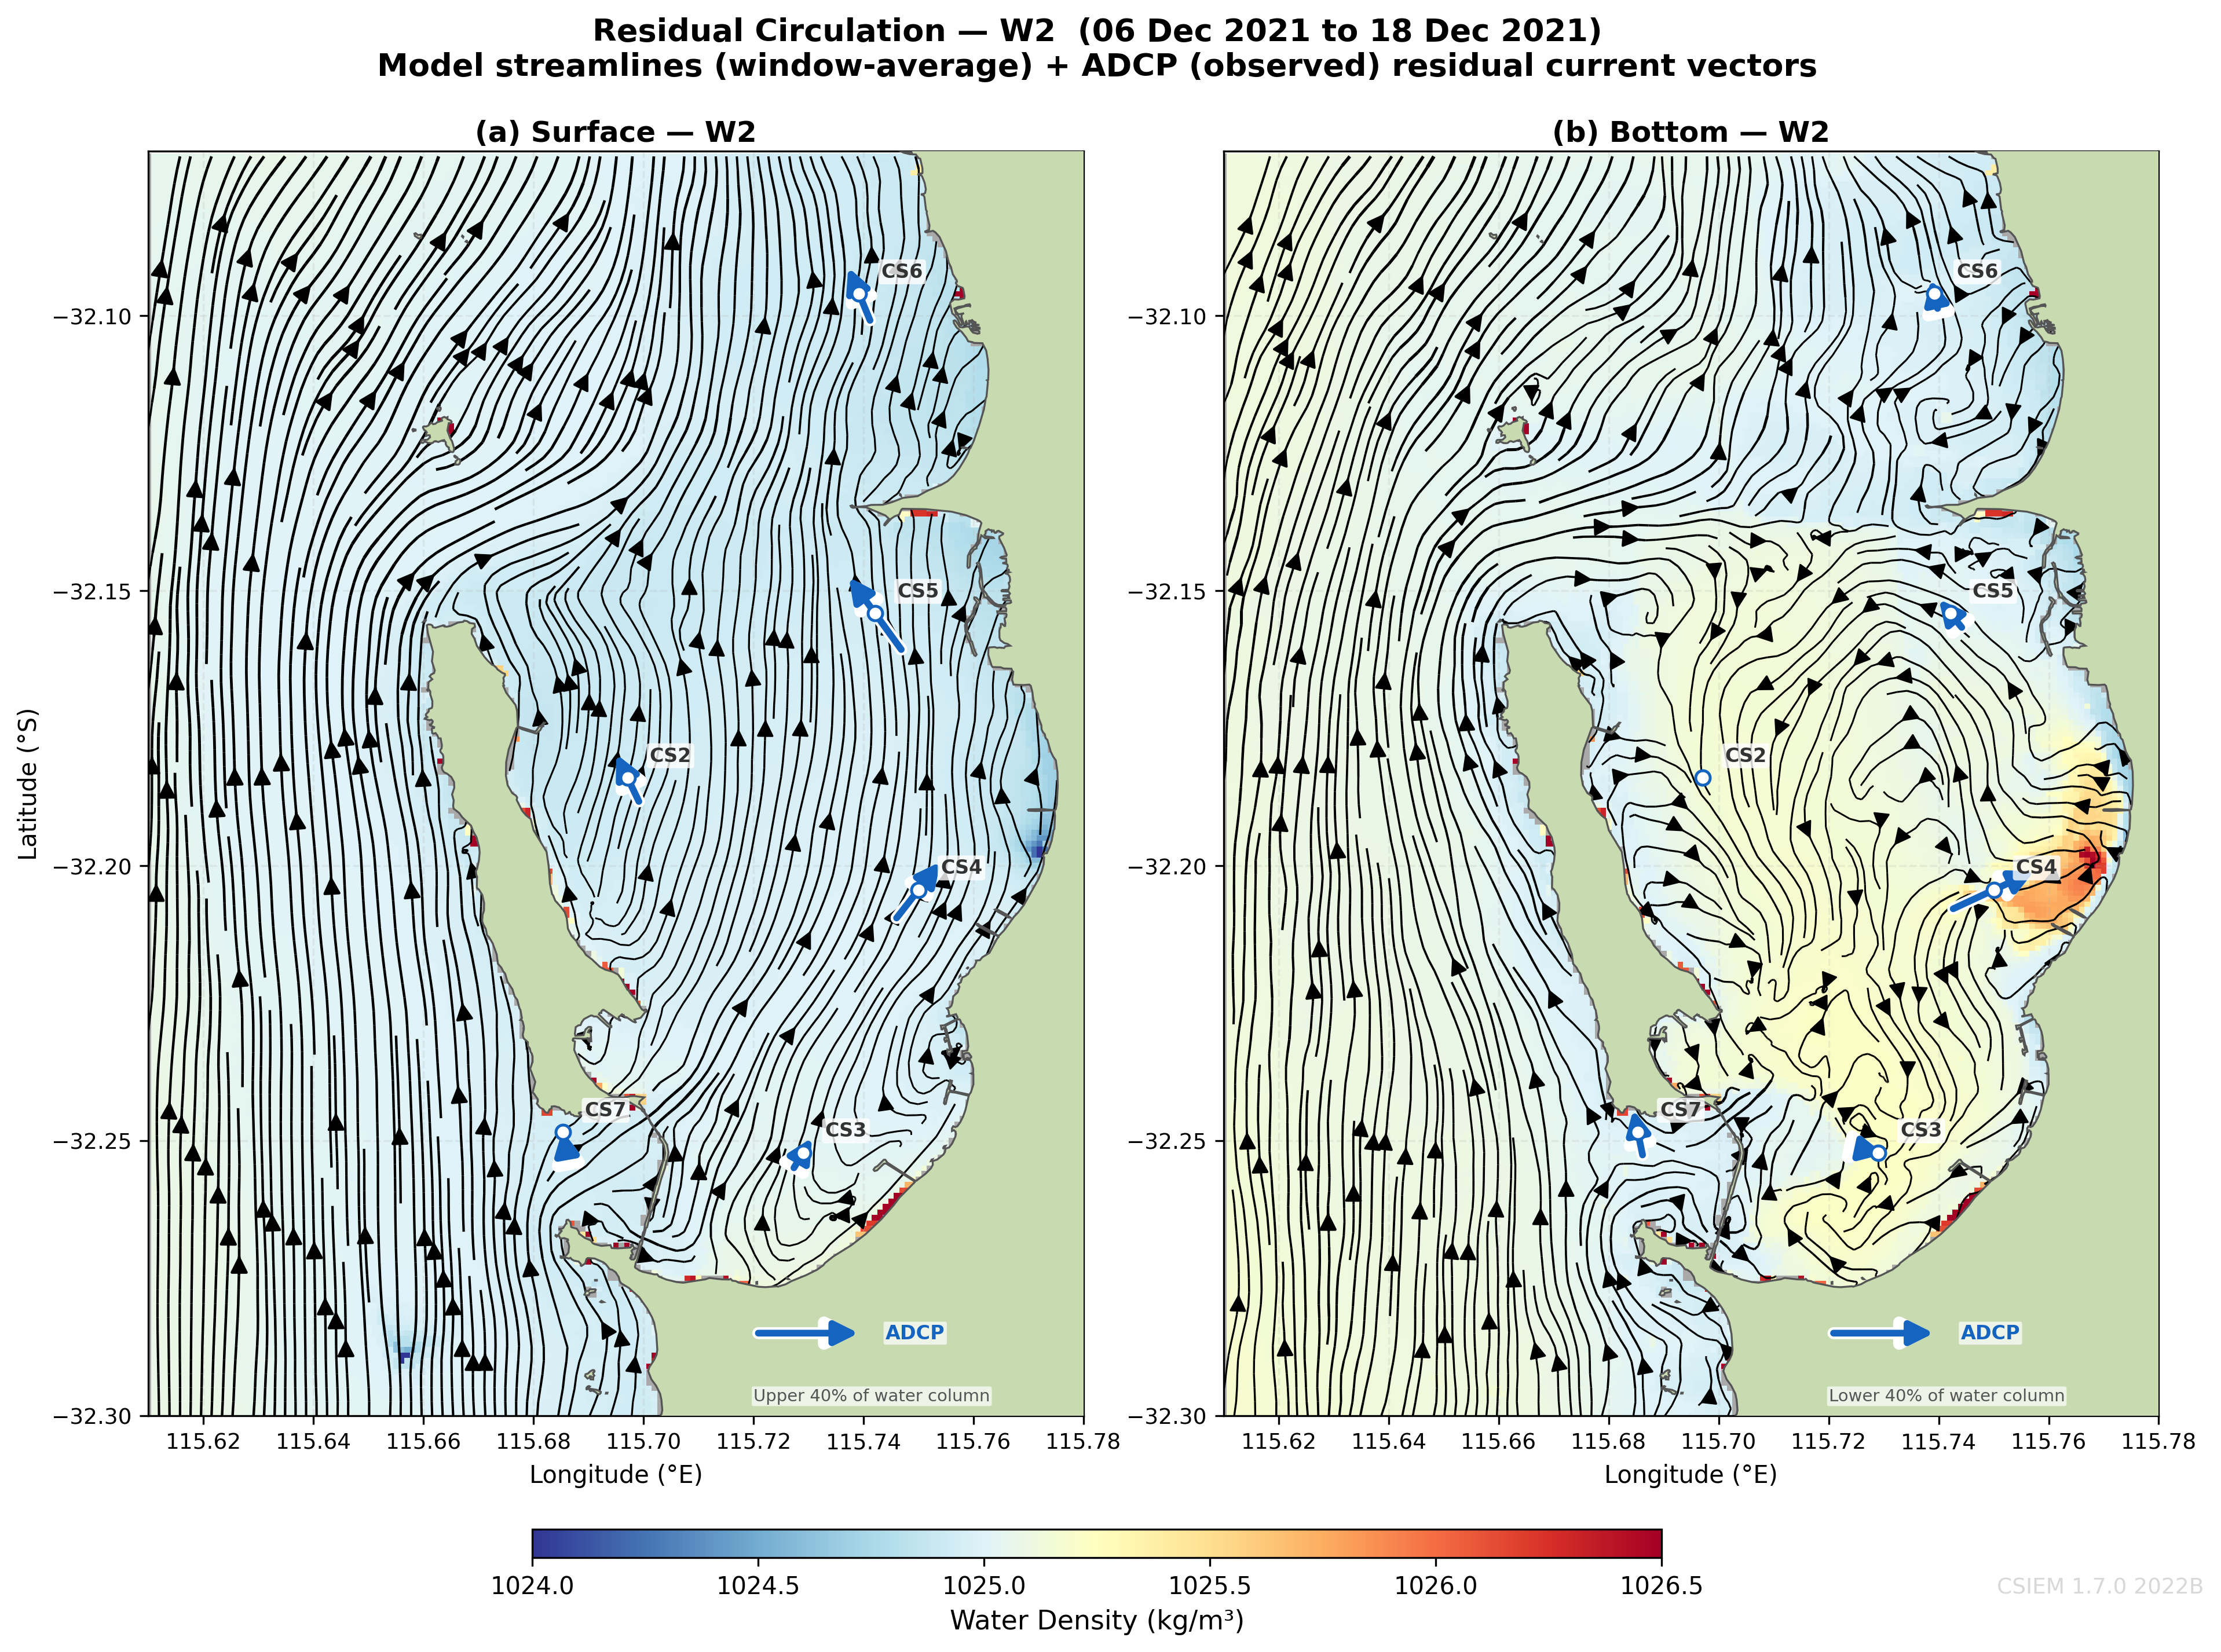
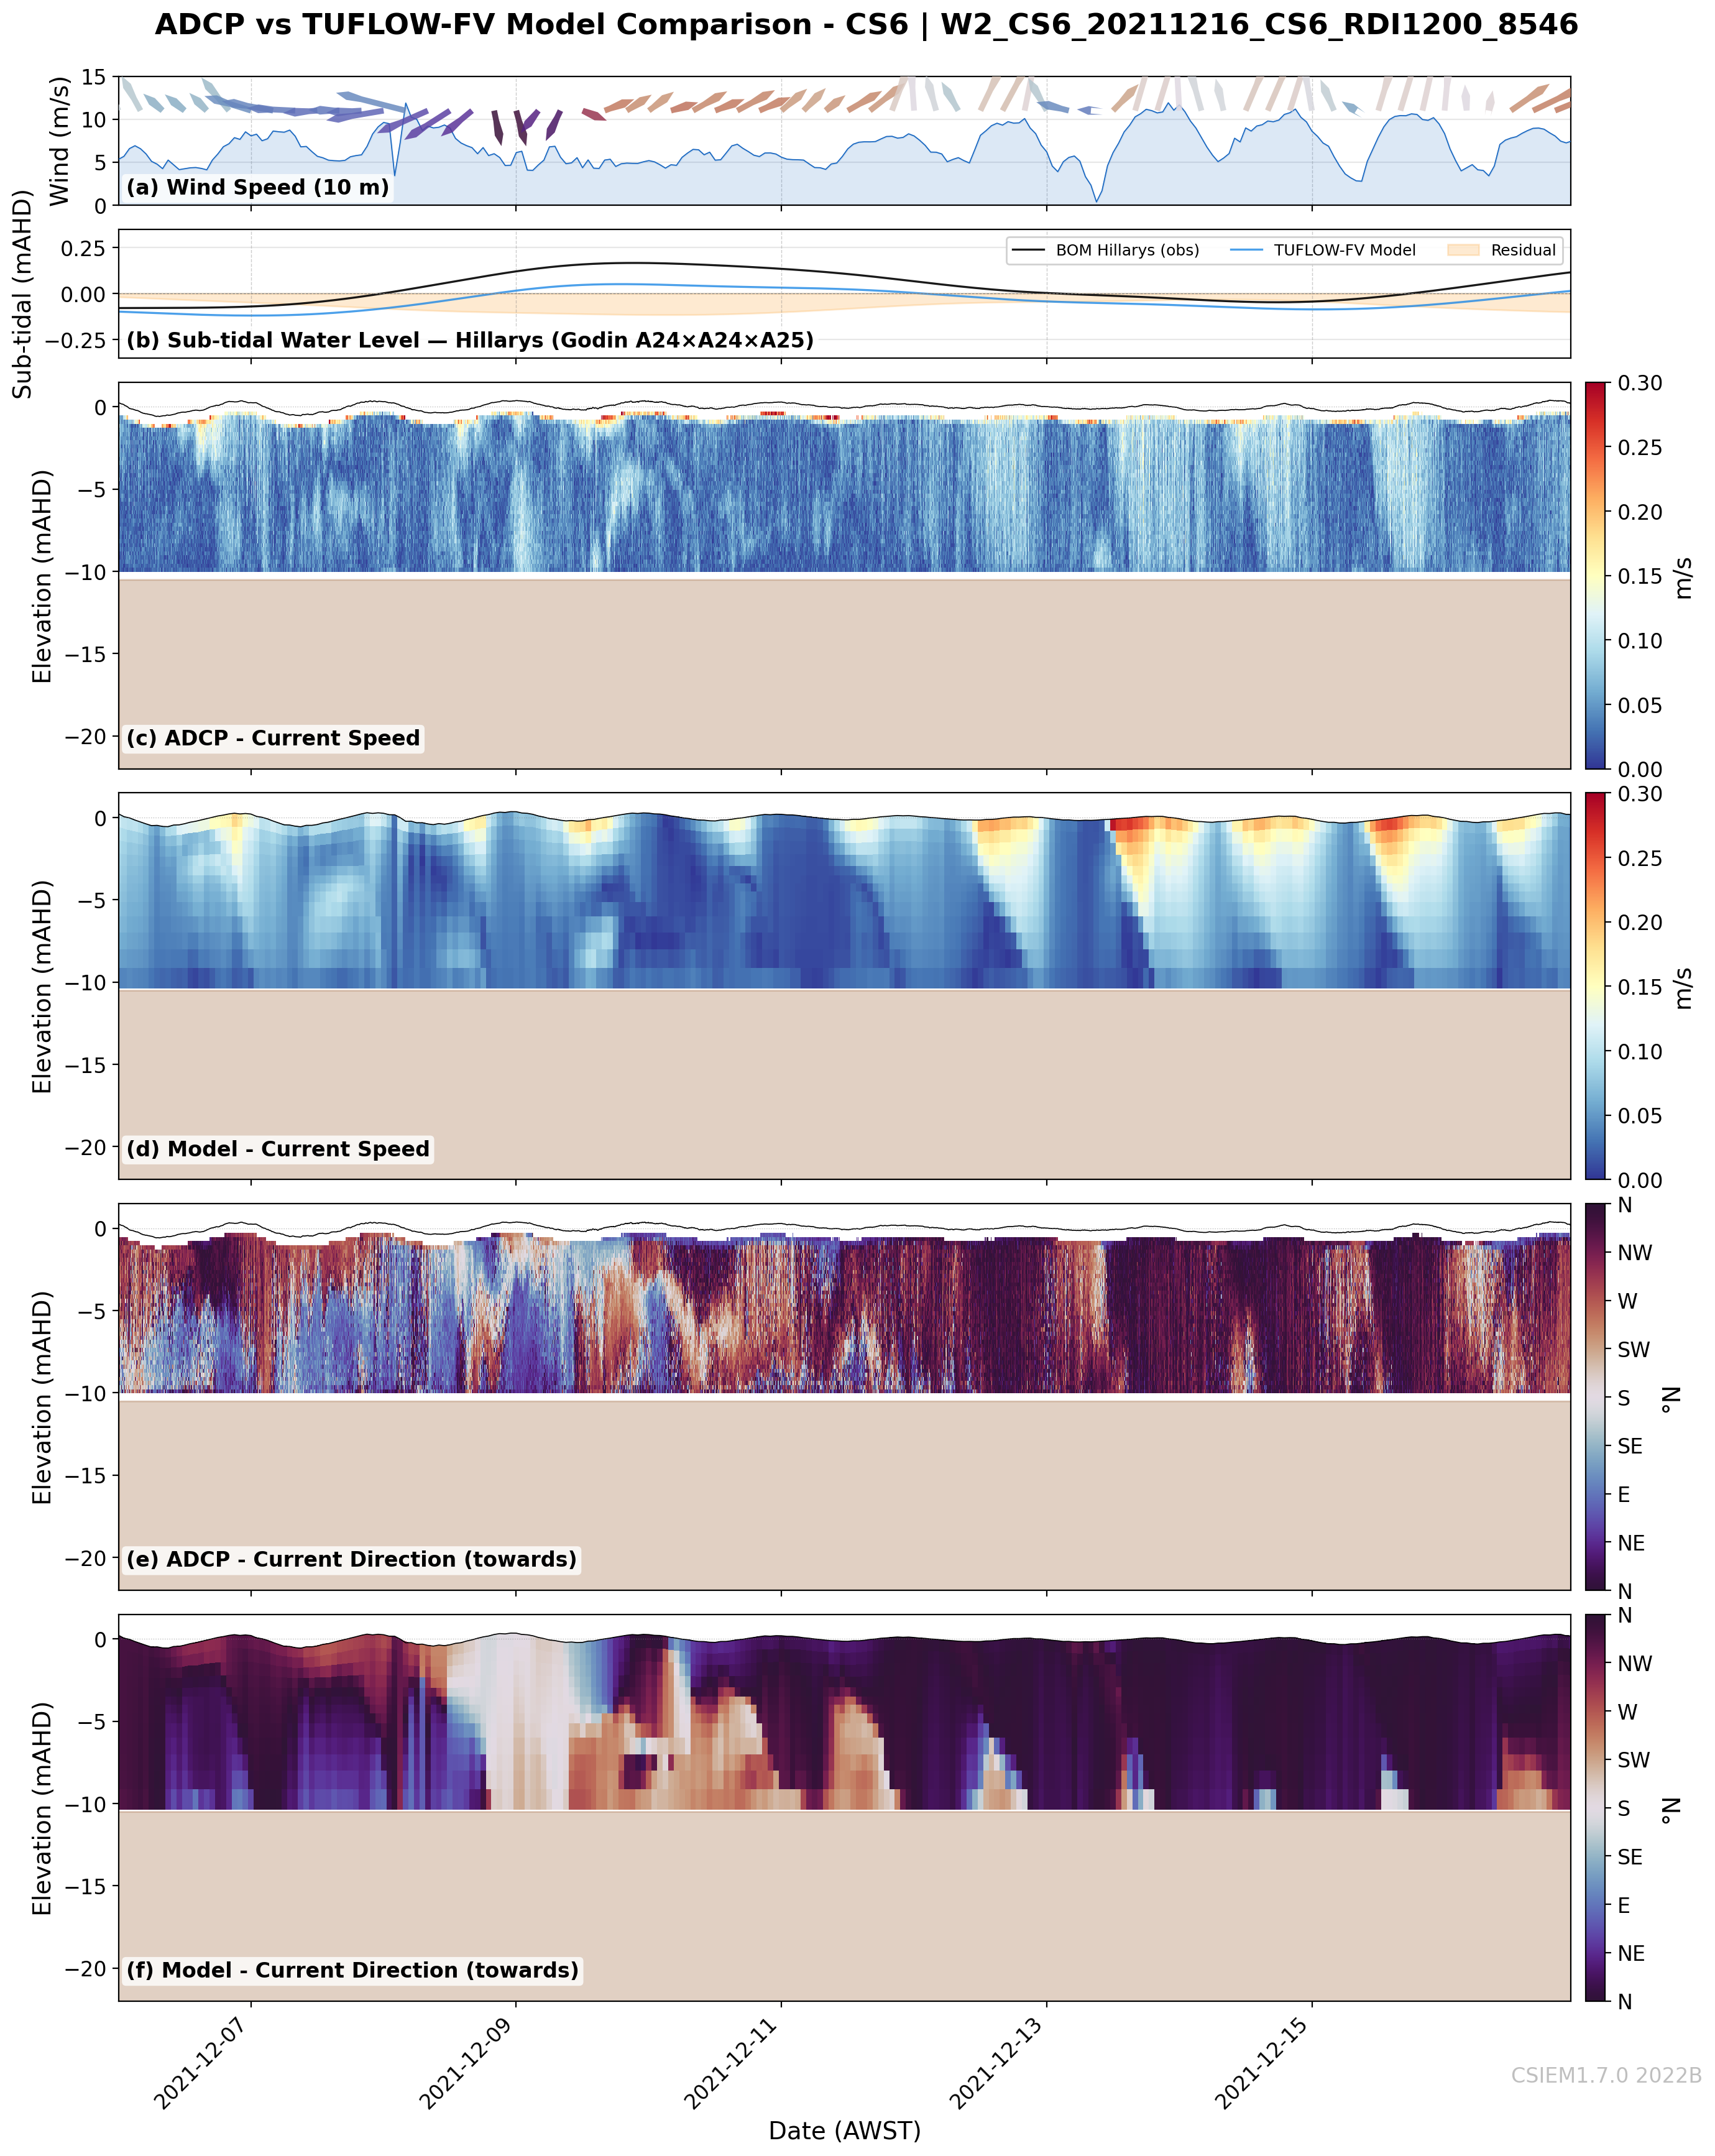
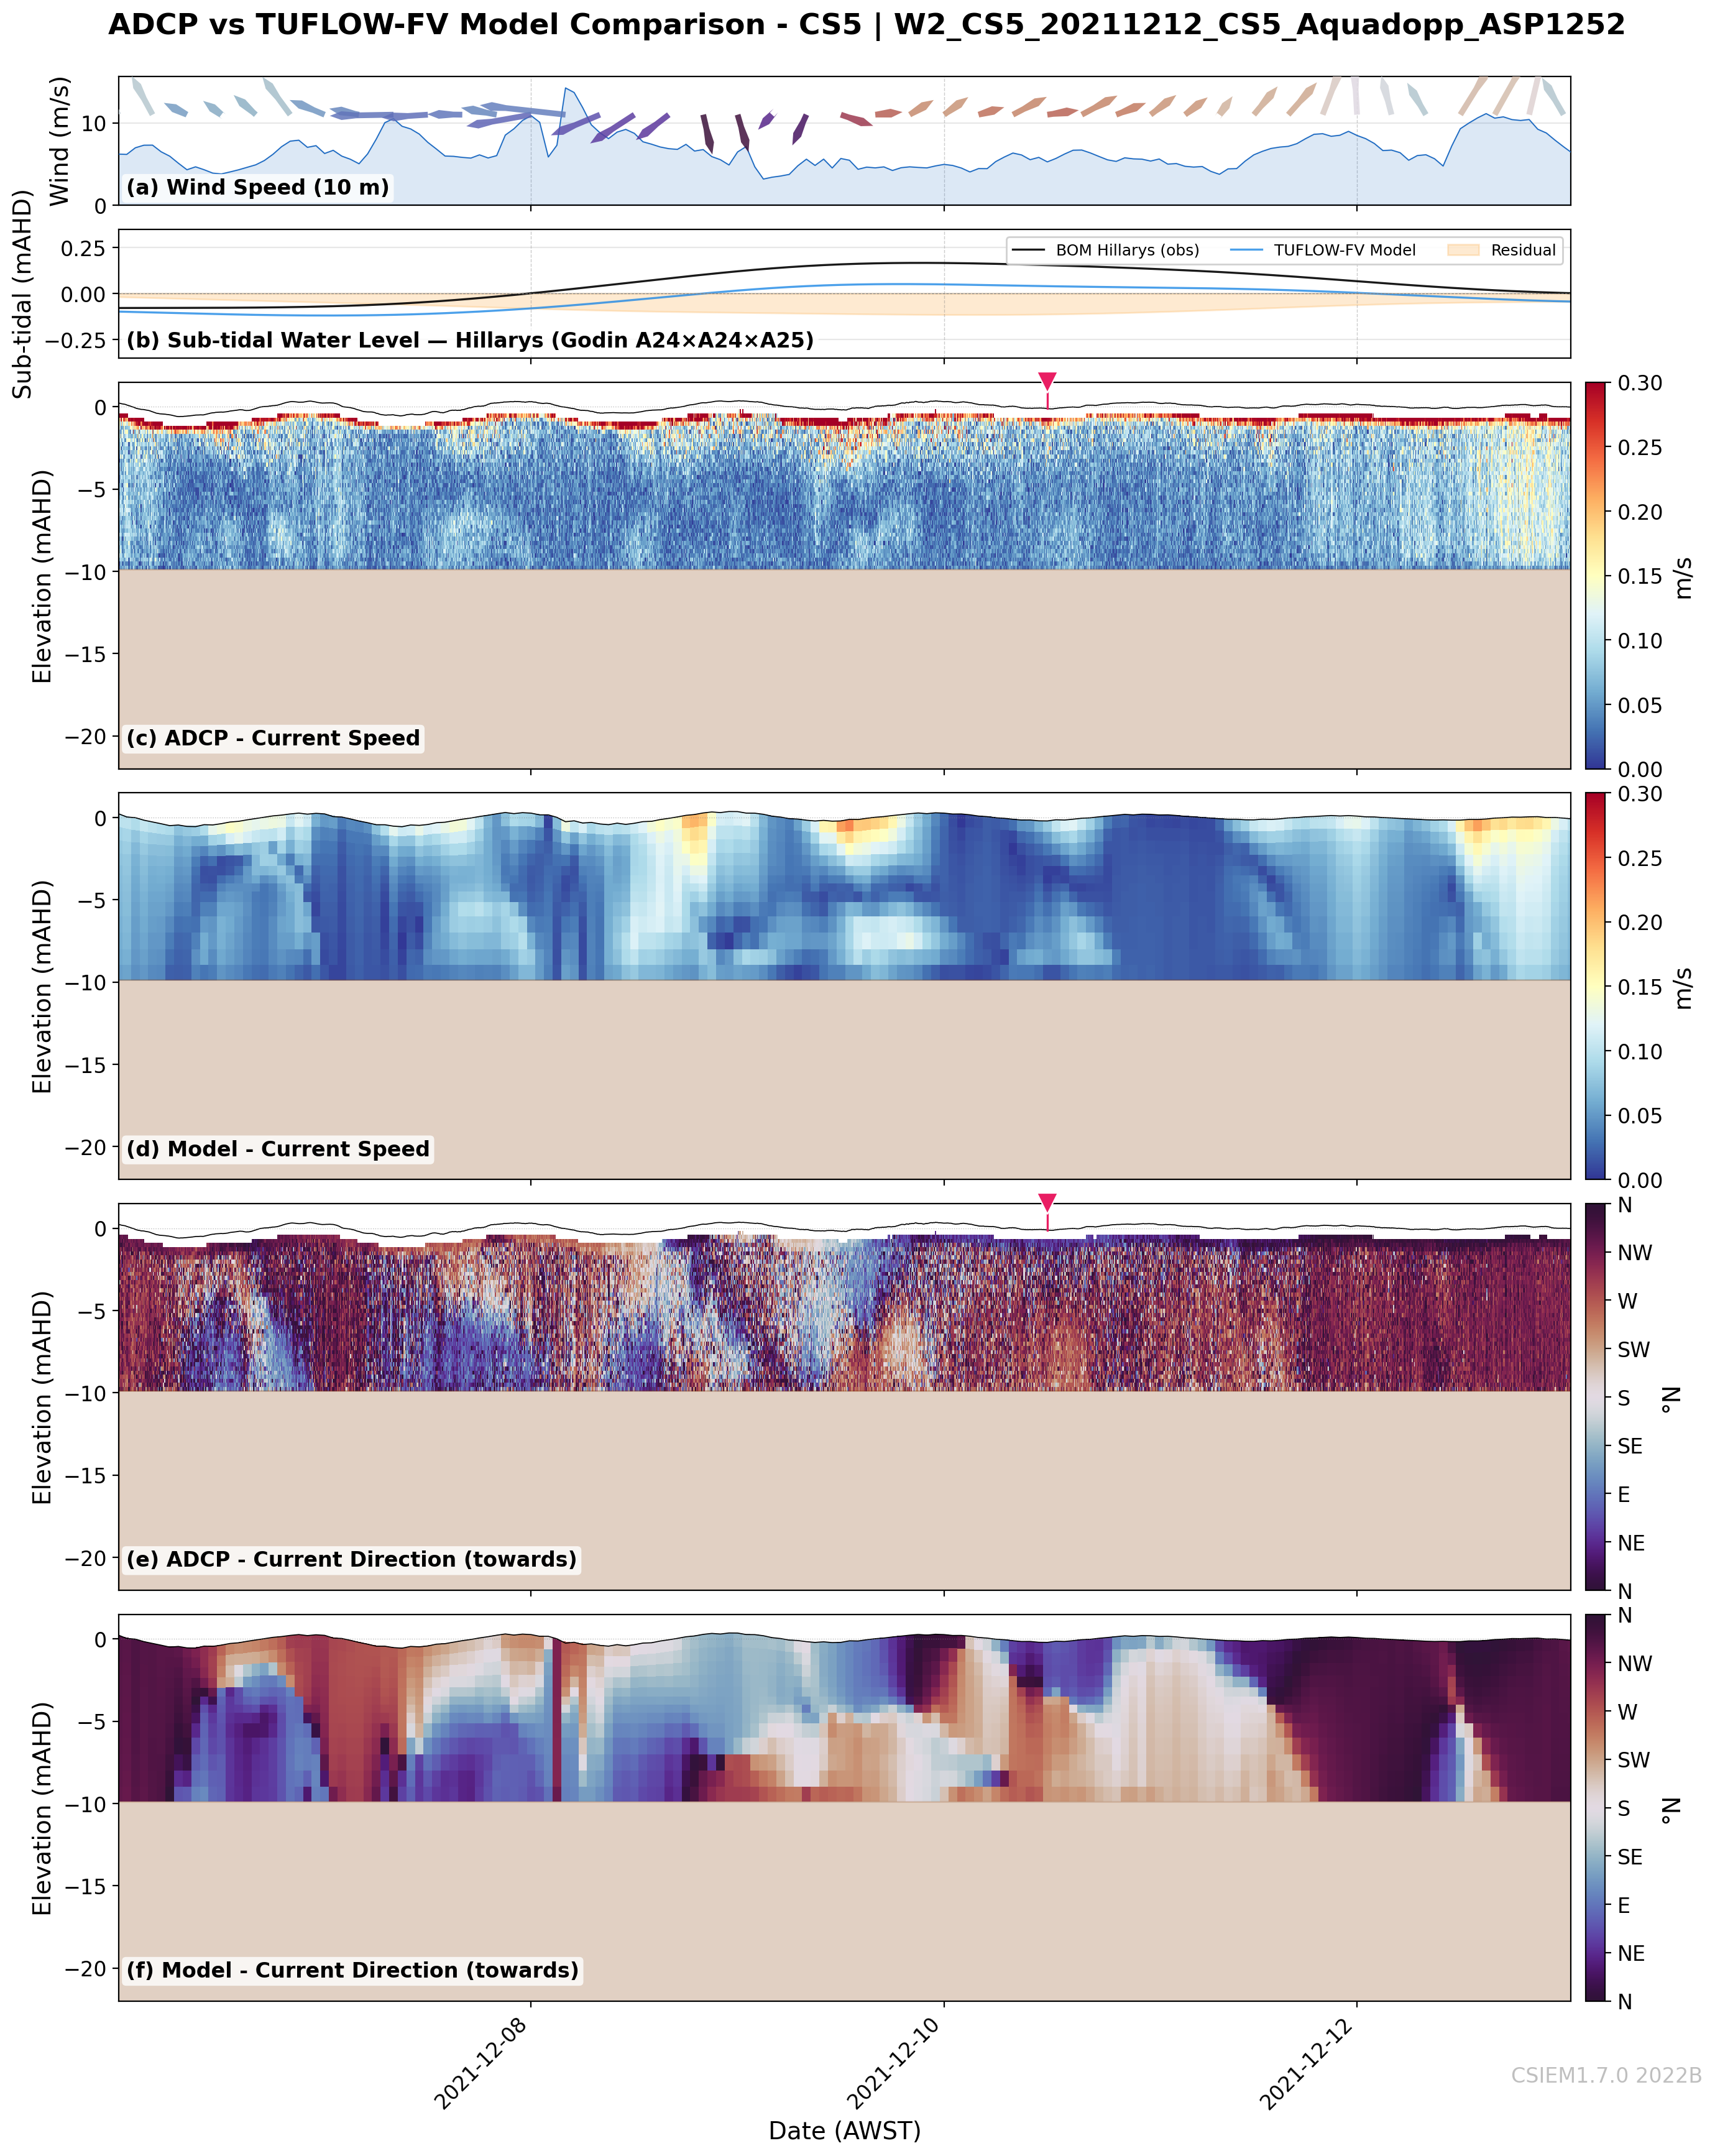
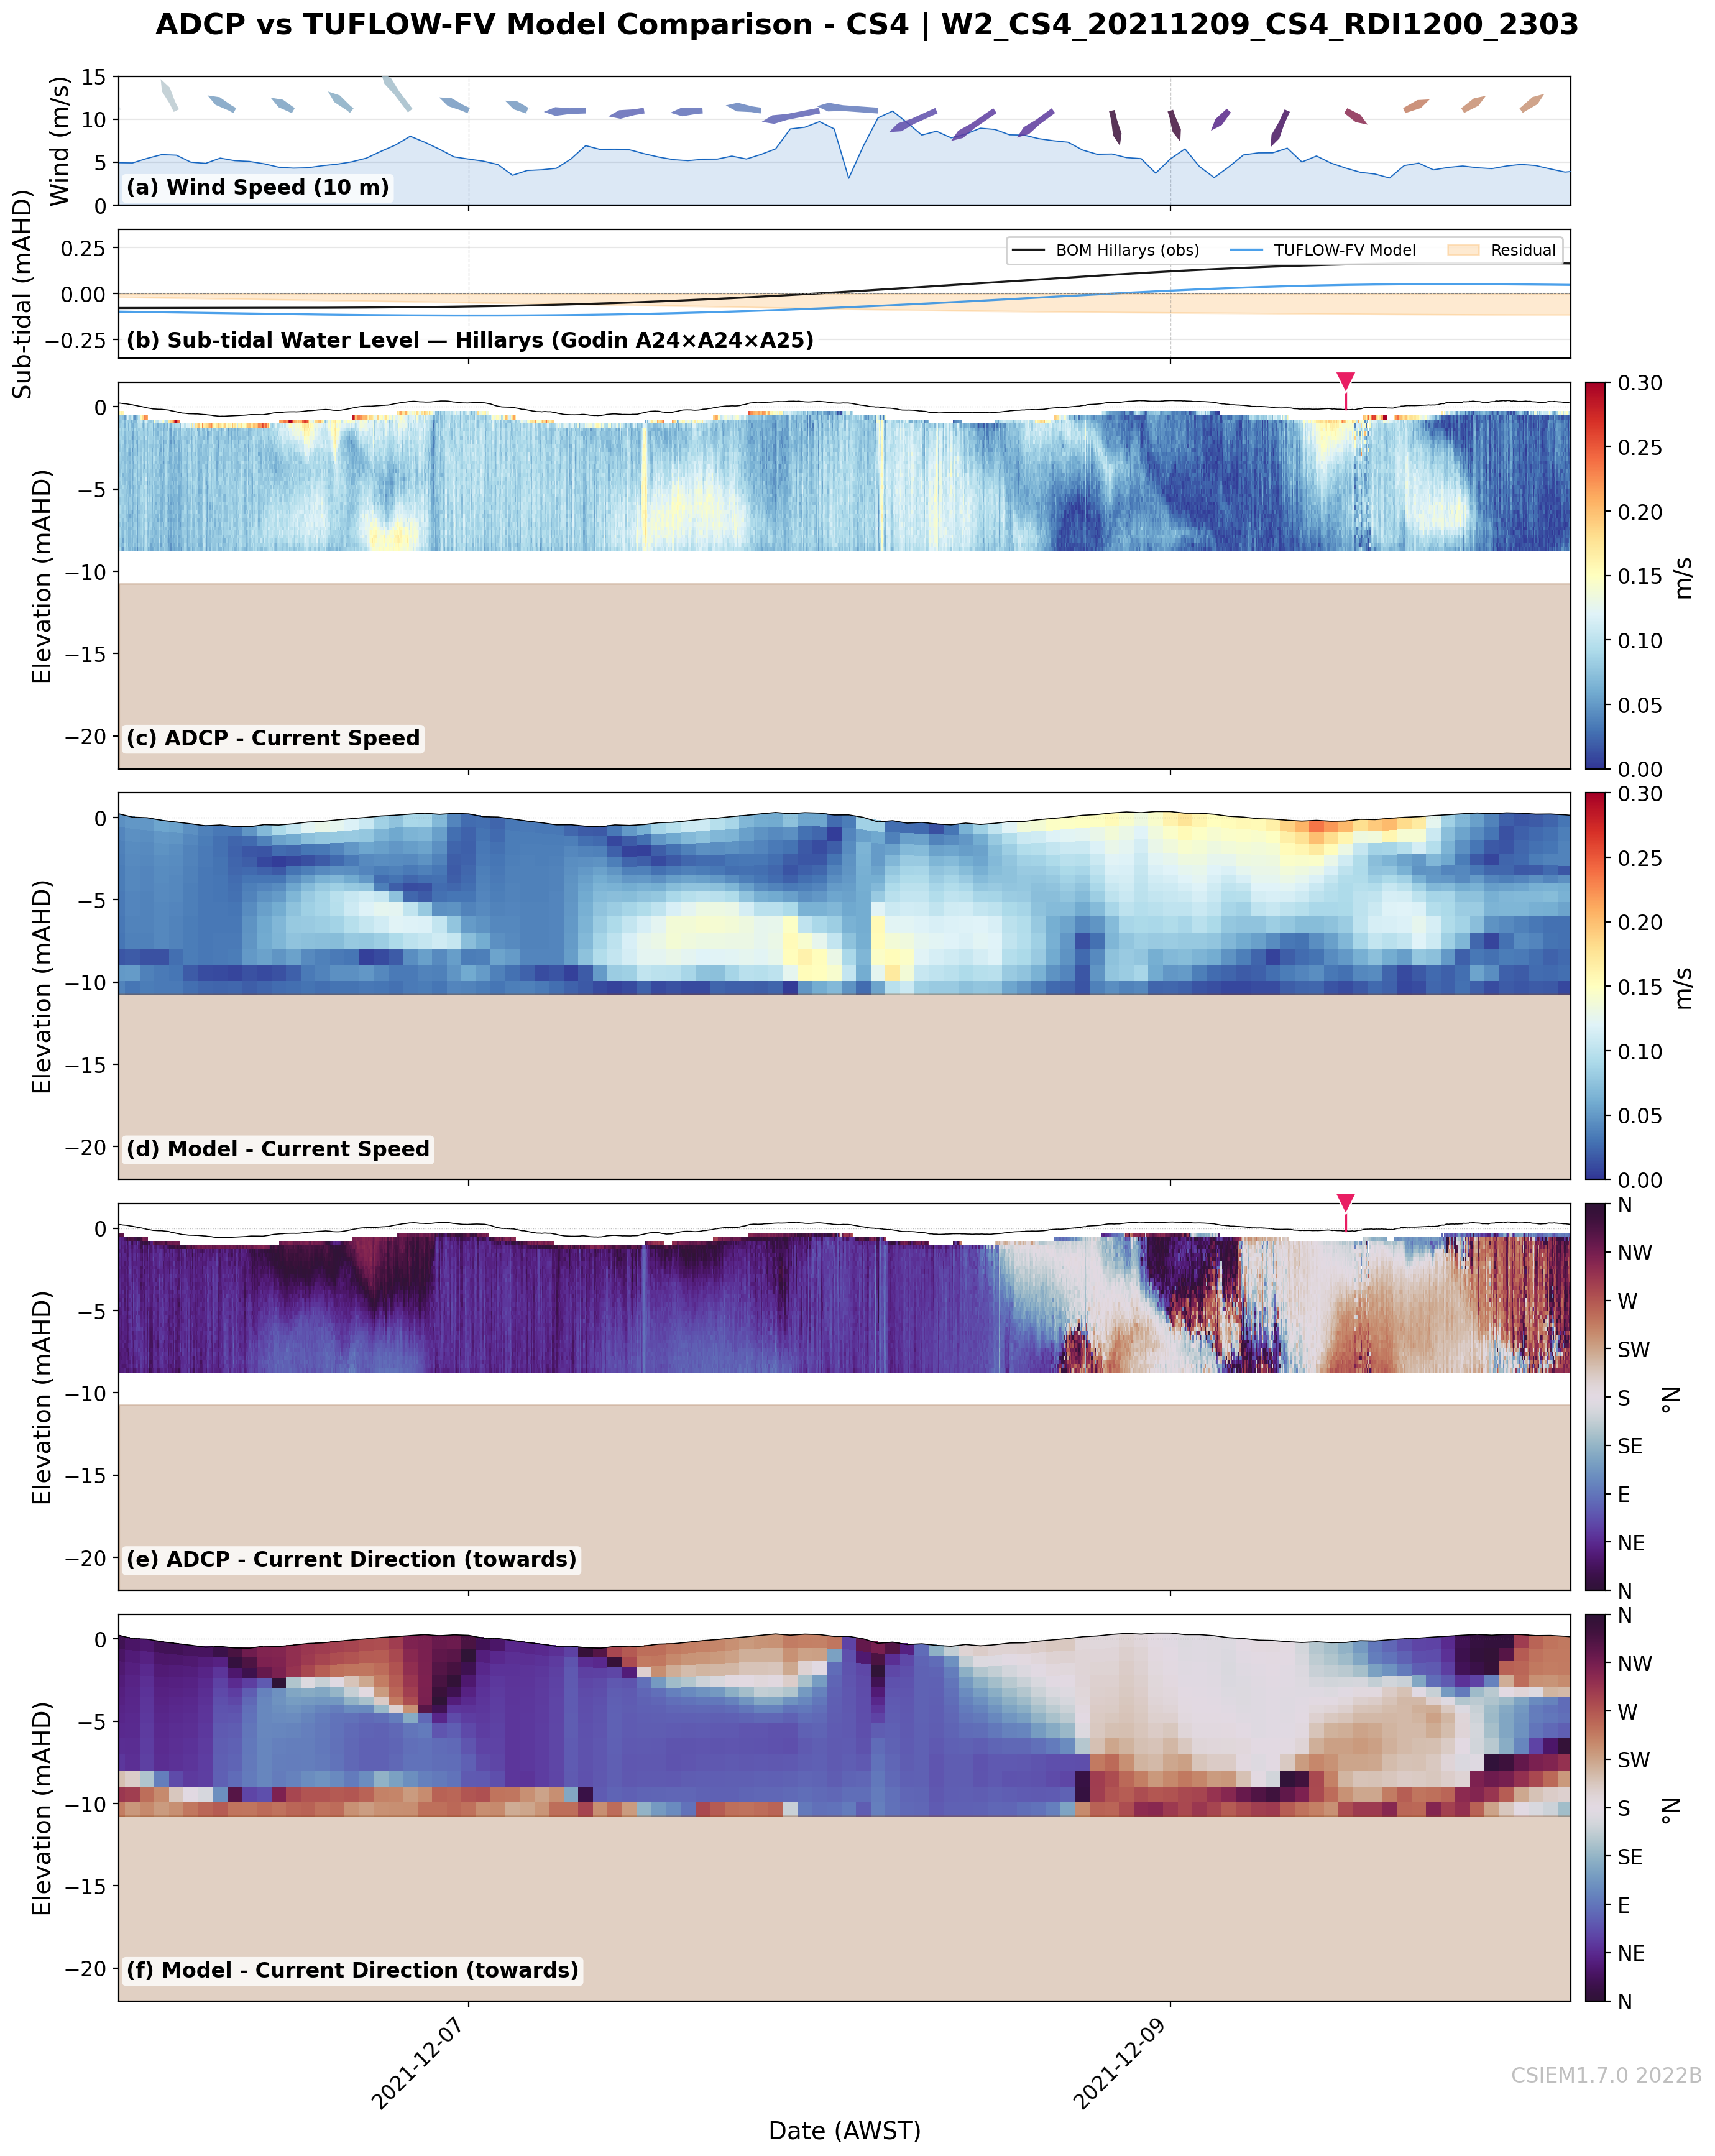
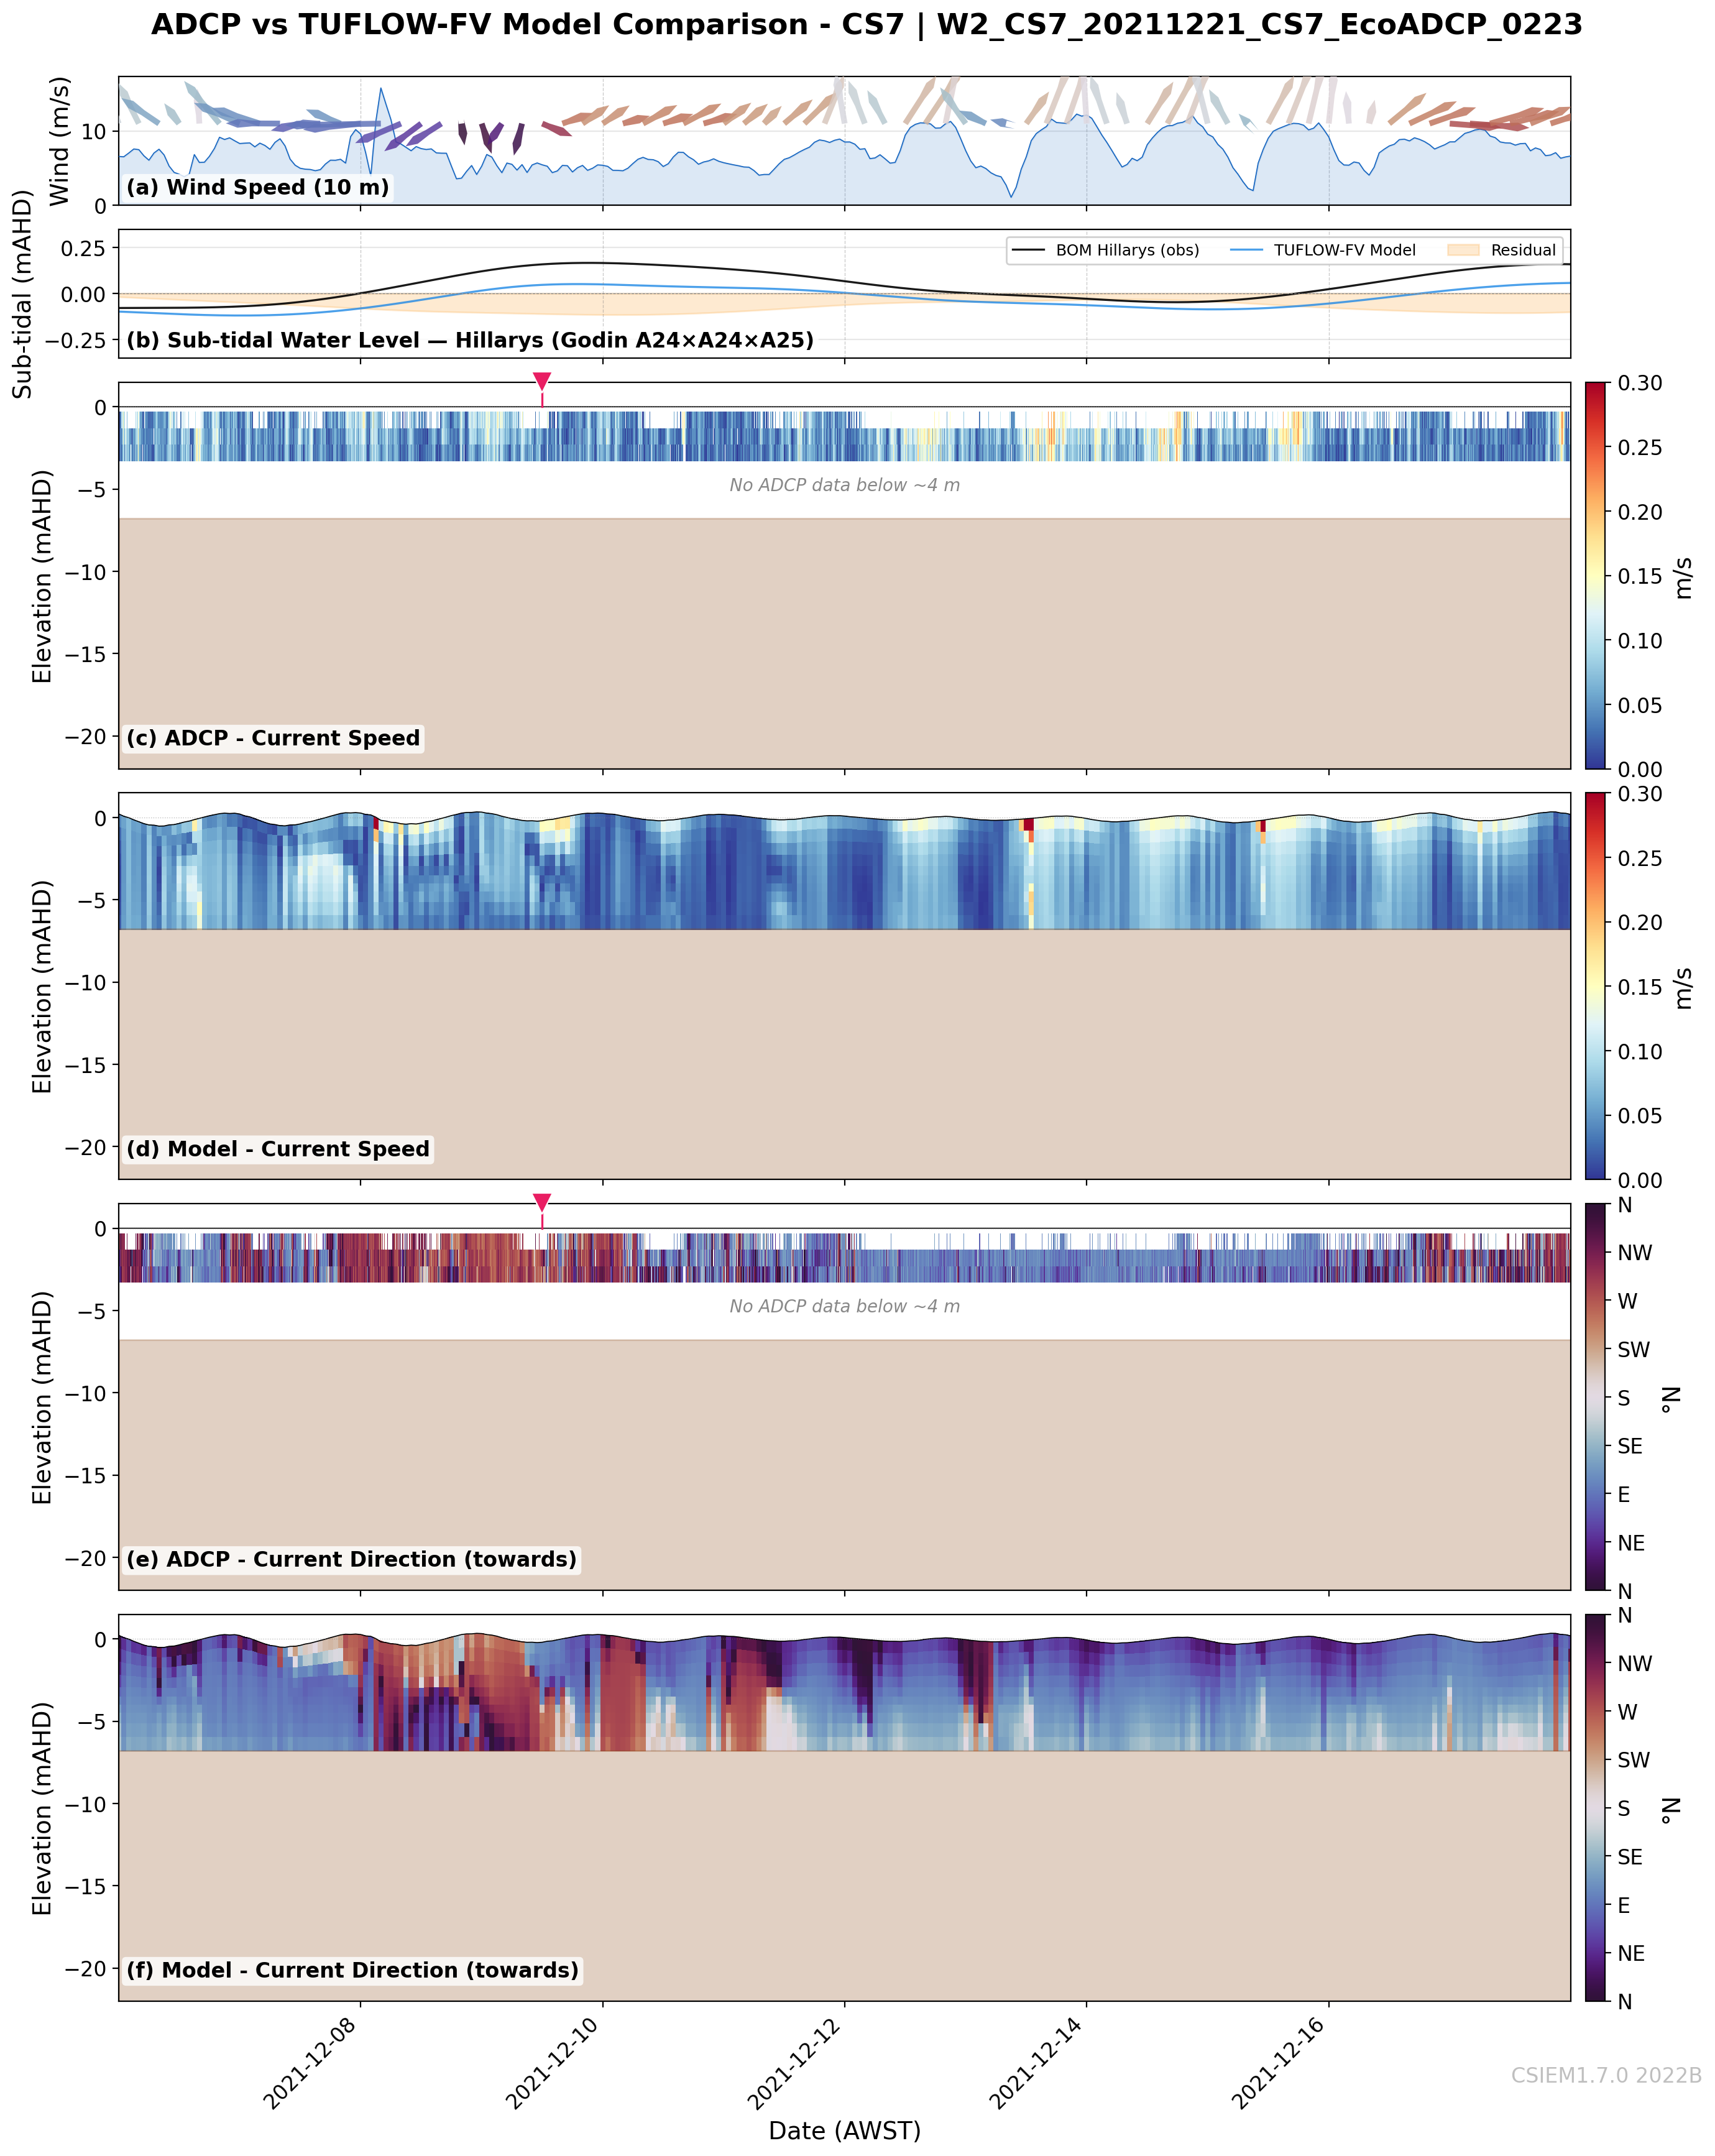
W2: Northerly then Sea-Breeze
S/SW dominates (52%) with single 26-hour northerly event (~9 Dec)
CS7 (Causeway) site comes online — strong tidal signal through the constriction
Diurnal current reversals continue; model maintains good speed and reversal agreement
Broadens validation to include Garden Island Causeway exchange
Model notes: CS7 (Causeway) tidal phasing well captured by model; +96° compass correction applied to EcoADCP aligns observed directions with model’s along-channel flow axis. CS3 directional offset persists, confirming systematic feature. CS4 and CS5 records end mid-window (instruments recovered ~10–13 Dec).
CS6 (11m) — Owen Anchorage
CS1 not available
CS5 (11m) — Shelf (north)
CS2 (20m) — Basin (mid-west)
CS4 (11m) — Shelf (south)
CS7 (6m) — Causeway
CS3 (20m) — Basin (south)
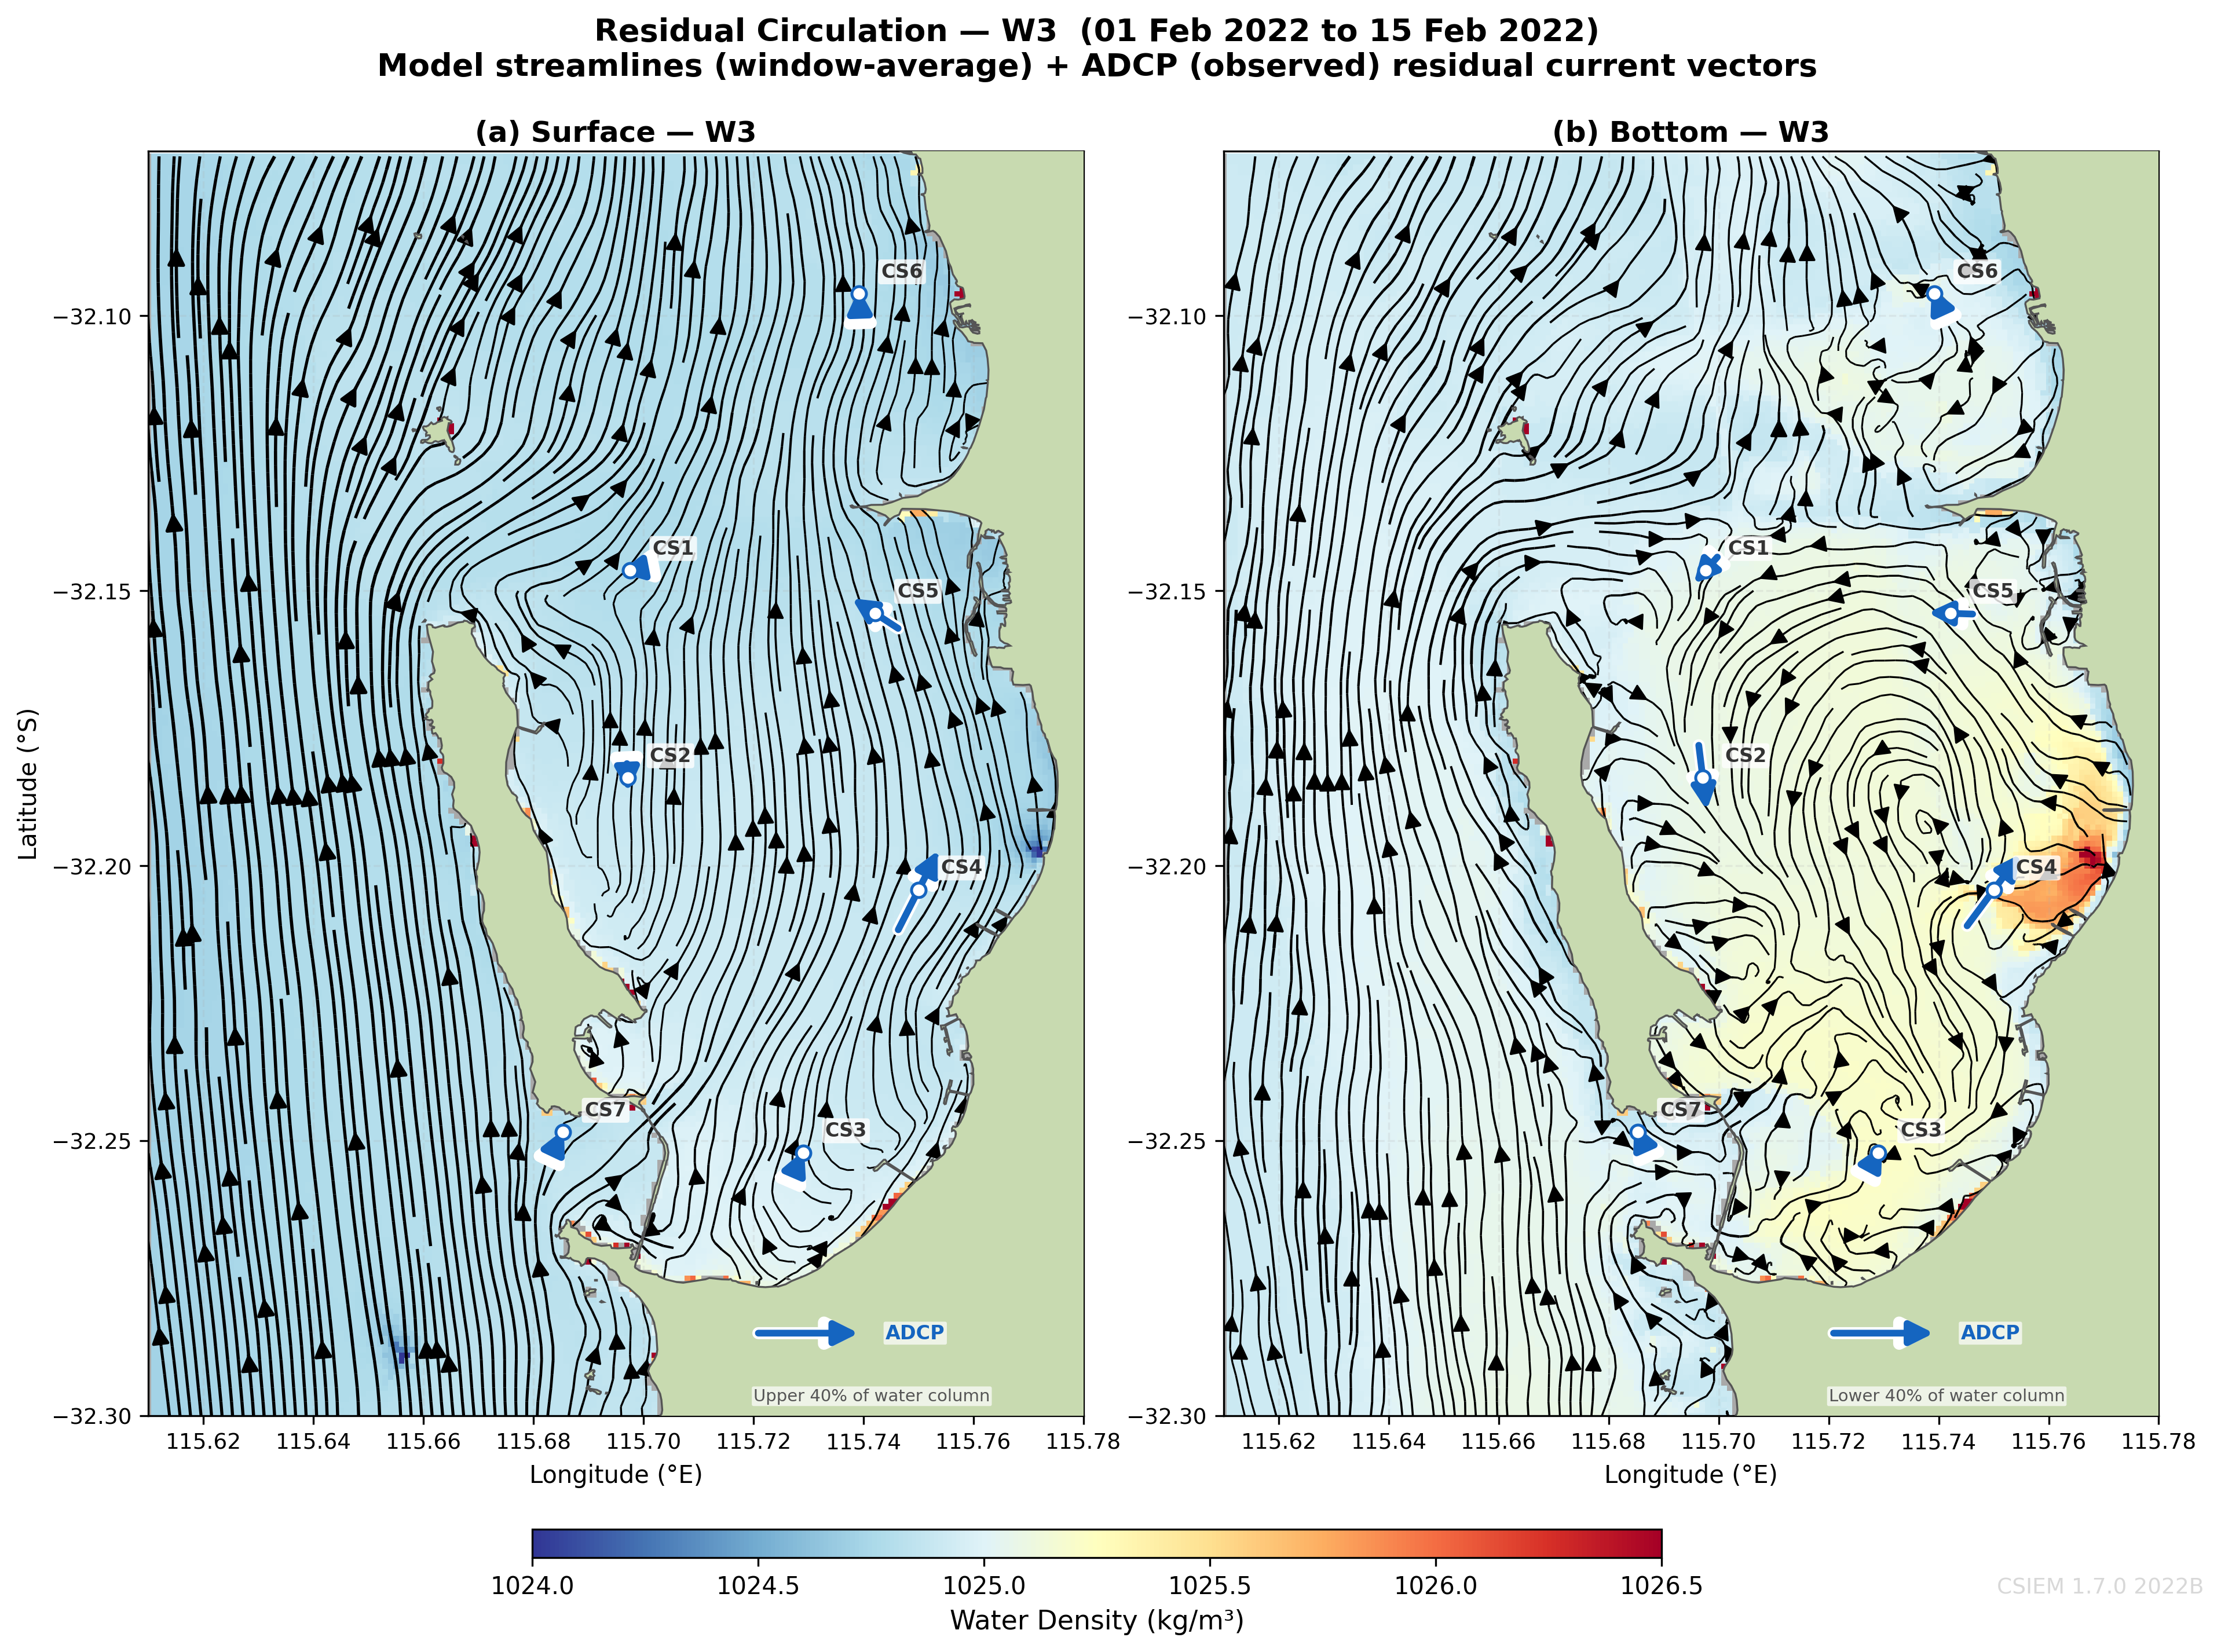
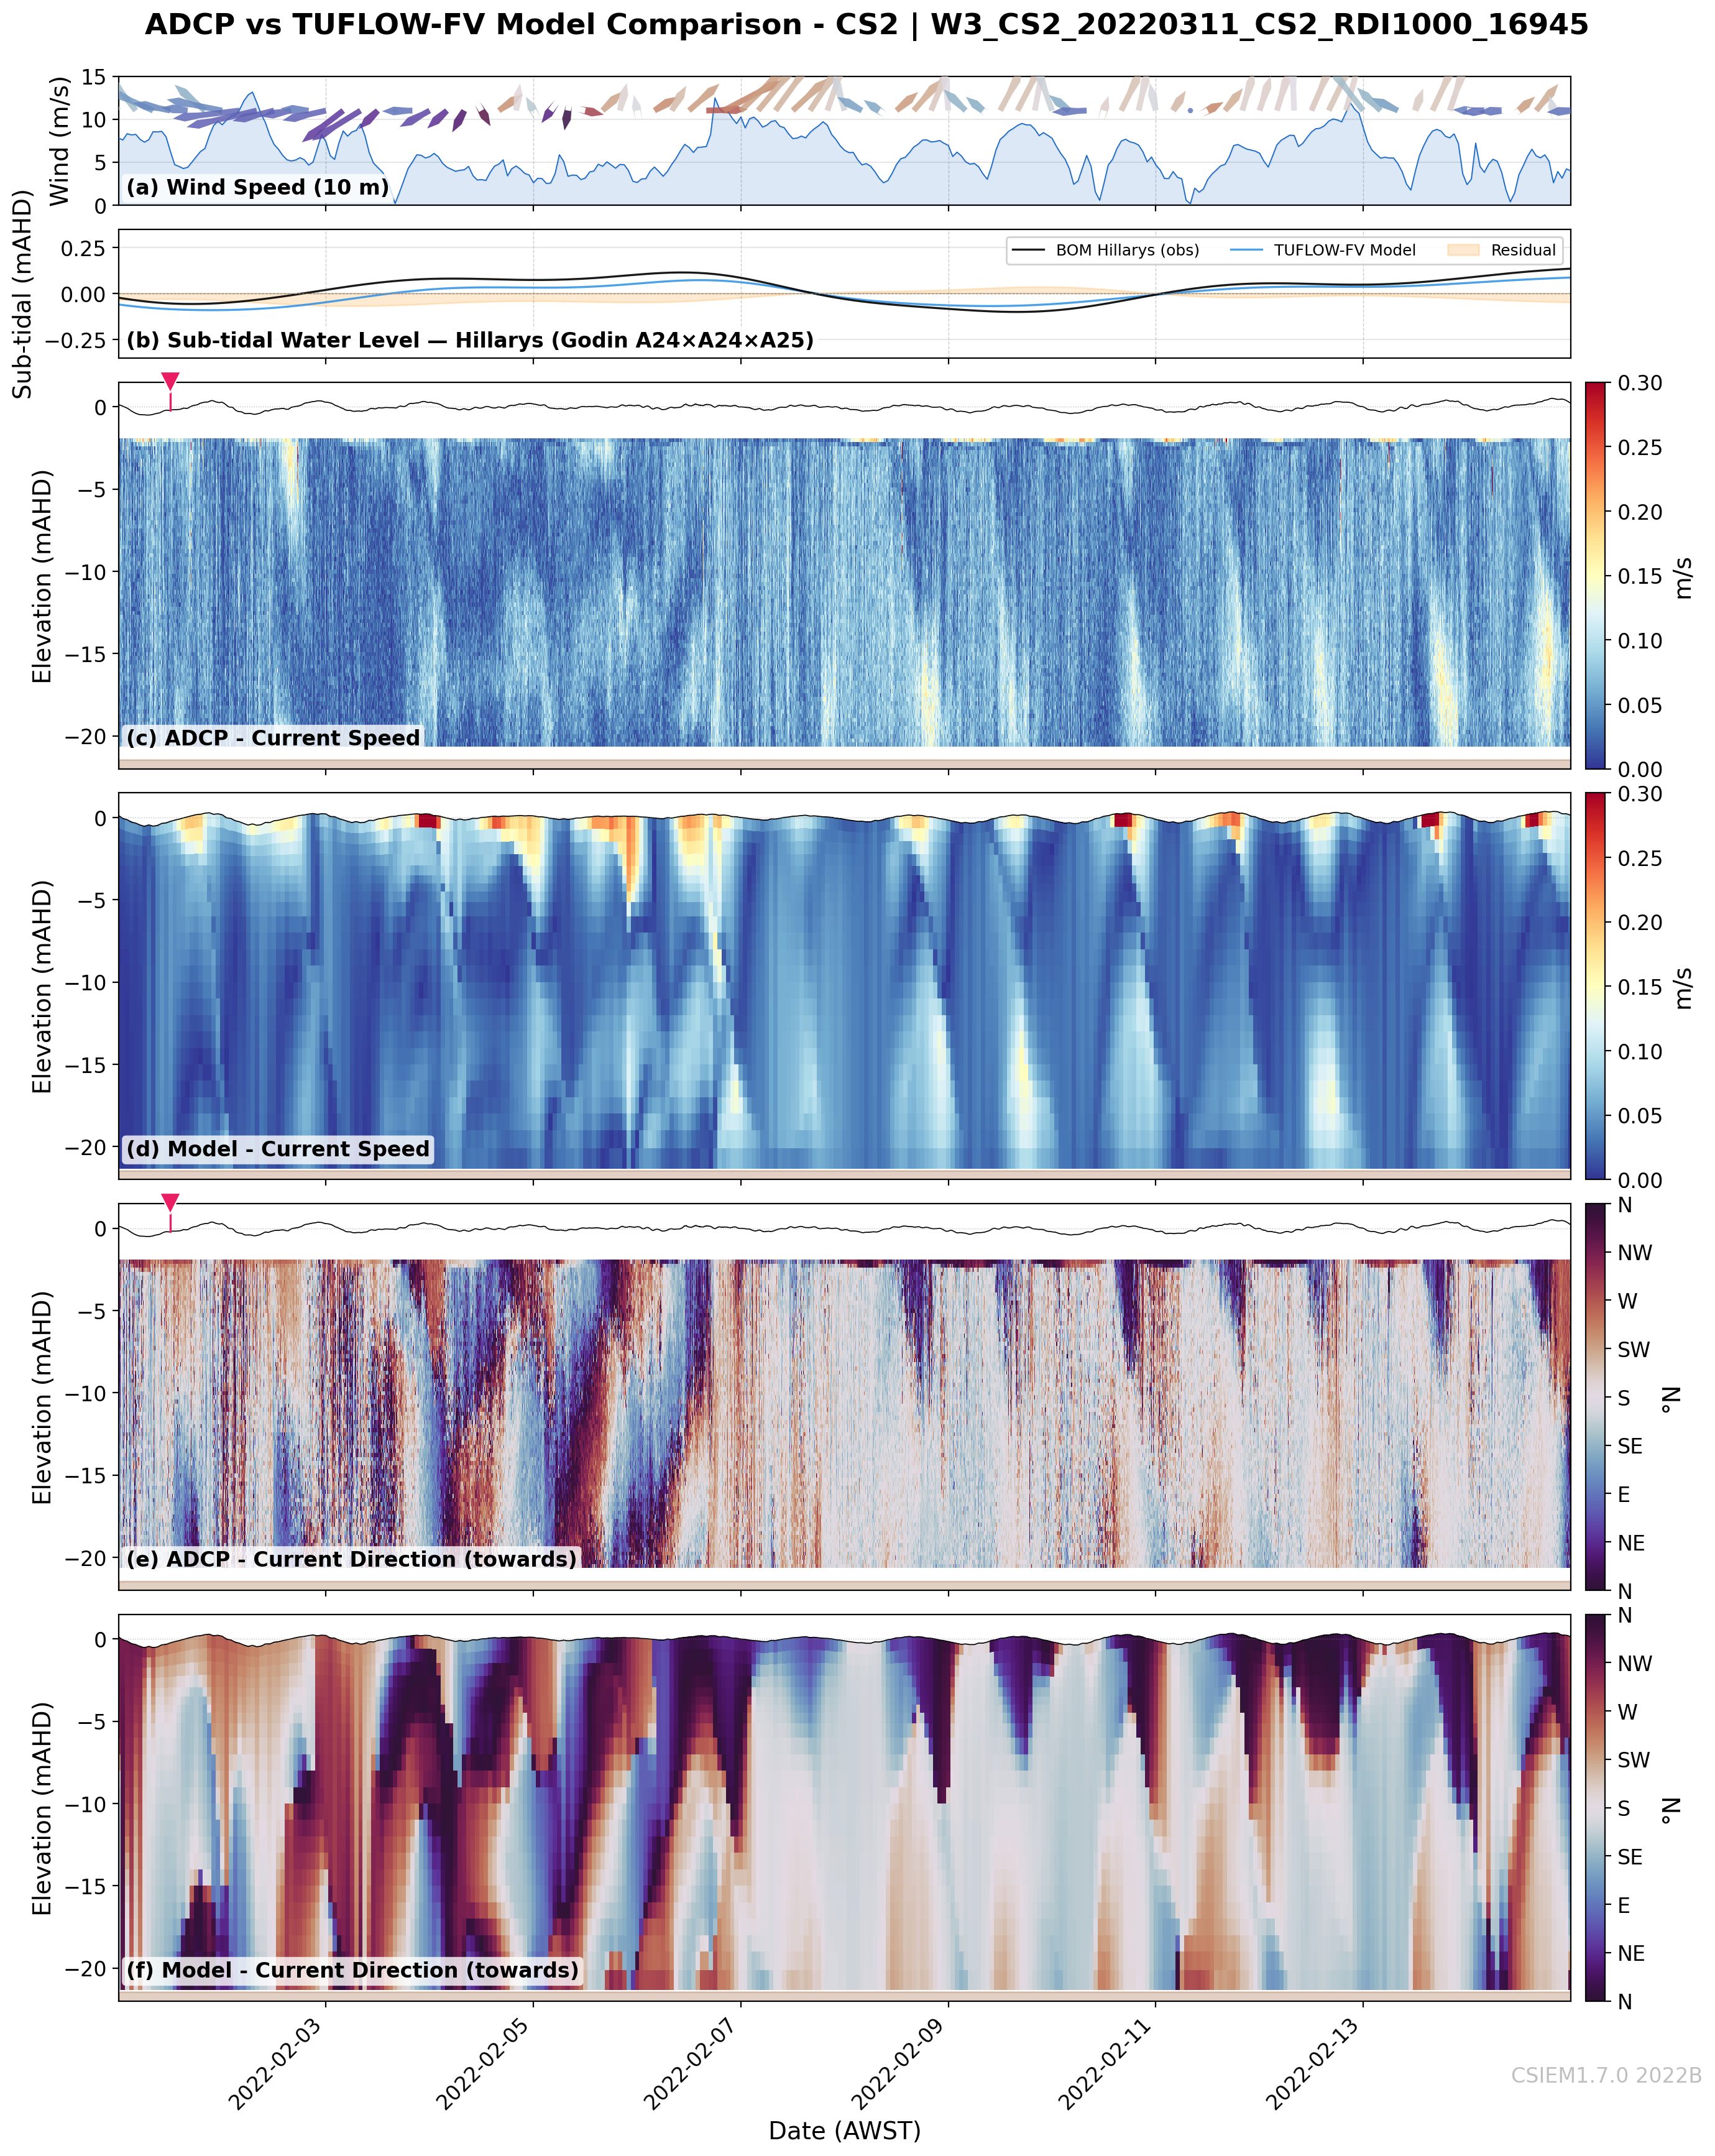
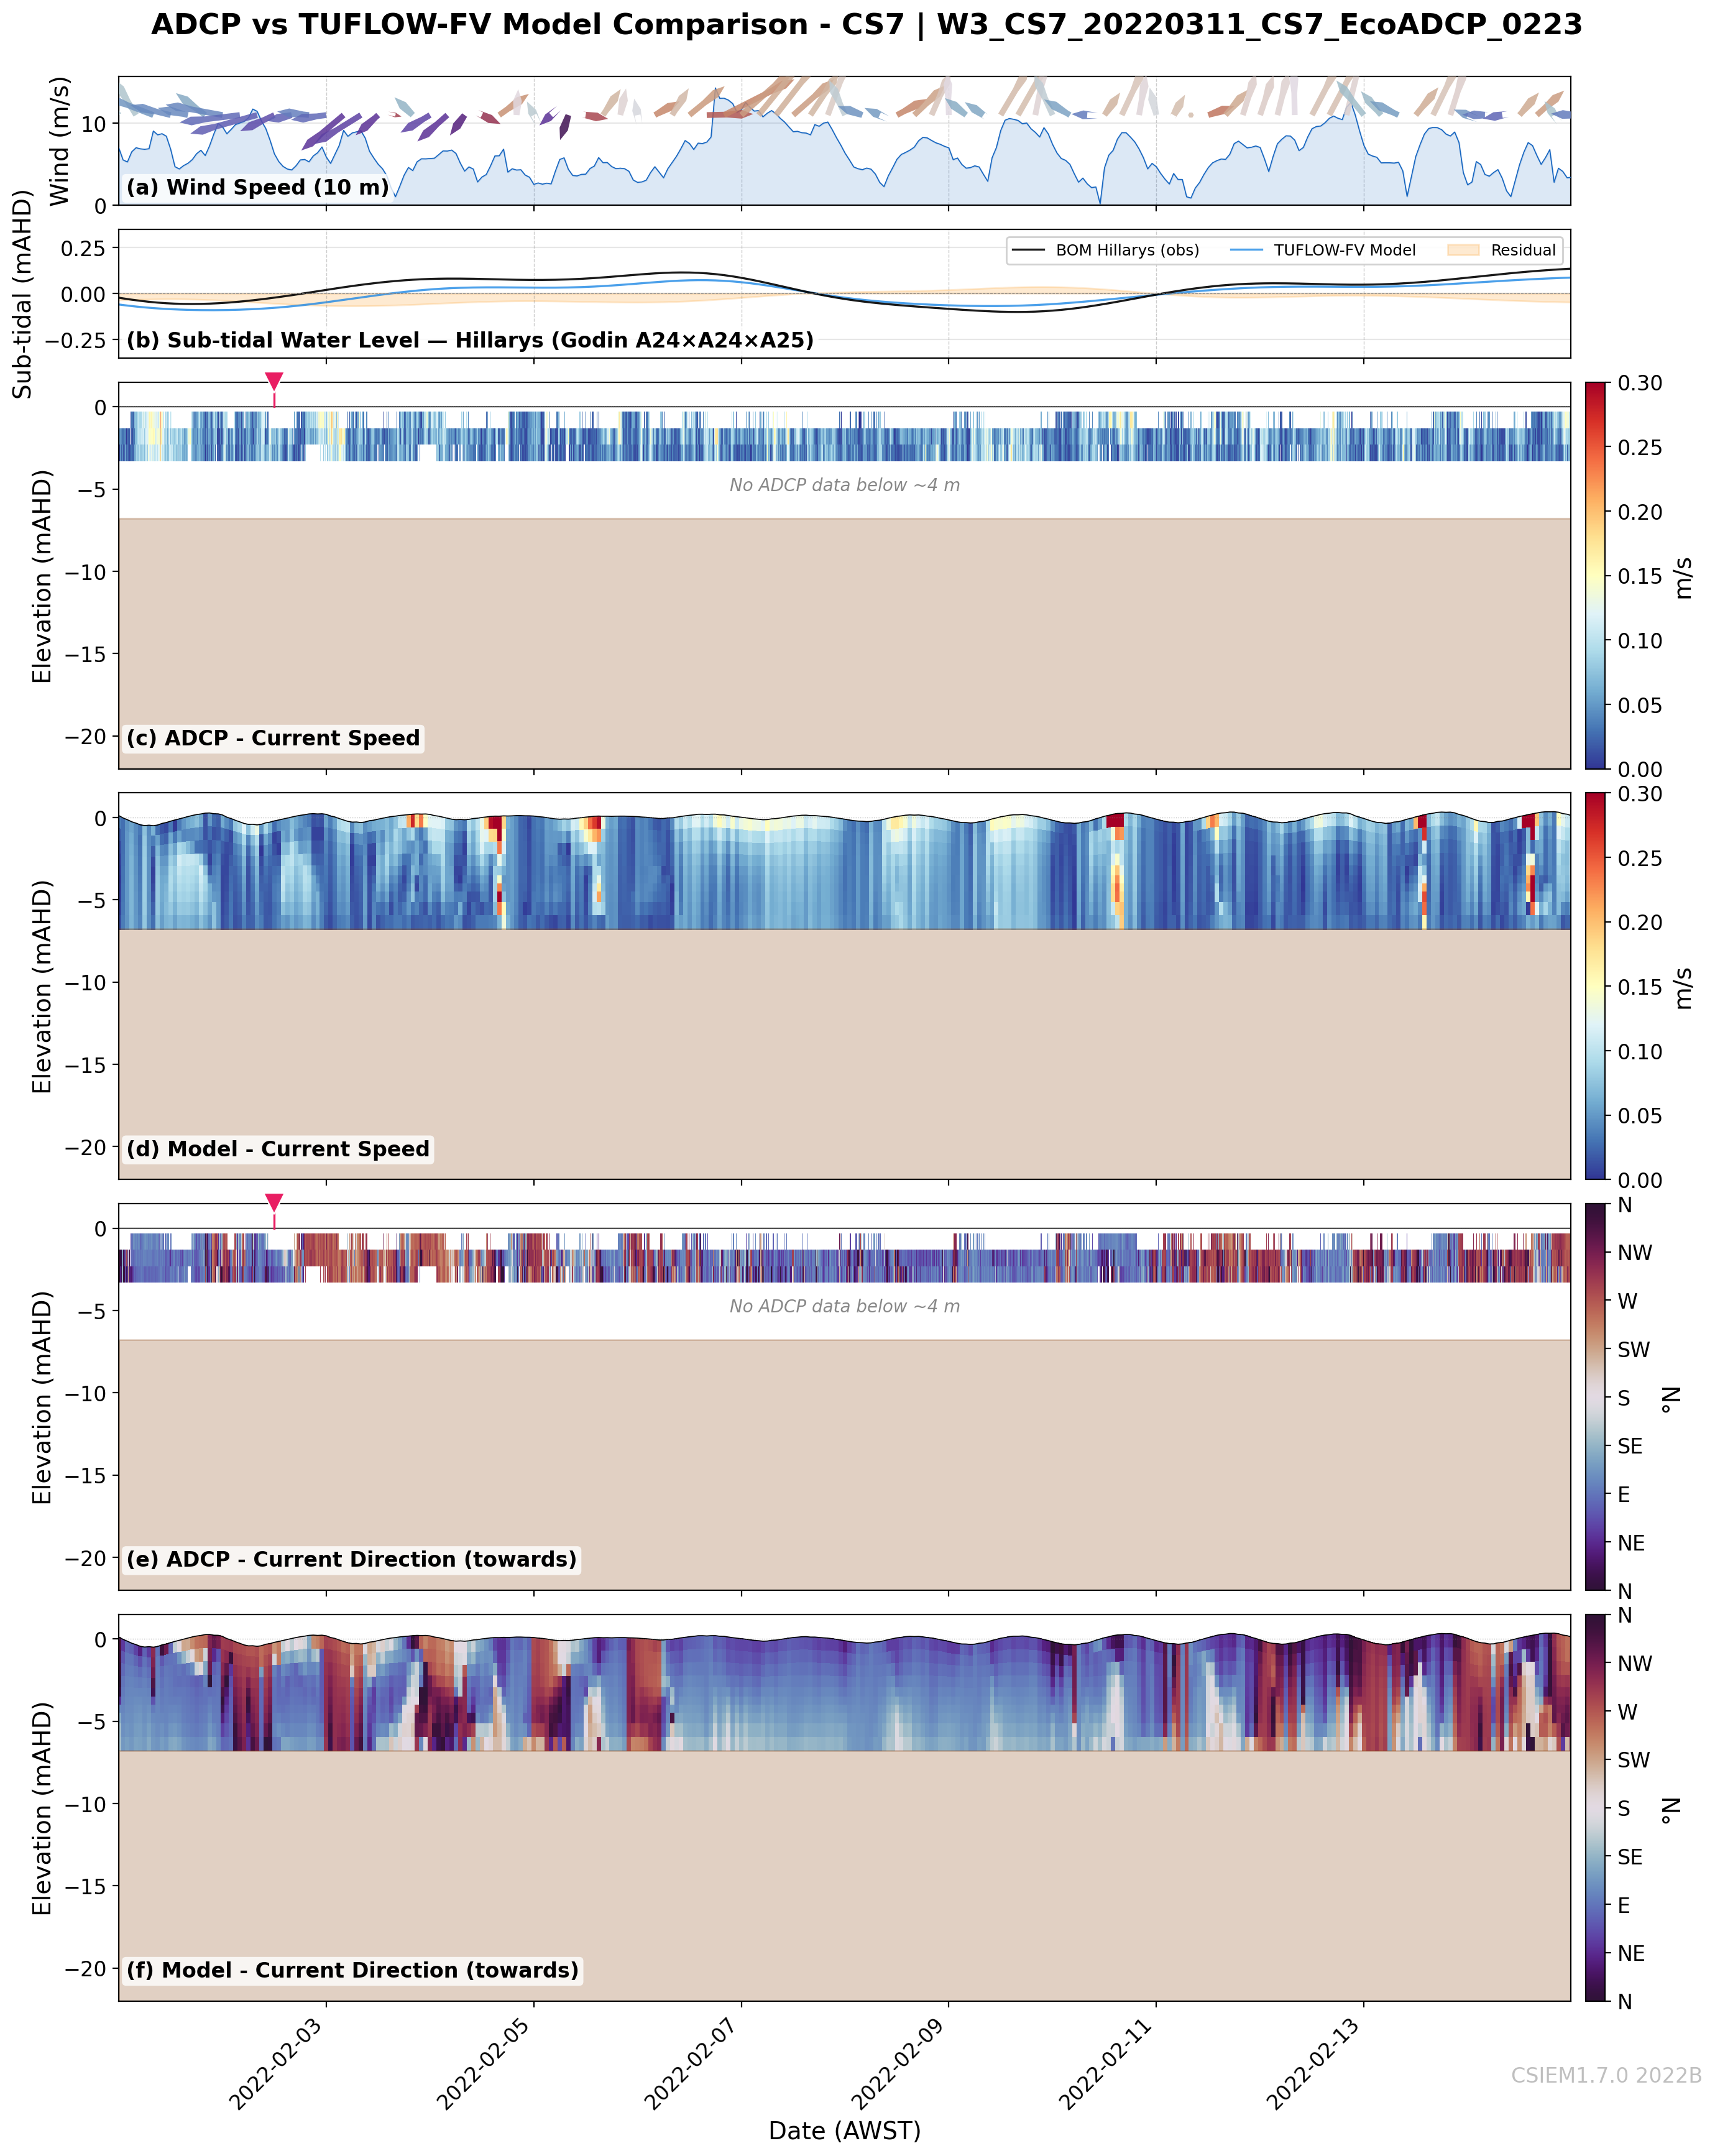
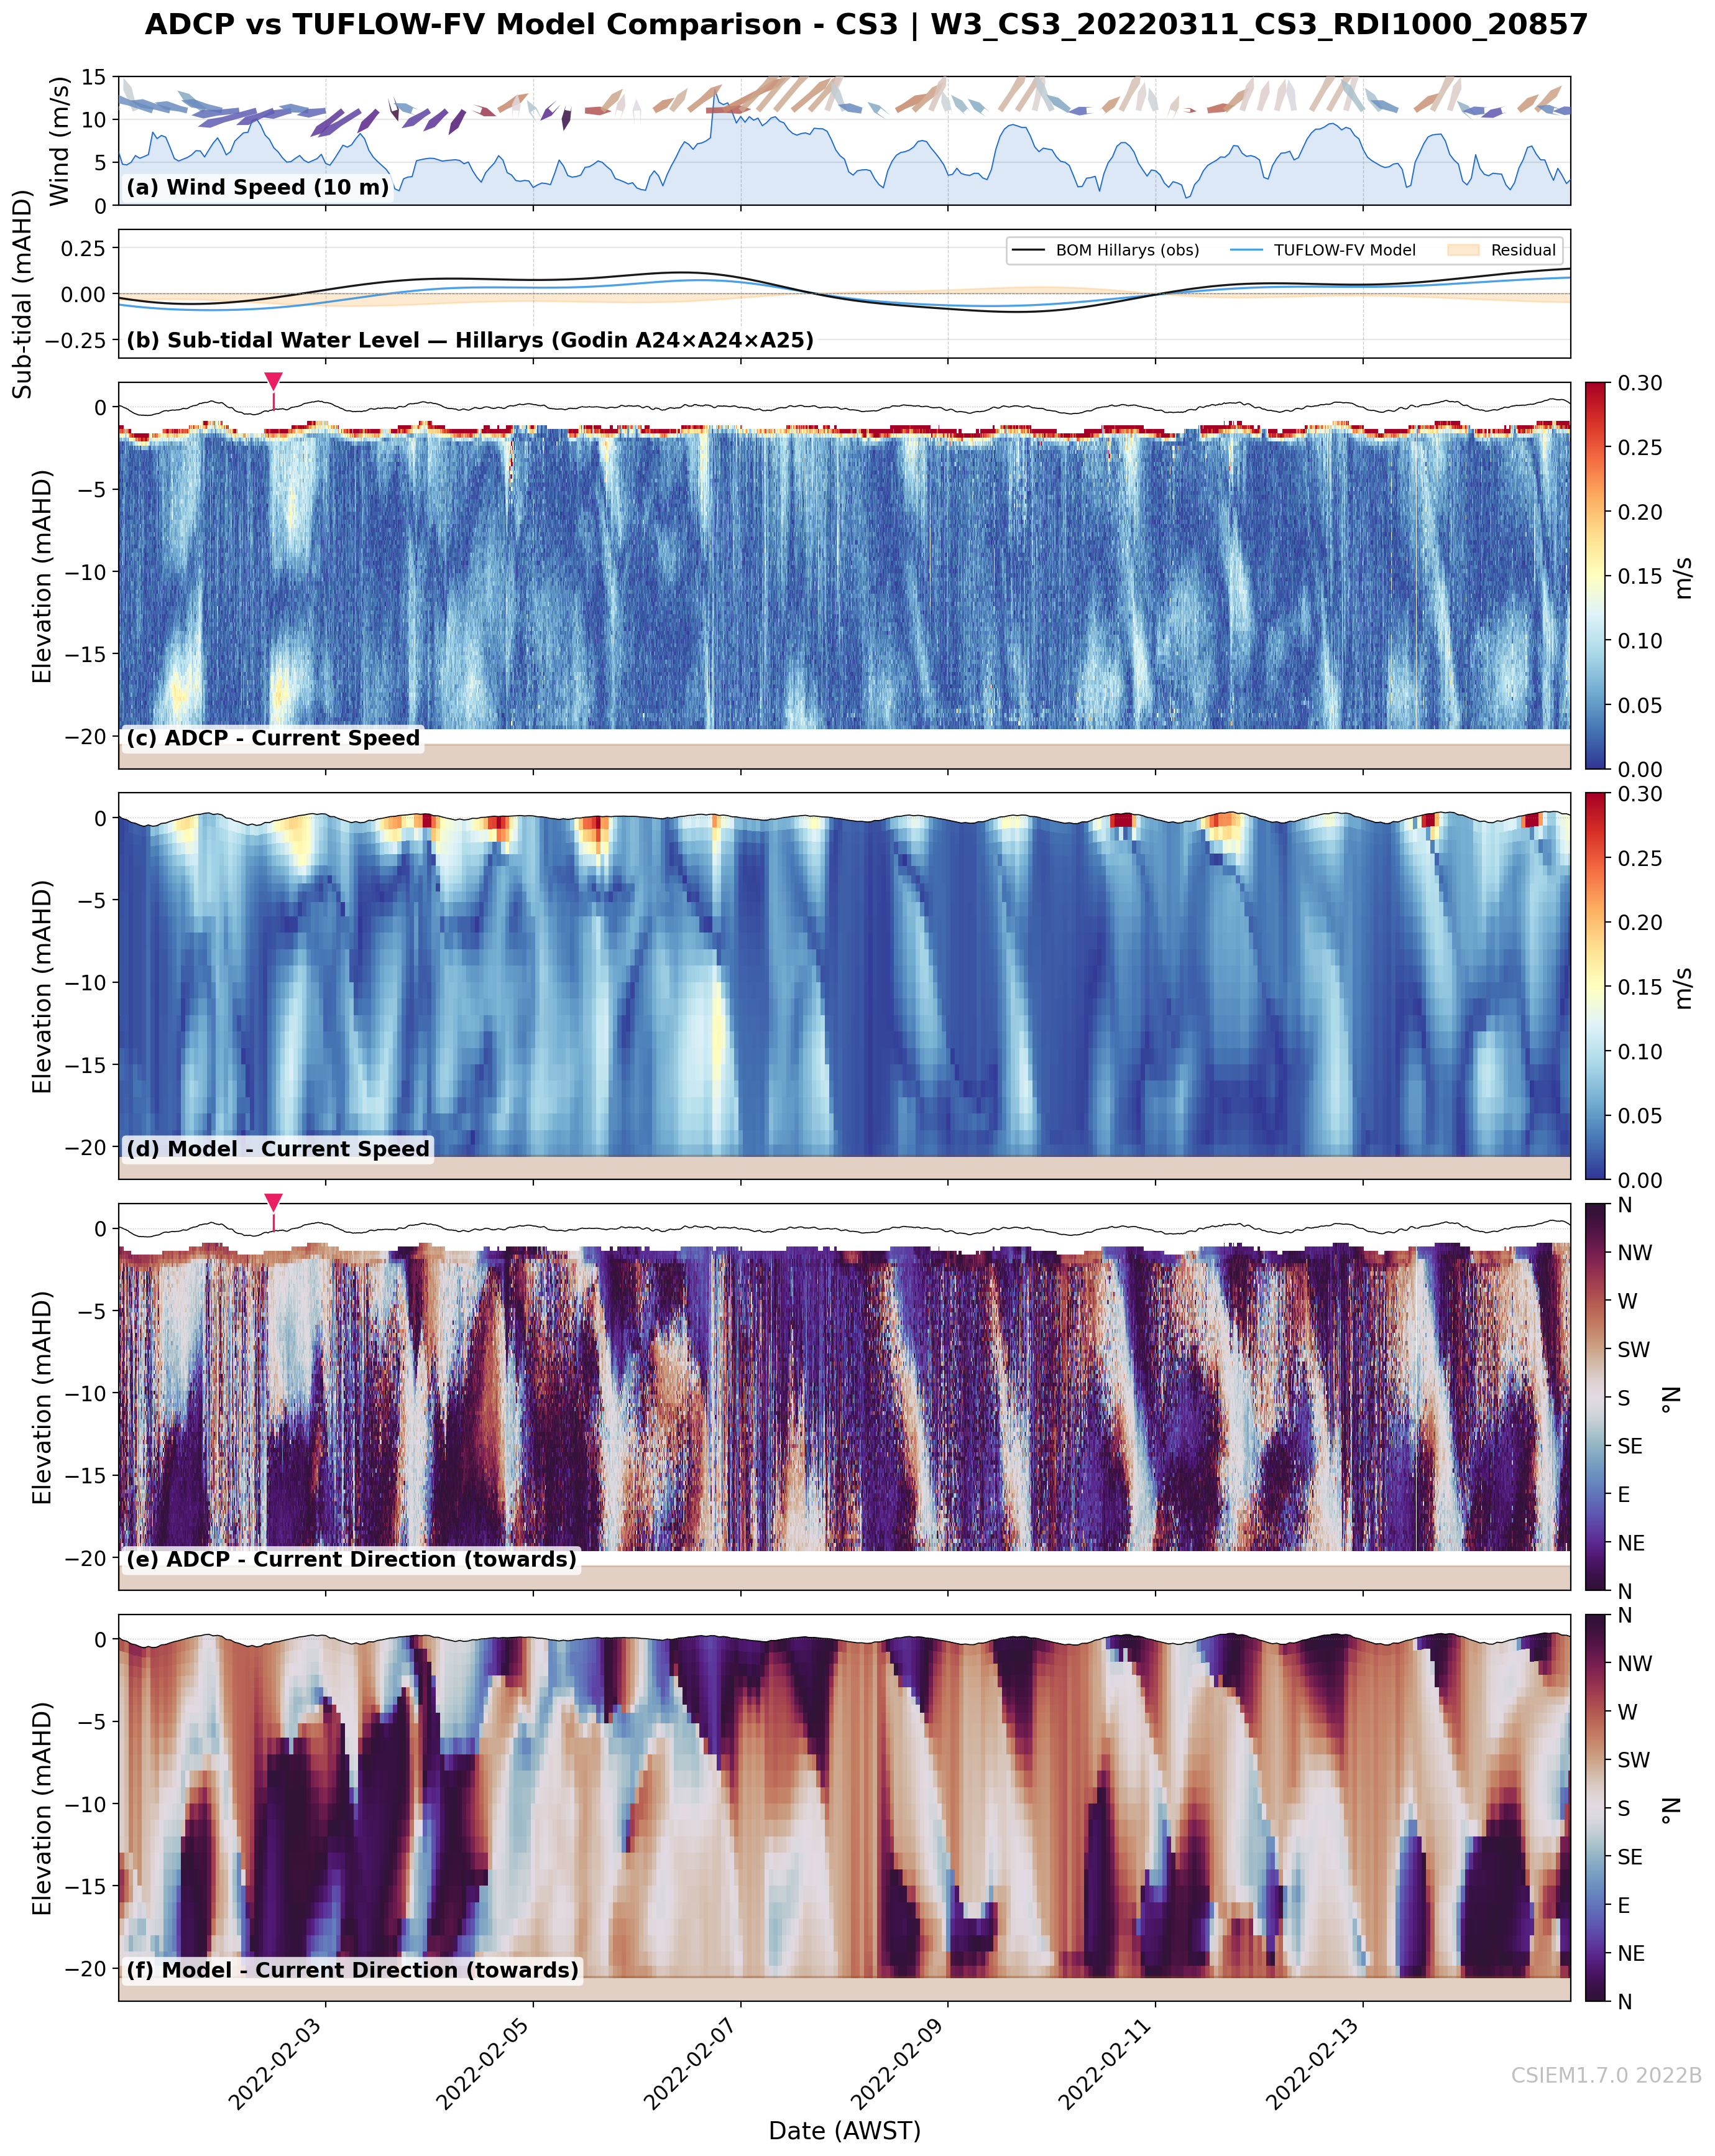
W3: Late Summer
S/SW still dominant (53%) but diurnal cycle less regular; brief NE interruptions
Full 7-site coverage enables assessment of anti-clockwise bottom gyre structure
Model captures directional shifts during NE events; some surface speed underestimation
Persistent directional offset at CS3 (southern basin)
Model notes: Most spatially complete window (all 7 sites). Model captures timing of directional shifts during brief NE events but near-surface speed intensification slightly exceeds modelled values. CS3 directional offset persists and model overestimates directional coherence at this site — suggests local bathymetric steering the B-mesh does not fully resolve. Bottom gyre vectors show anti-clockwise pattern consistent with D’Adamo summer regime.
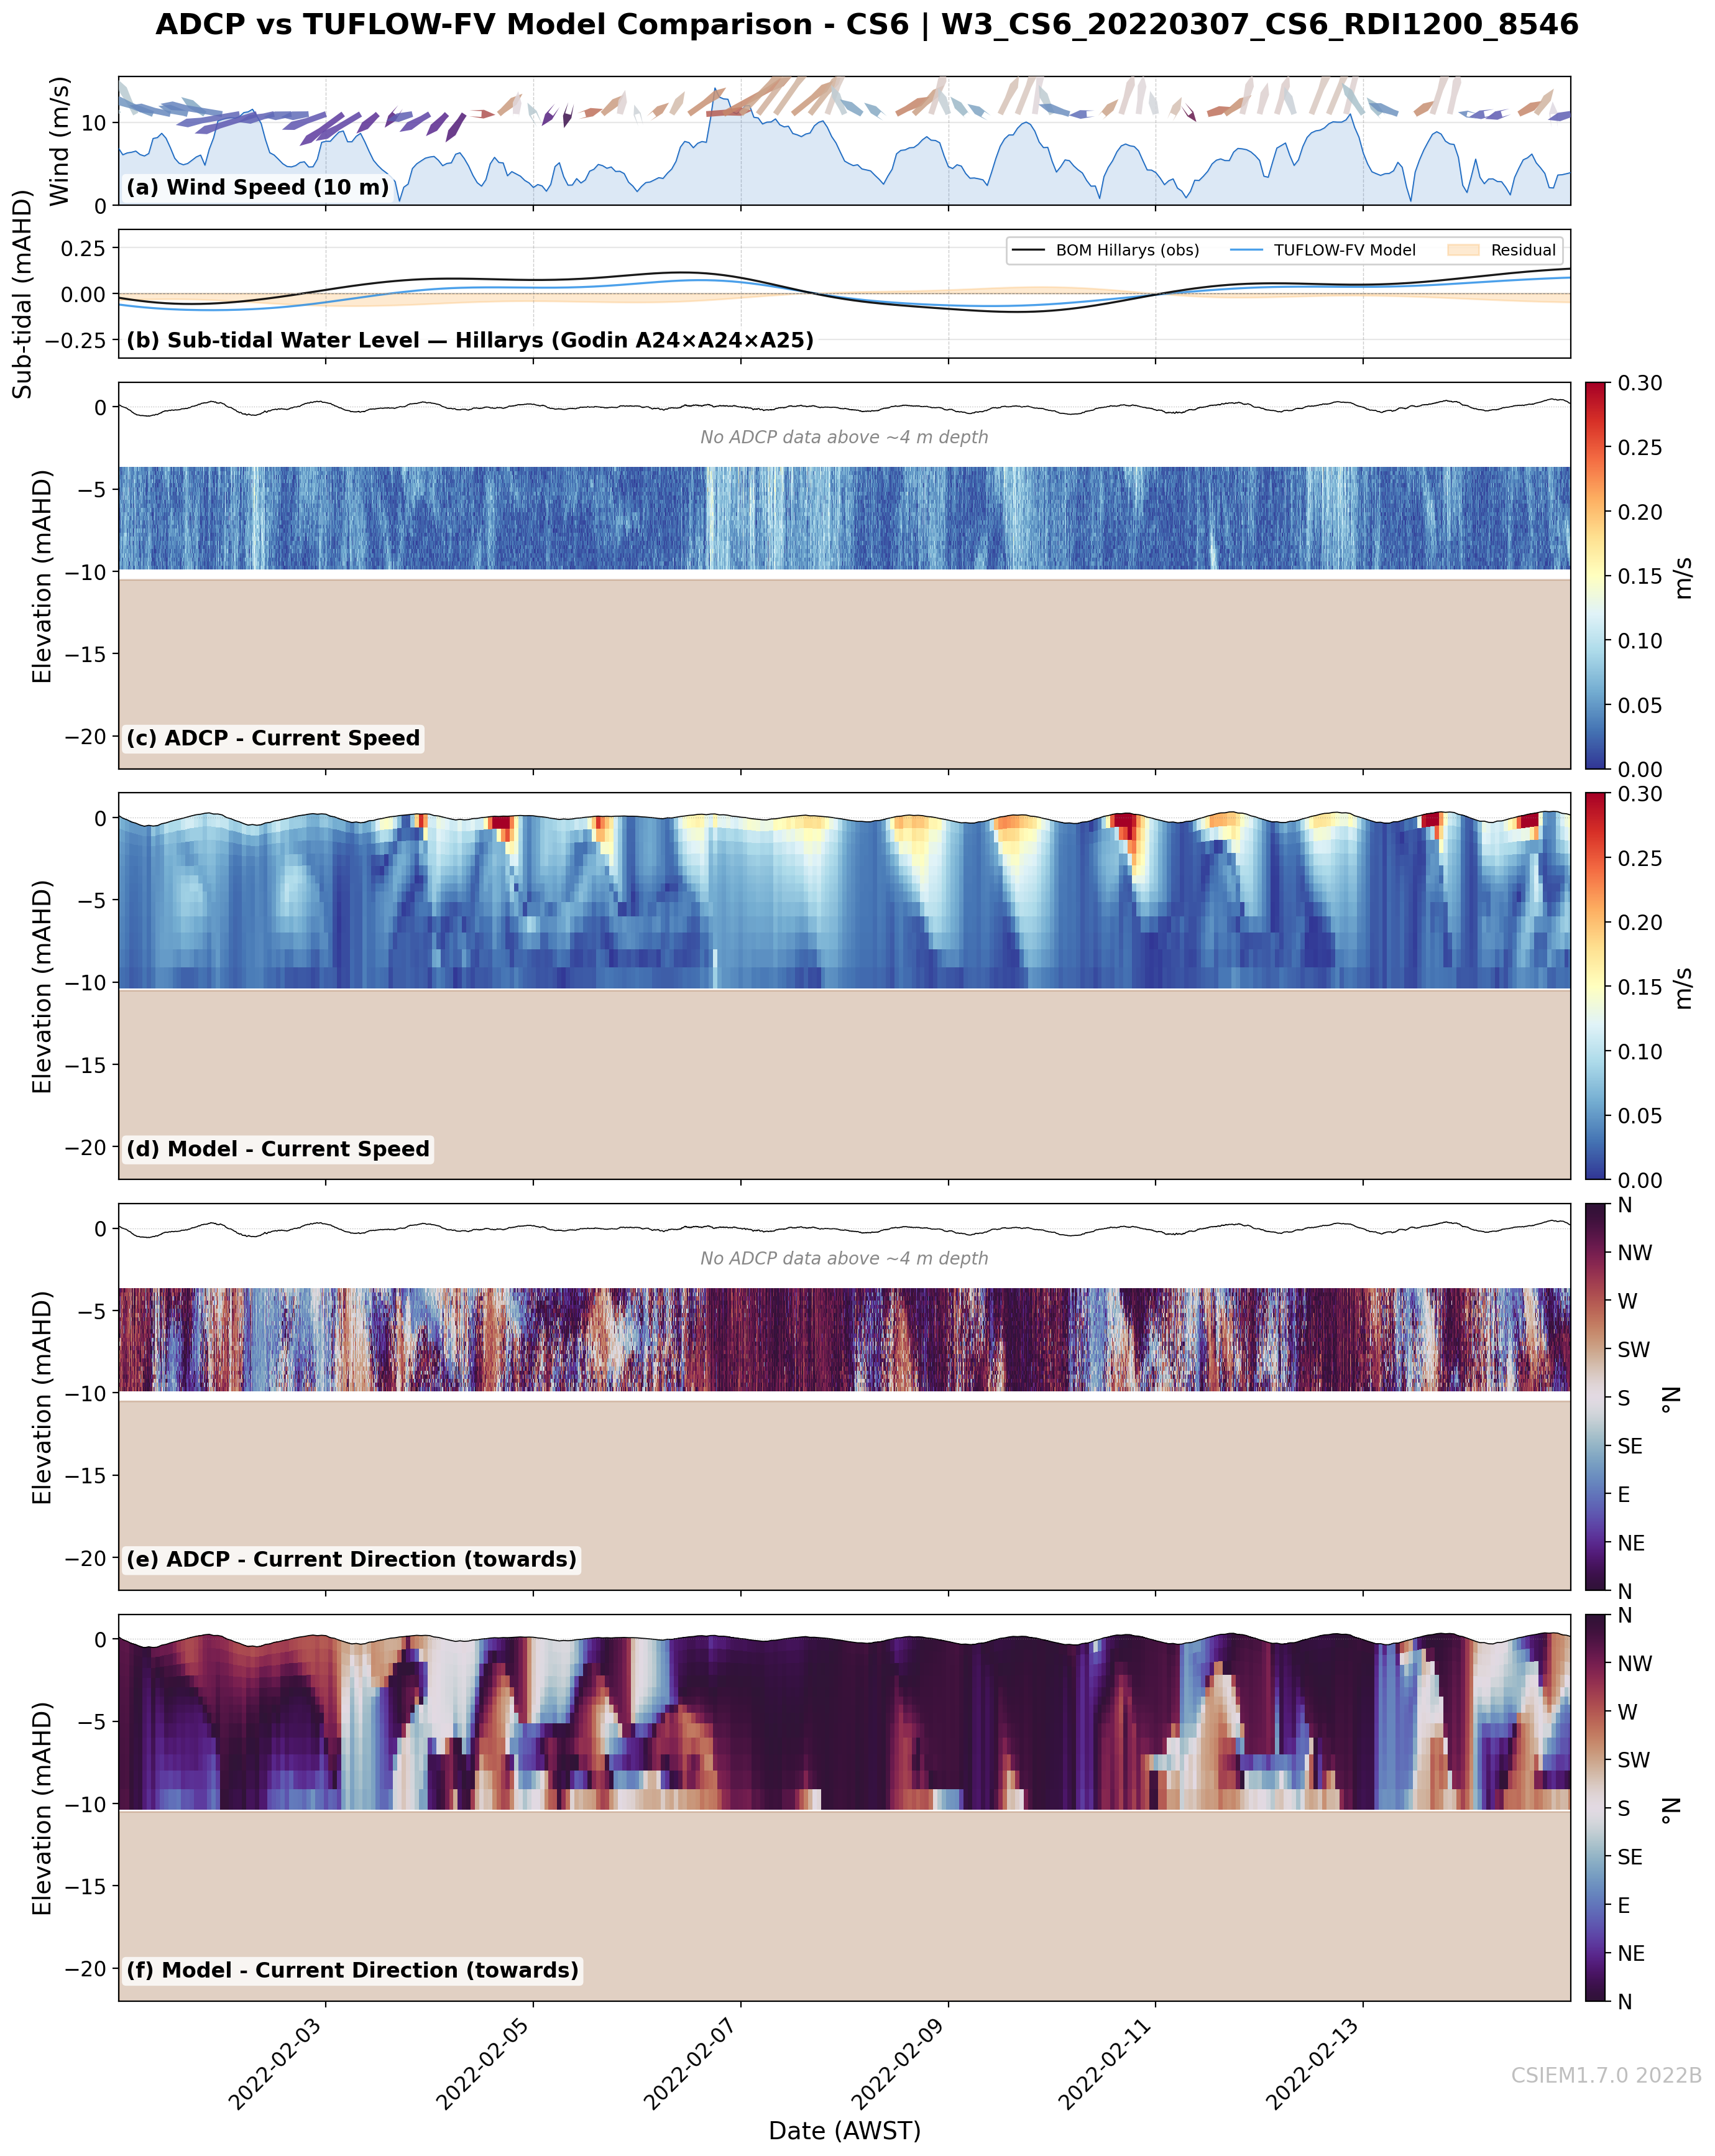
CS6 (11m) — Owen Anchorage
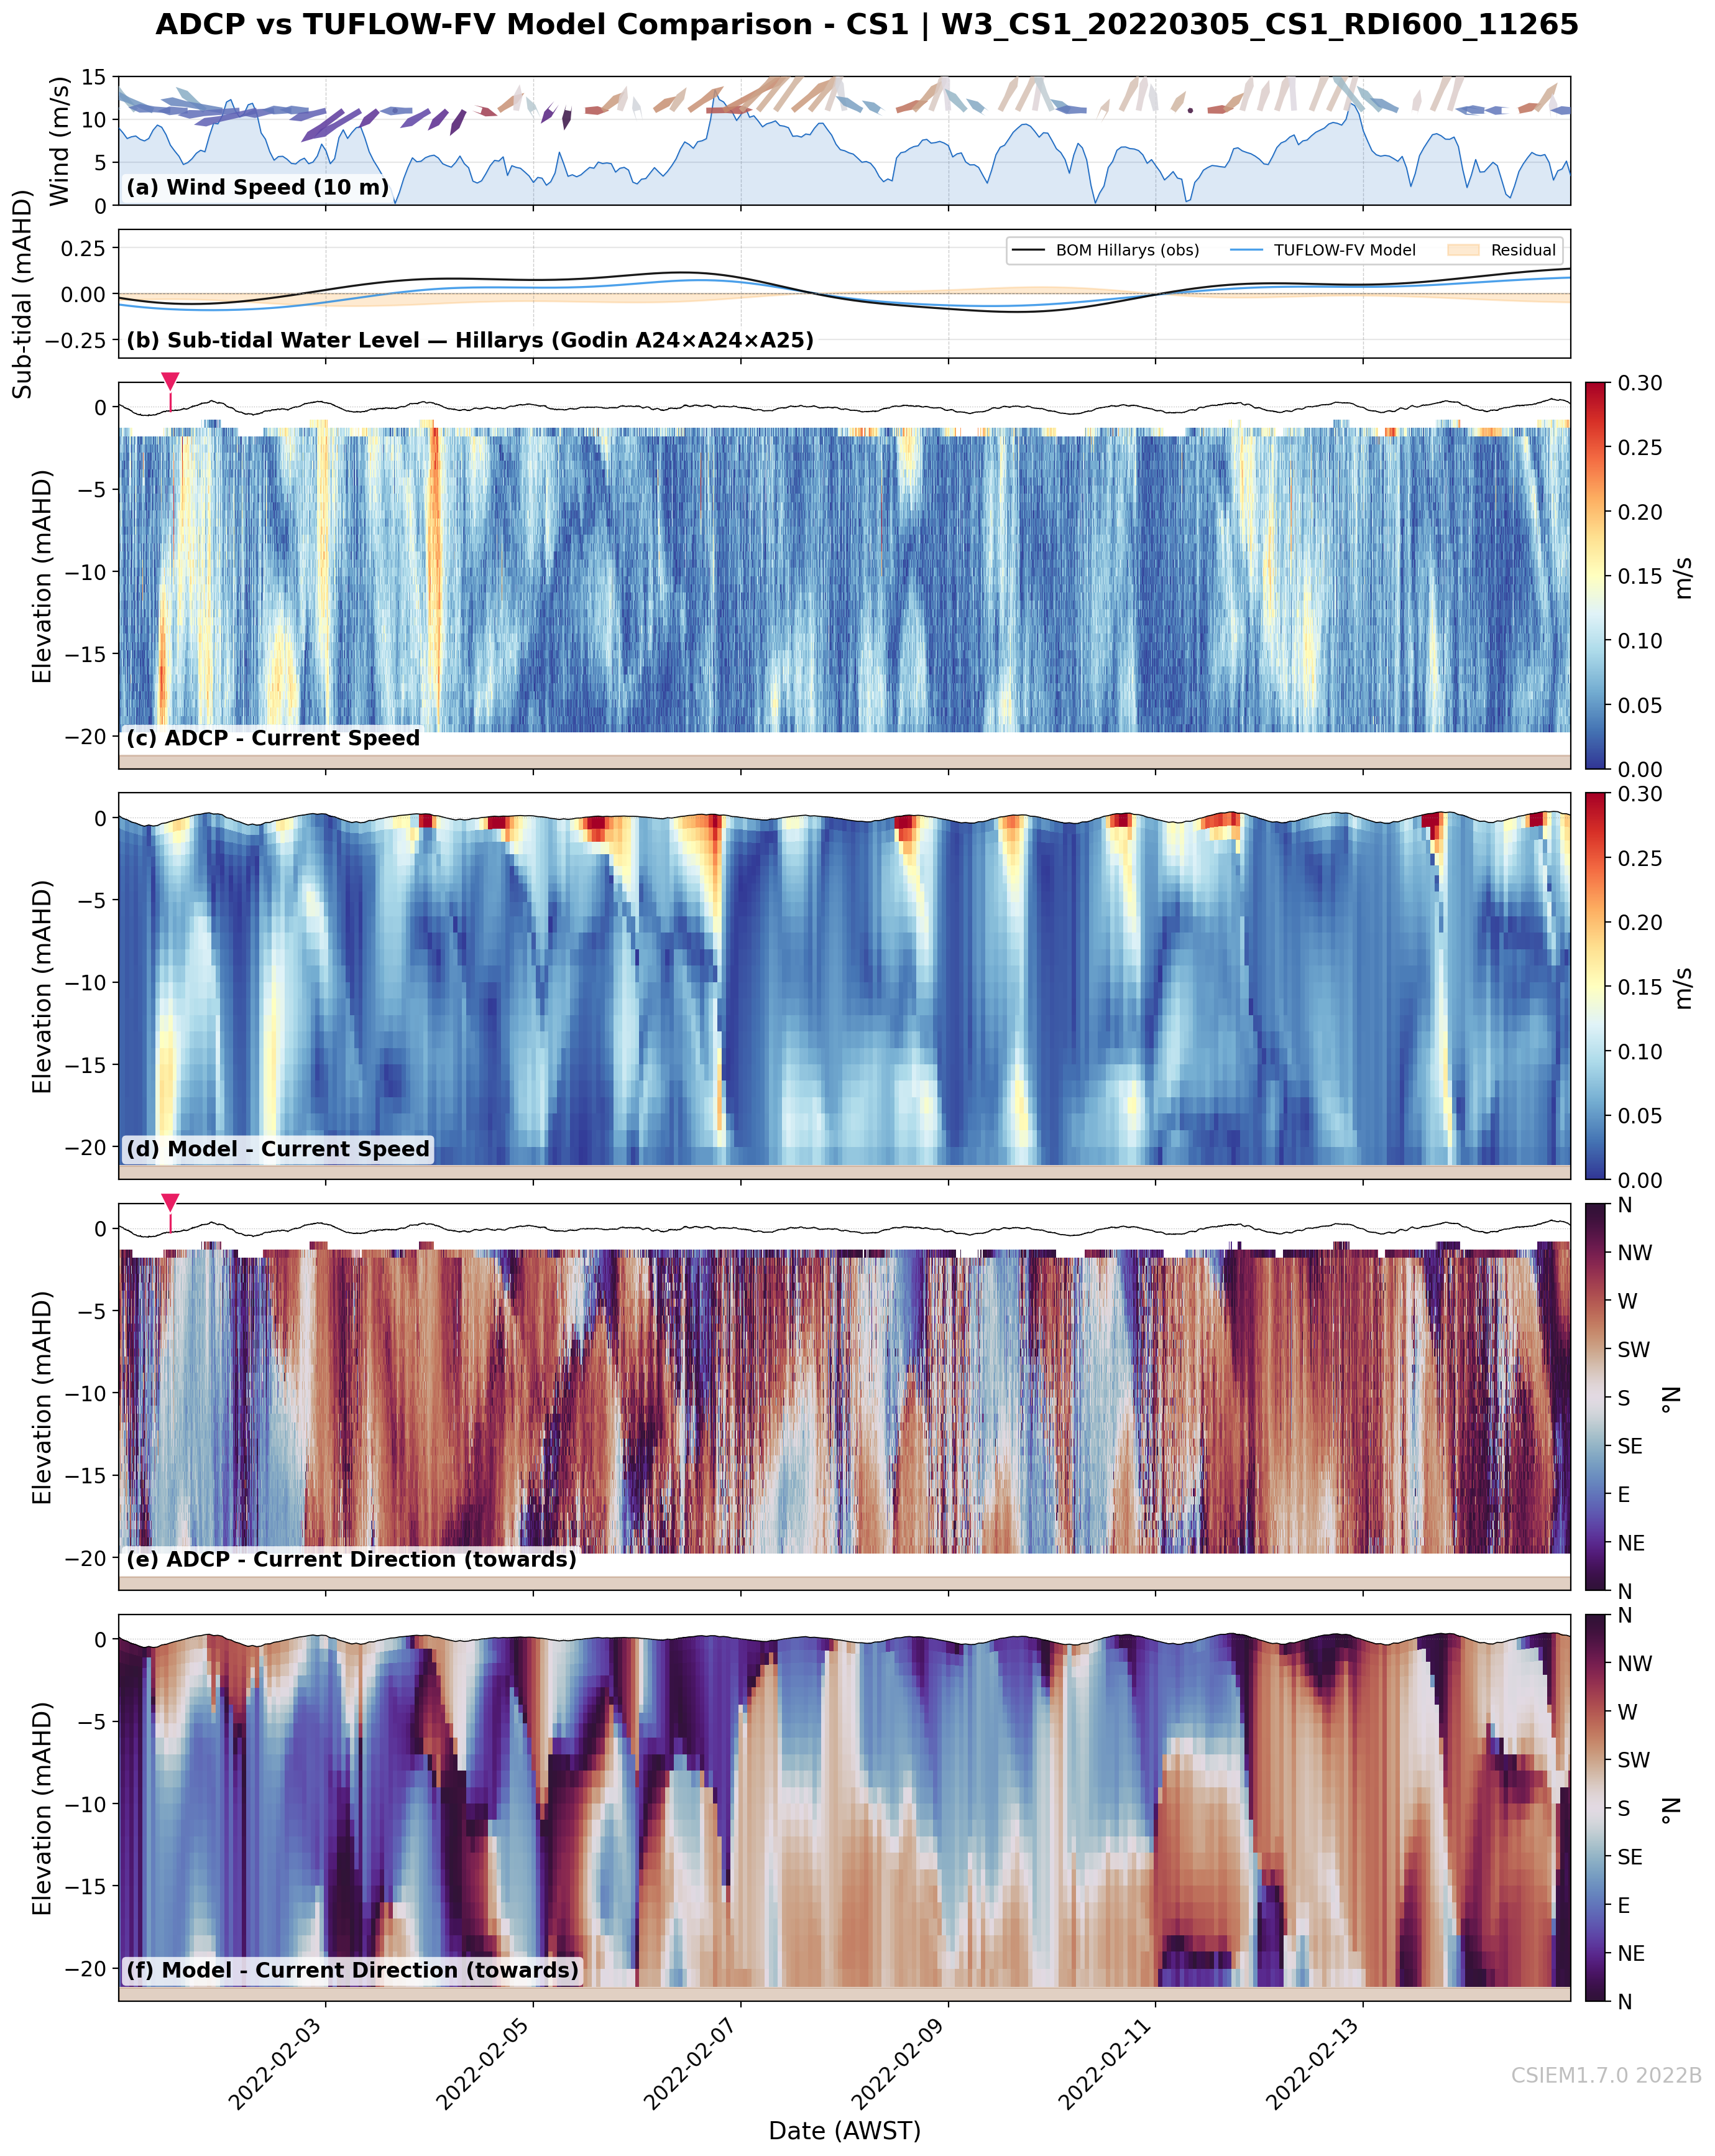
CS1 (20m) — Basin (north)
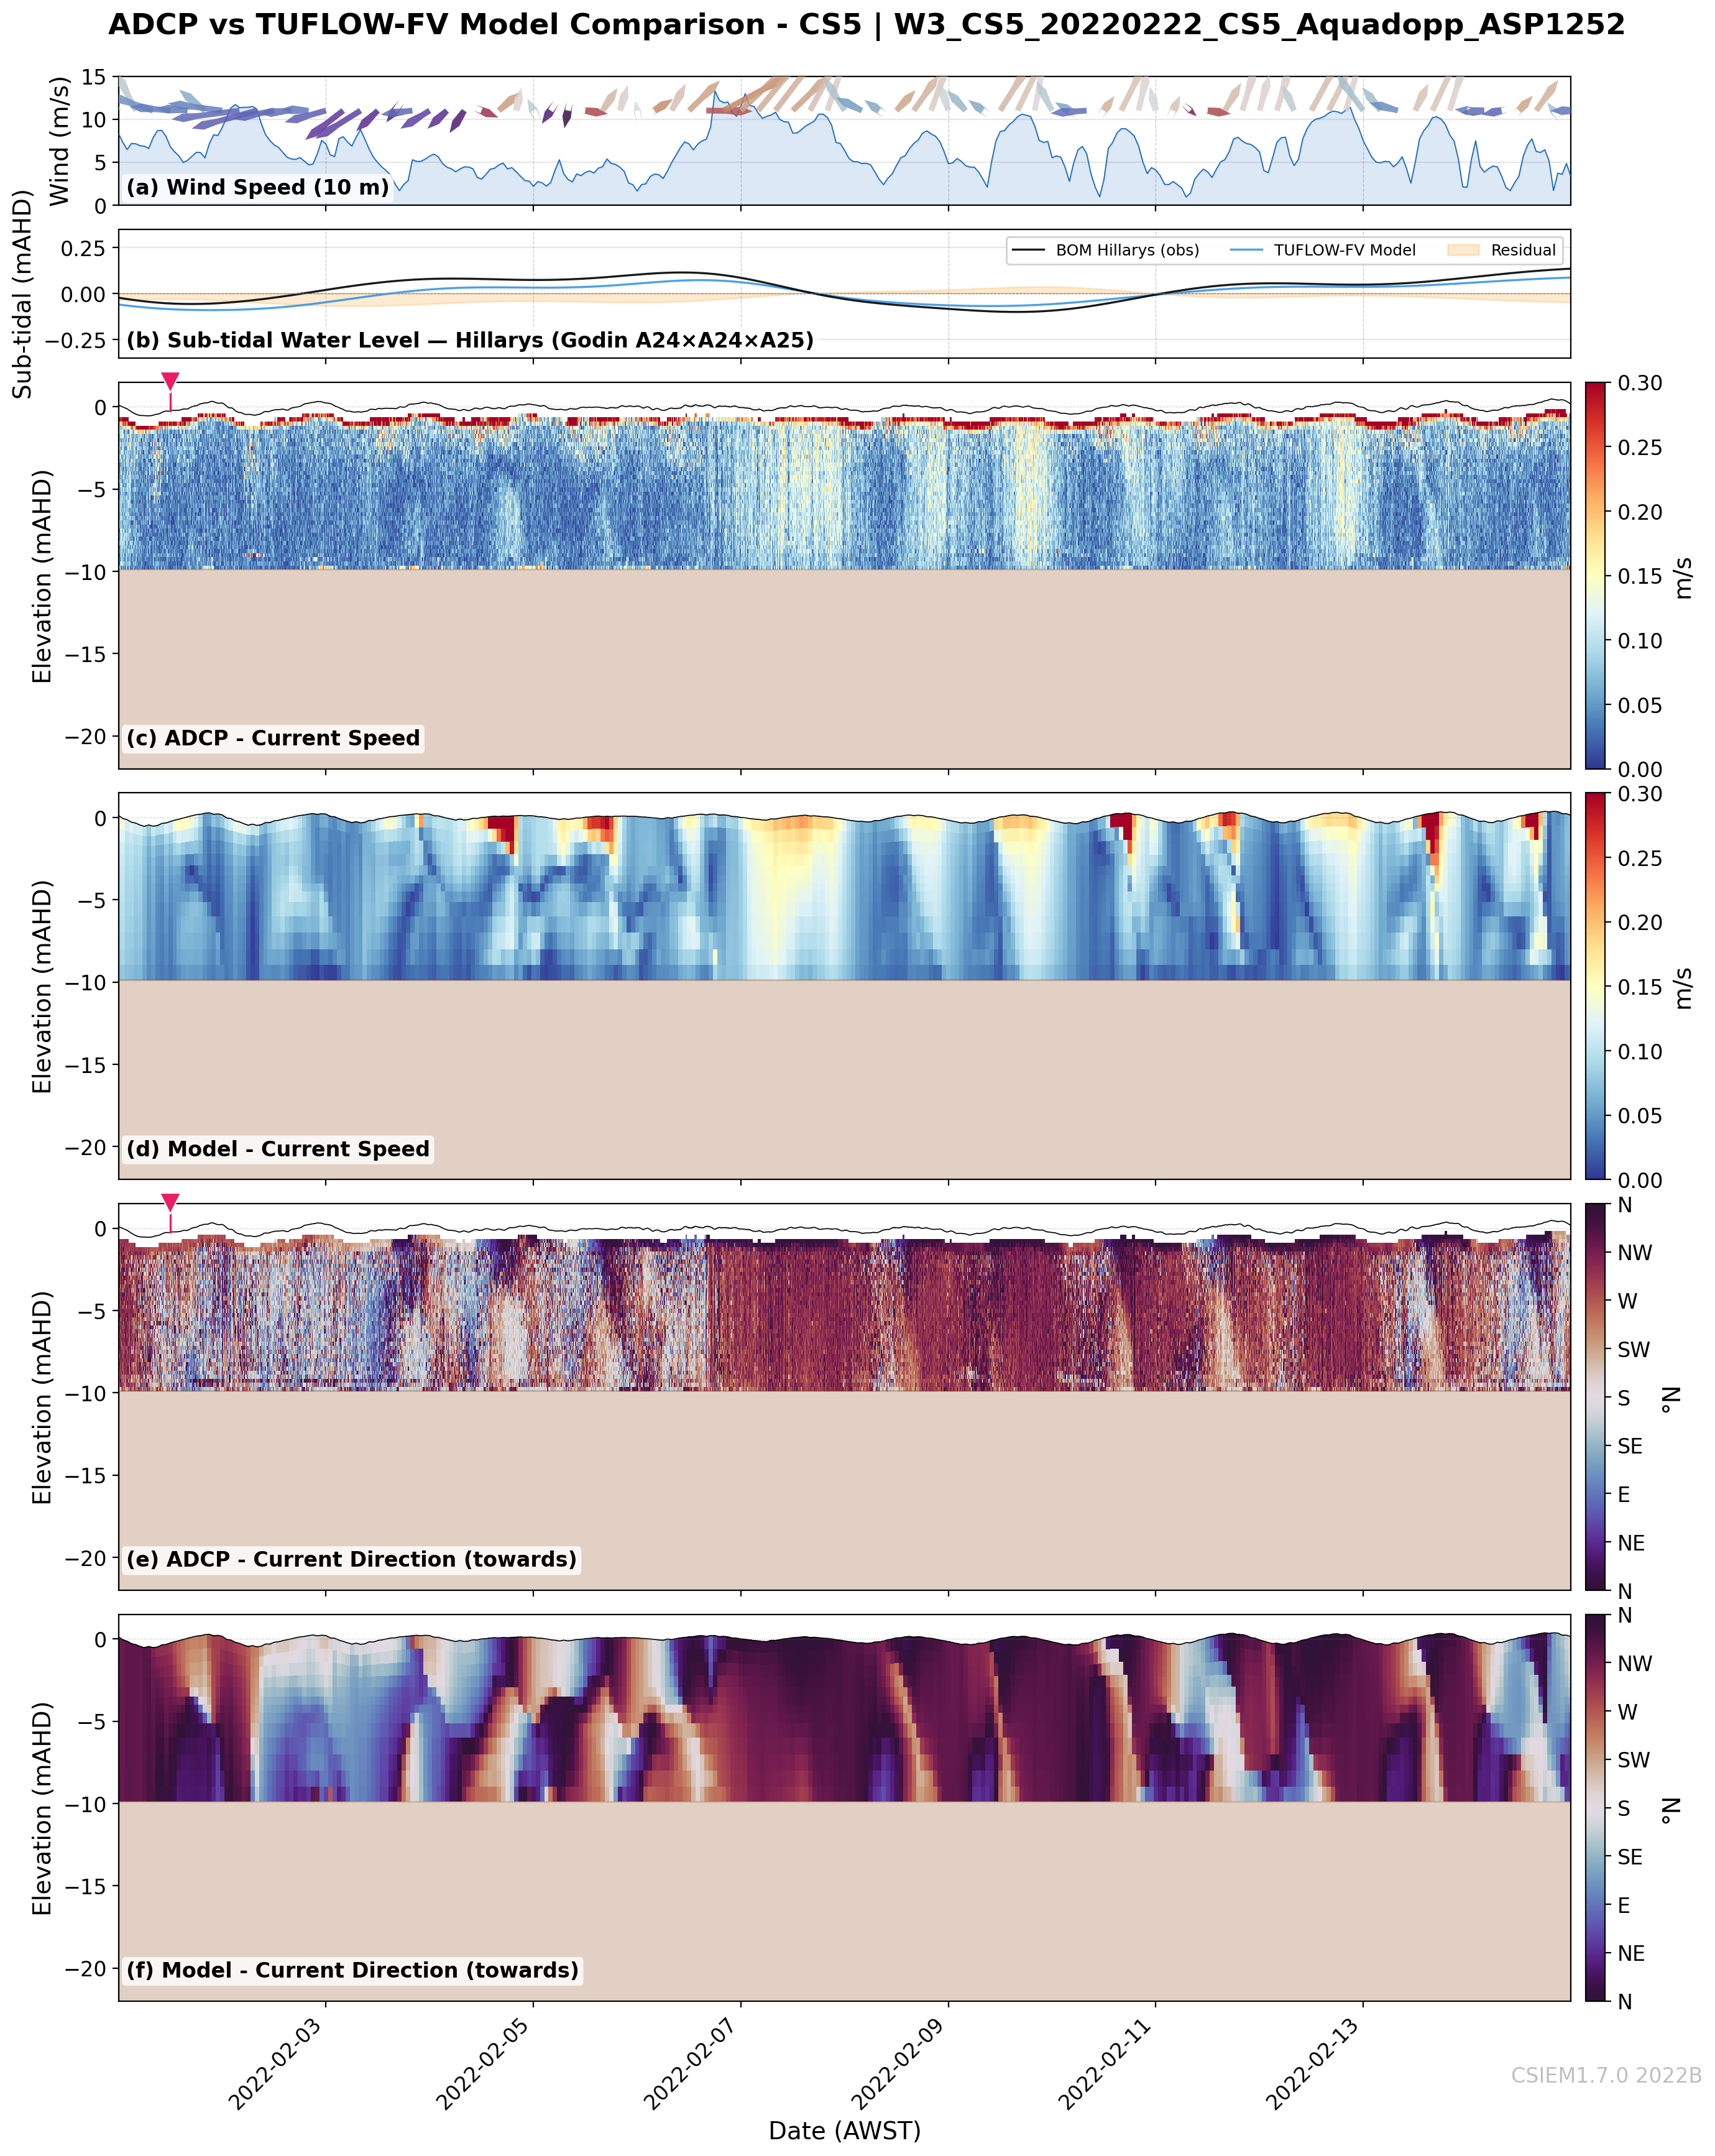
CS5 (11m) — Shelf (north)
CS2 (20m) — Basin (mid-west)
CS4 (11m) — Shelf (south)
CS7 (6m) — Causeway
CS3 (20m) — Basin (south)
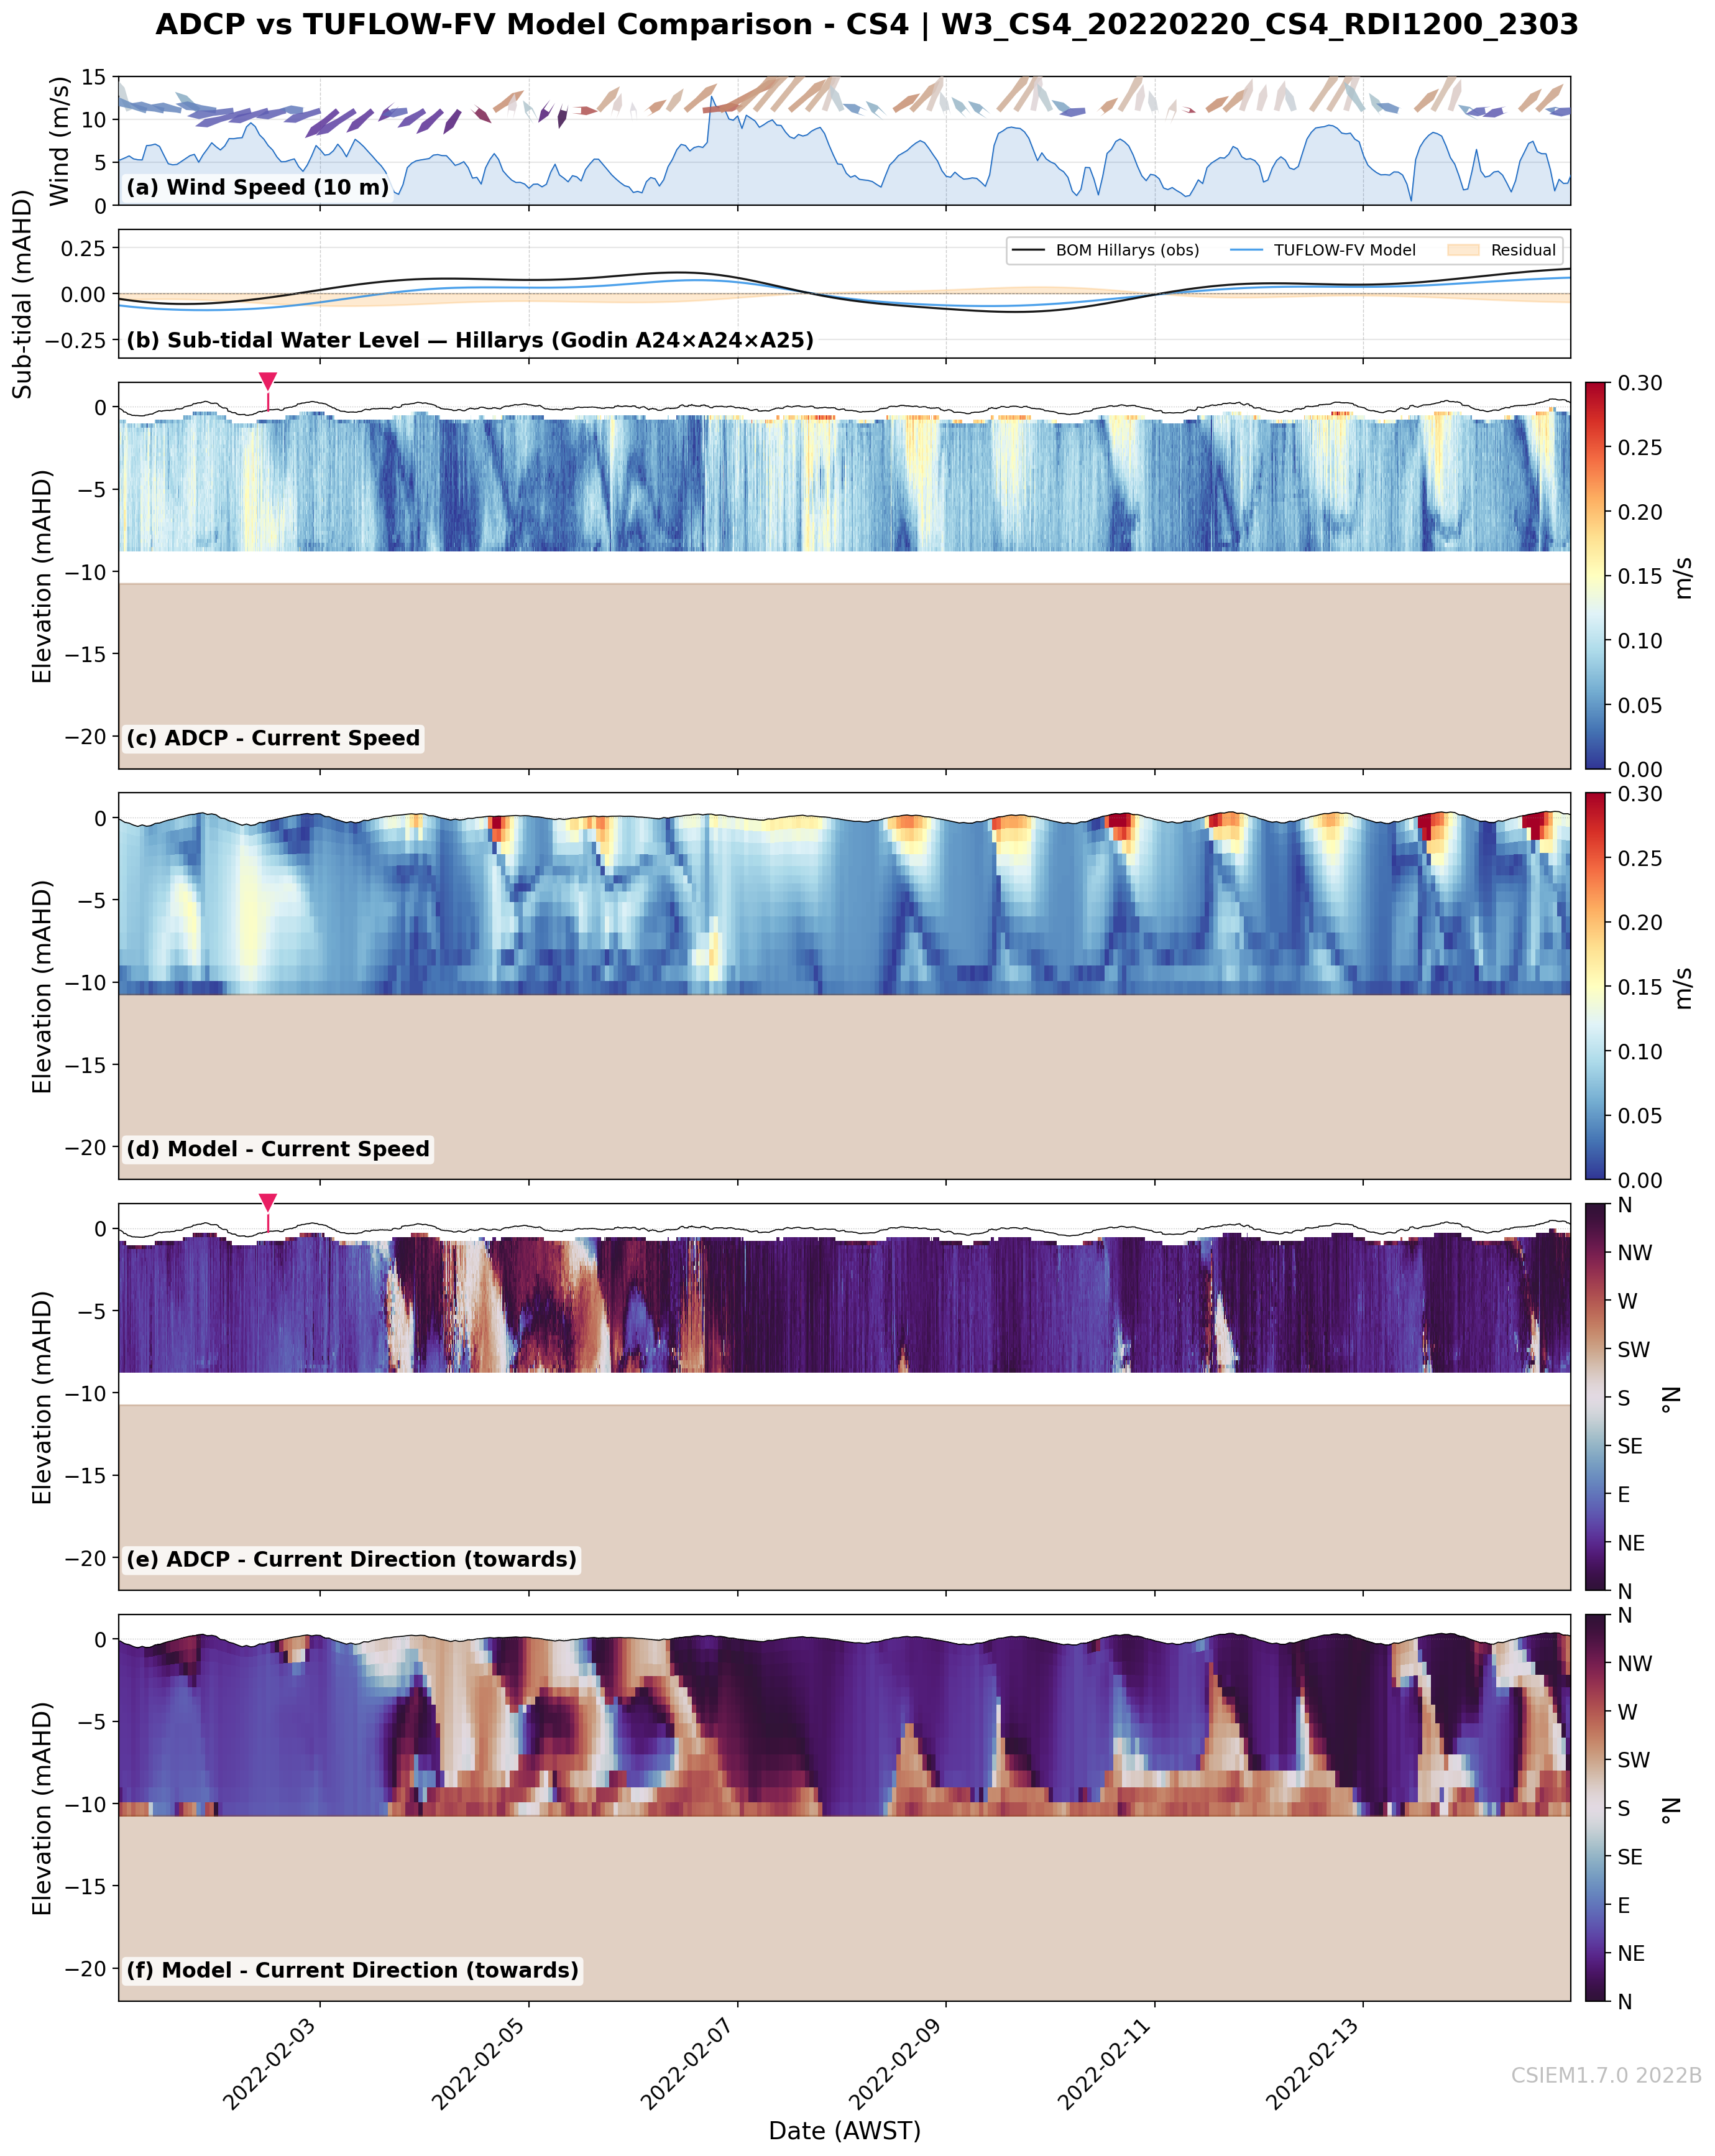
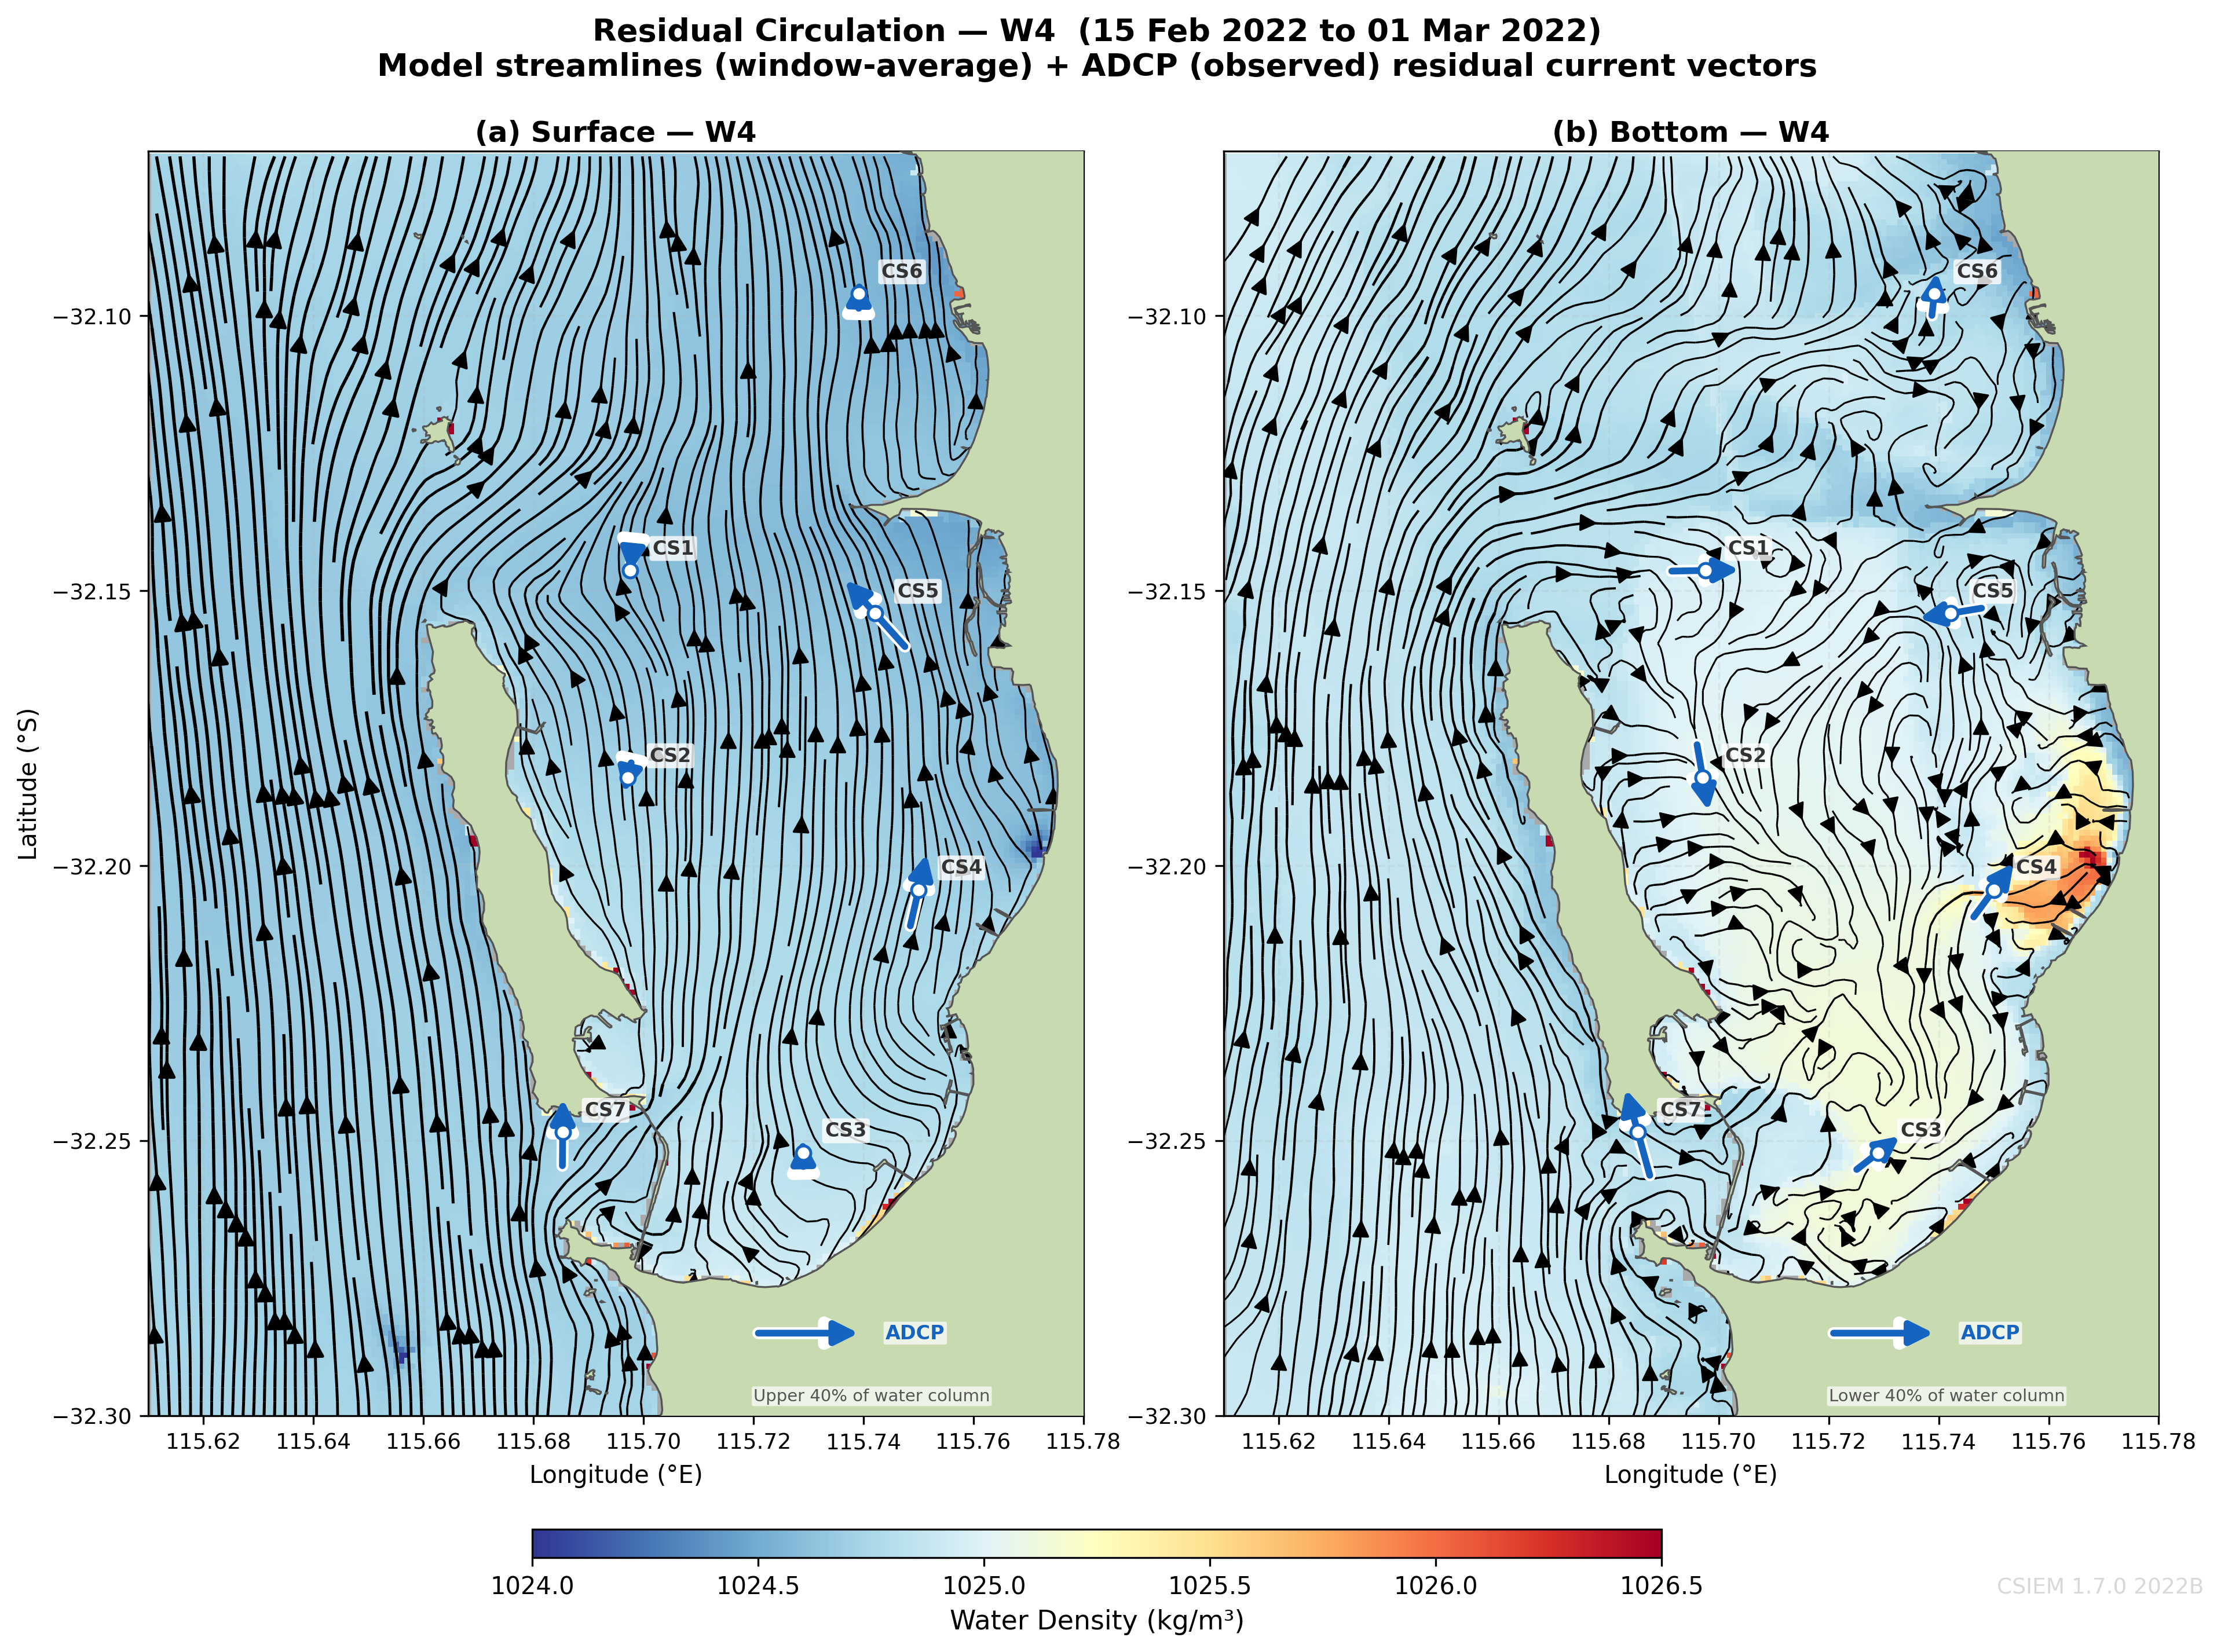
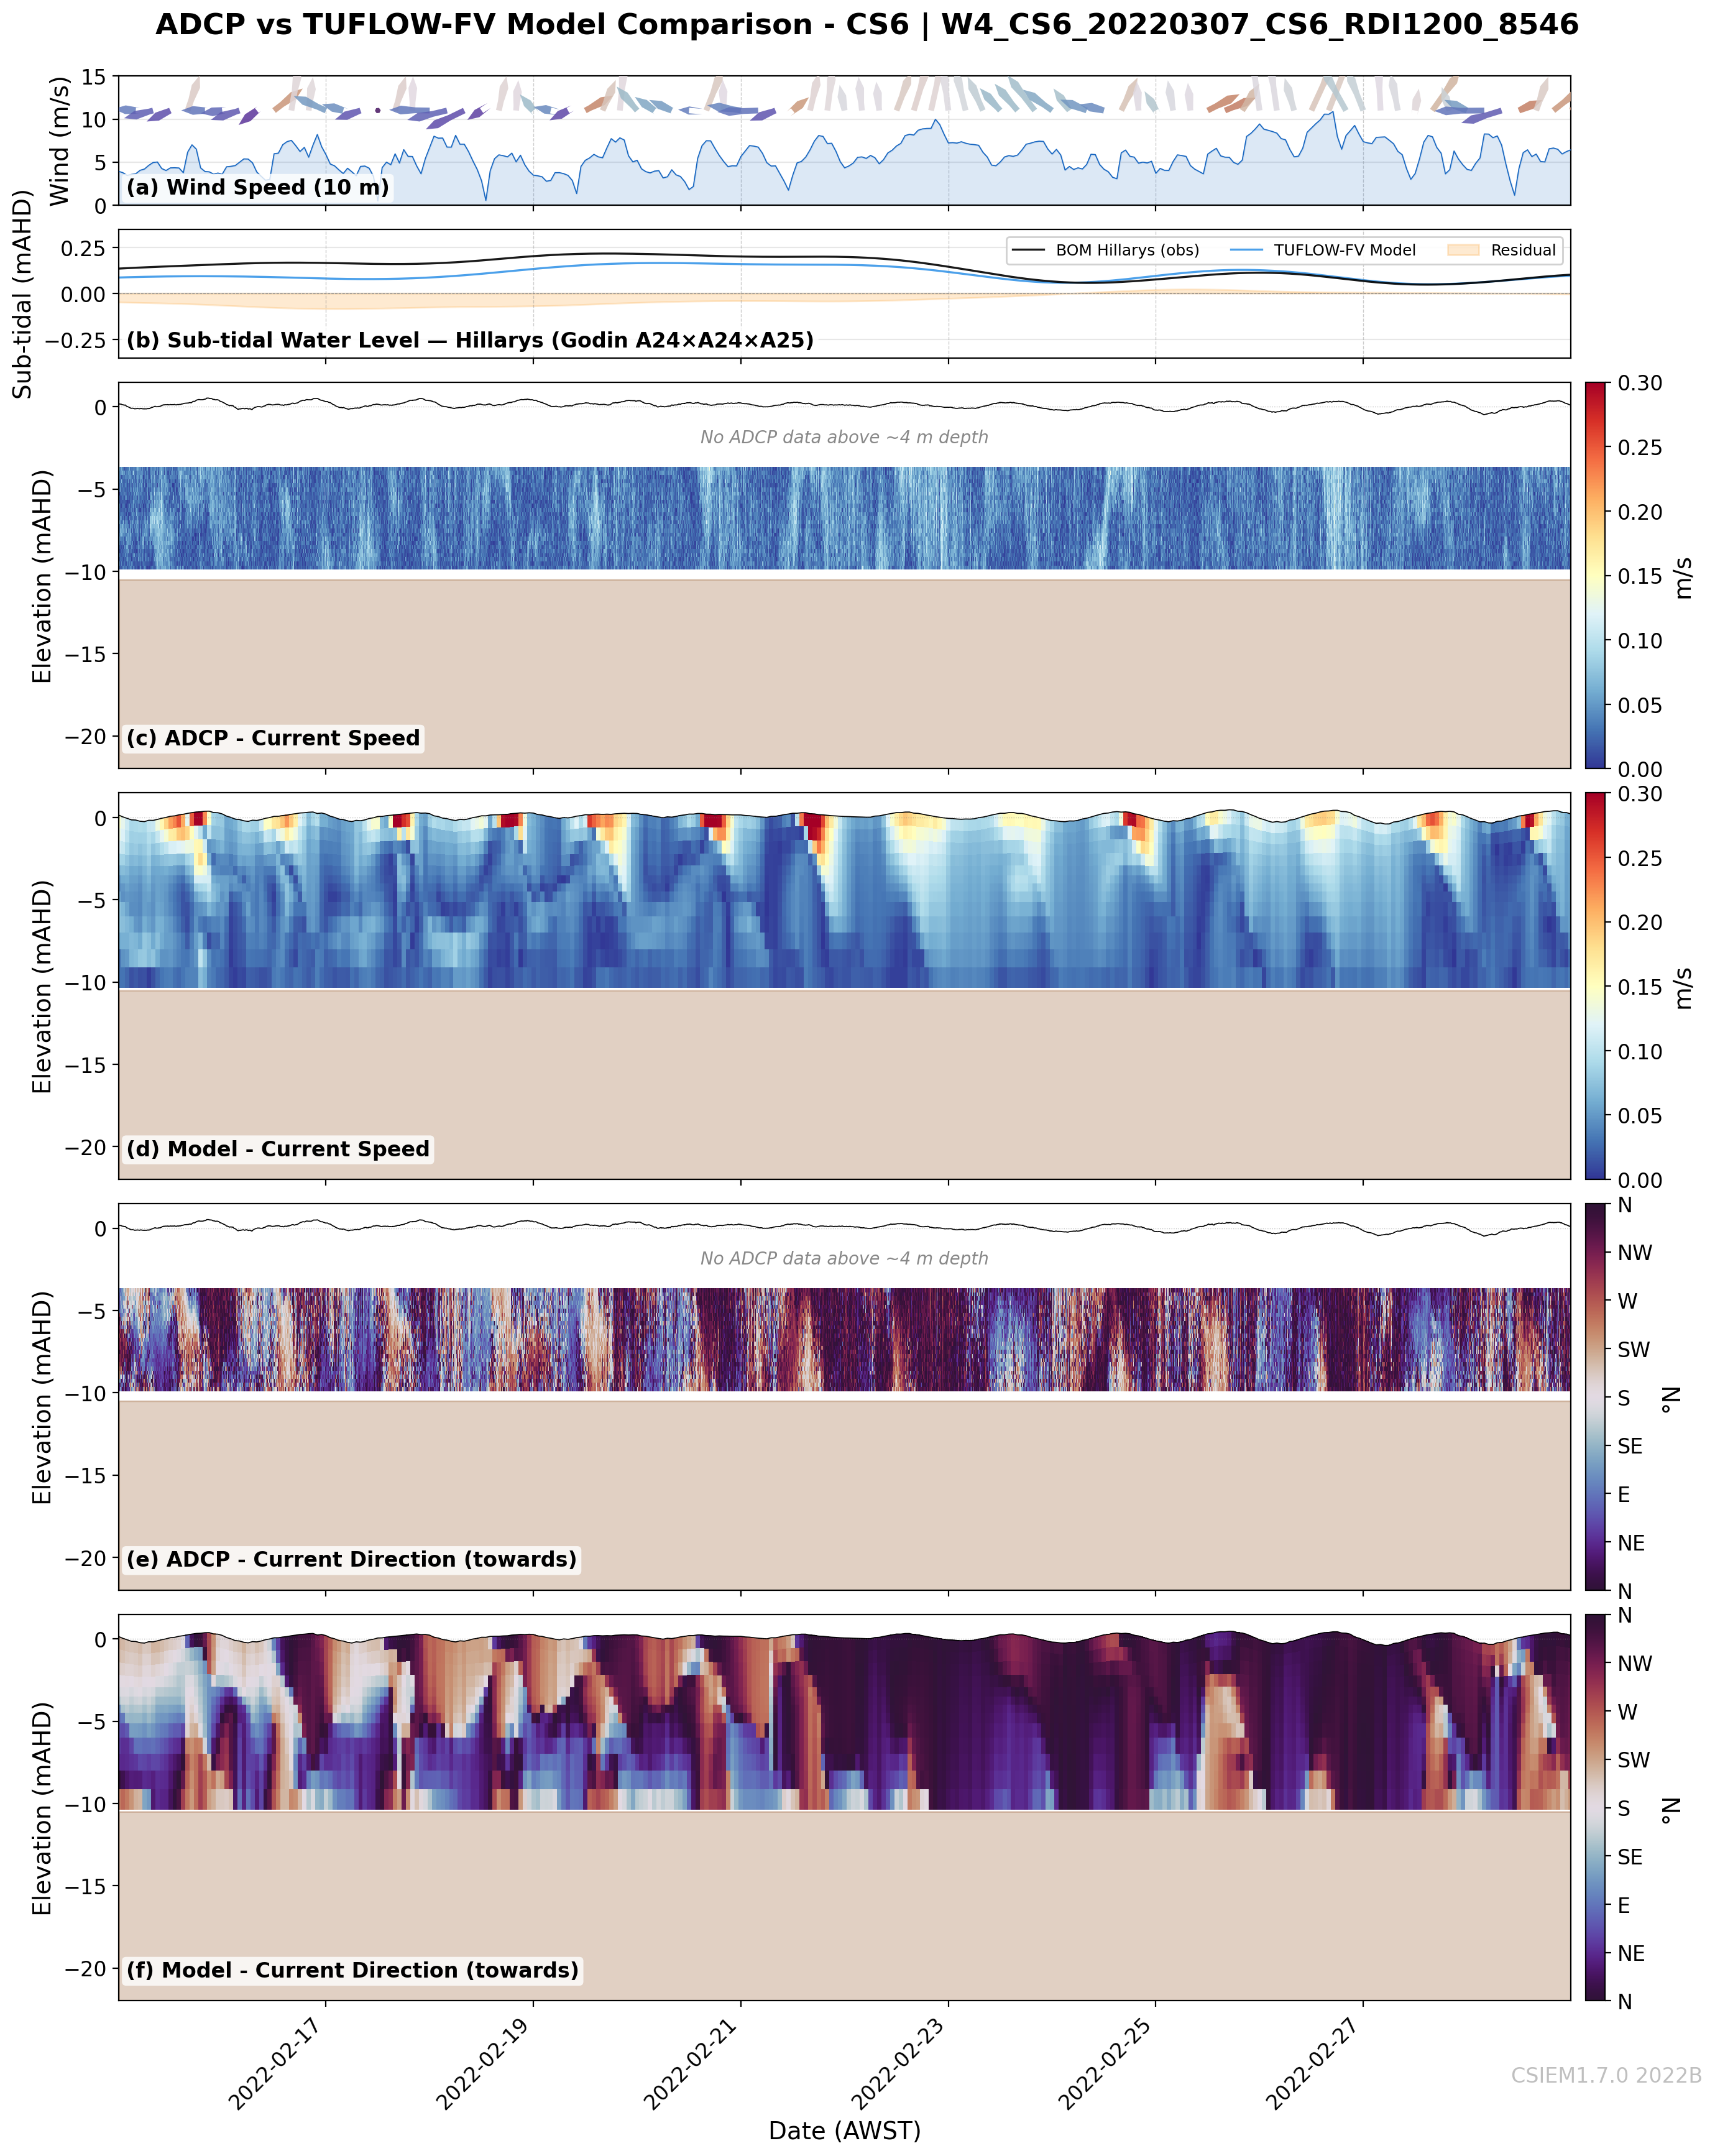
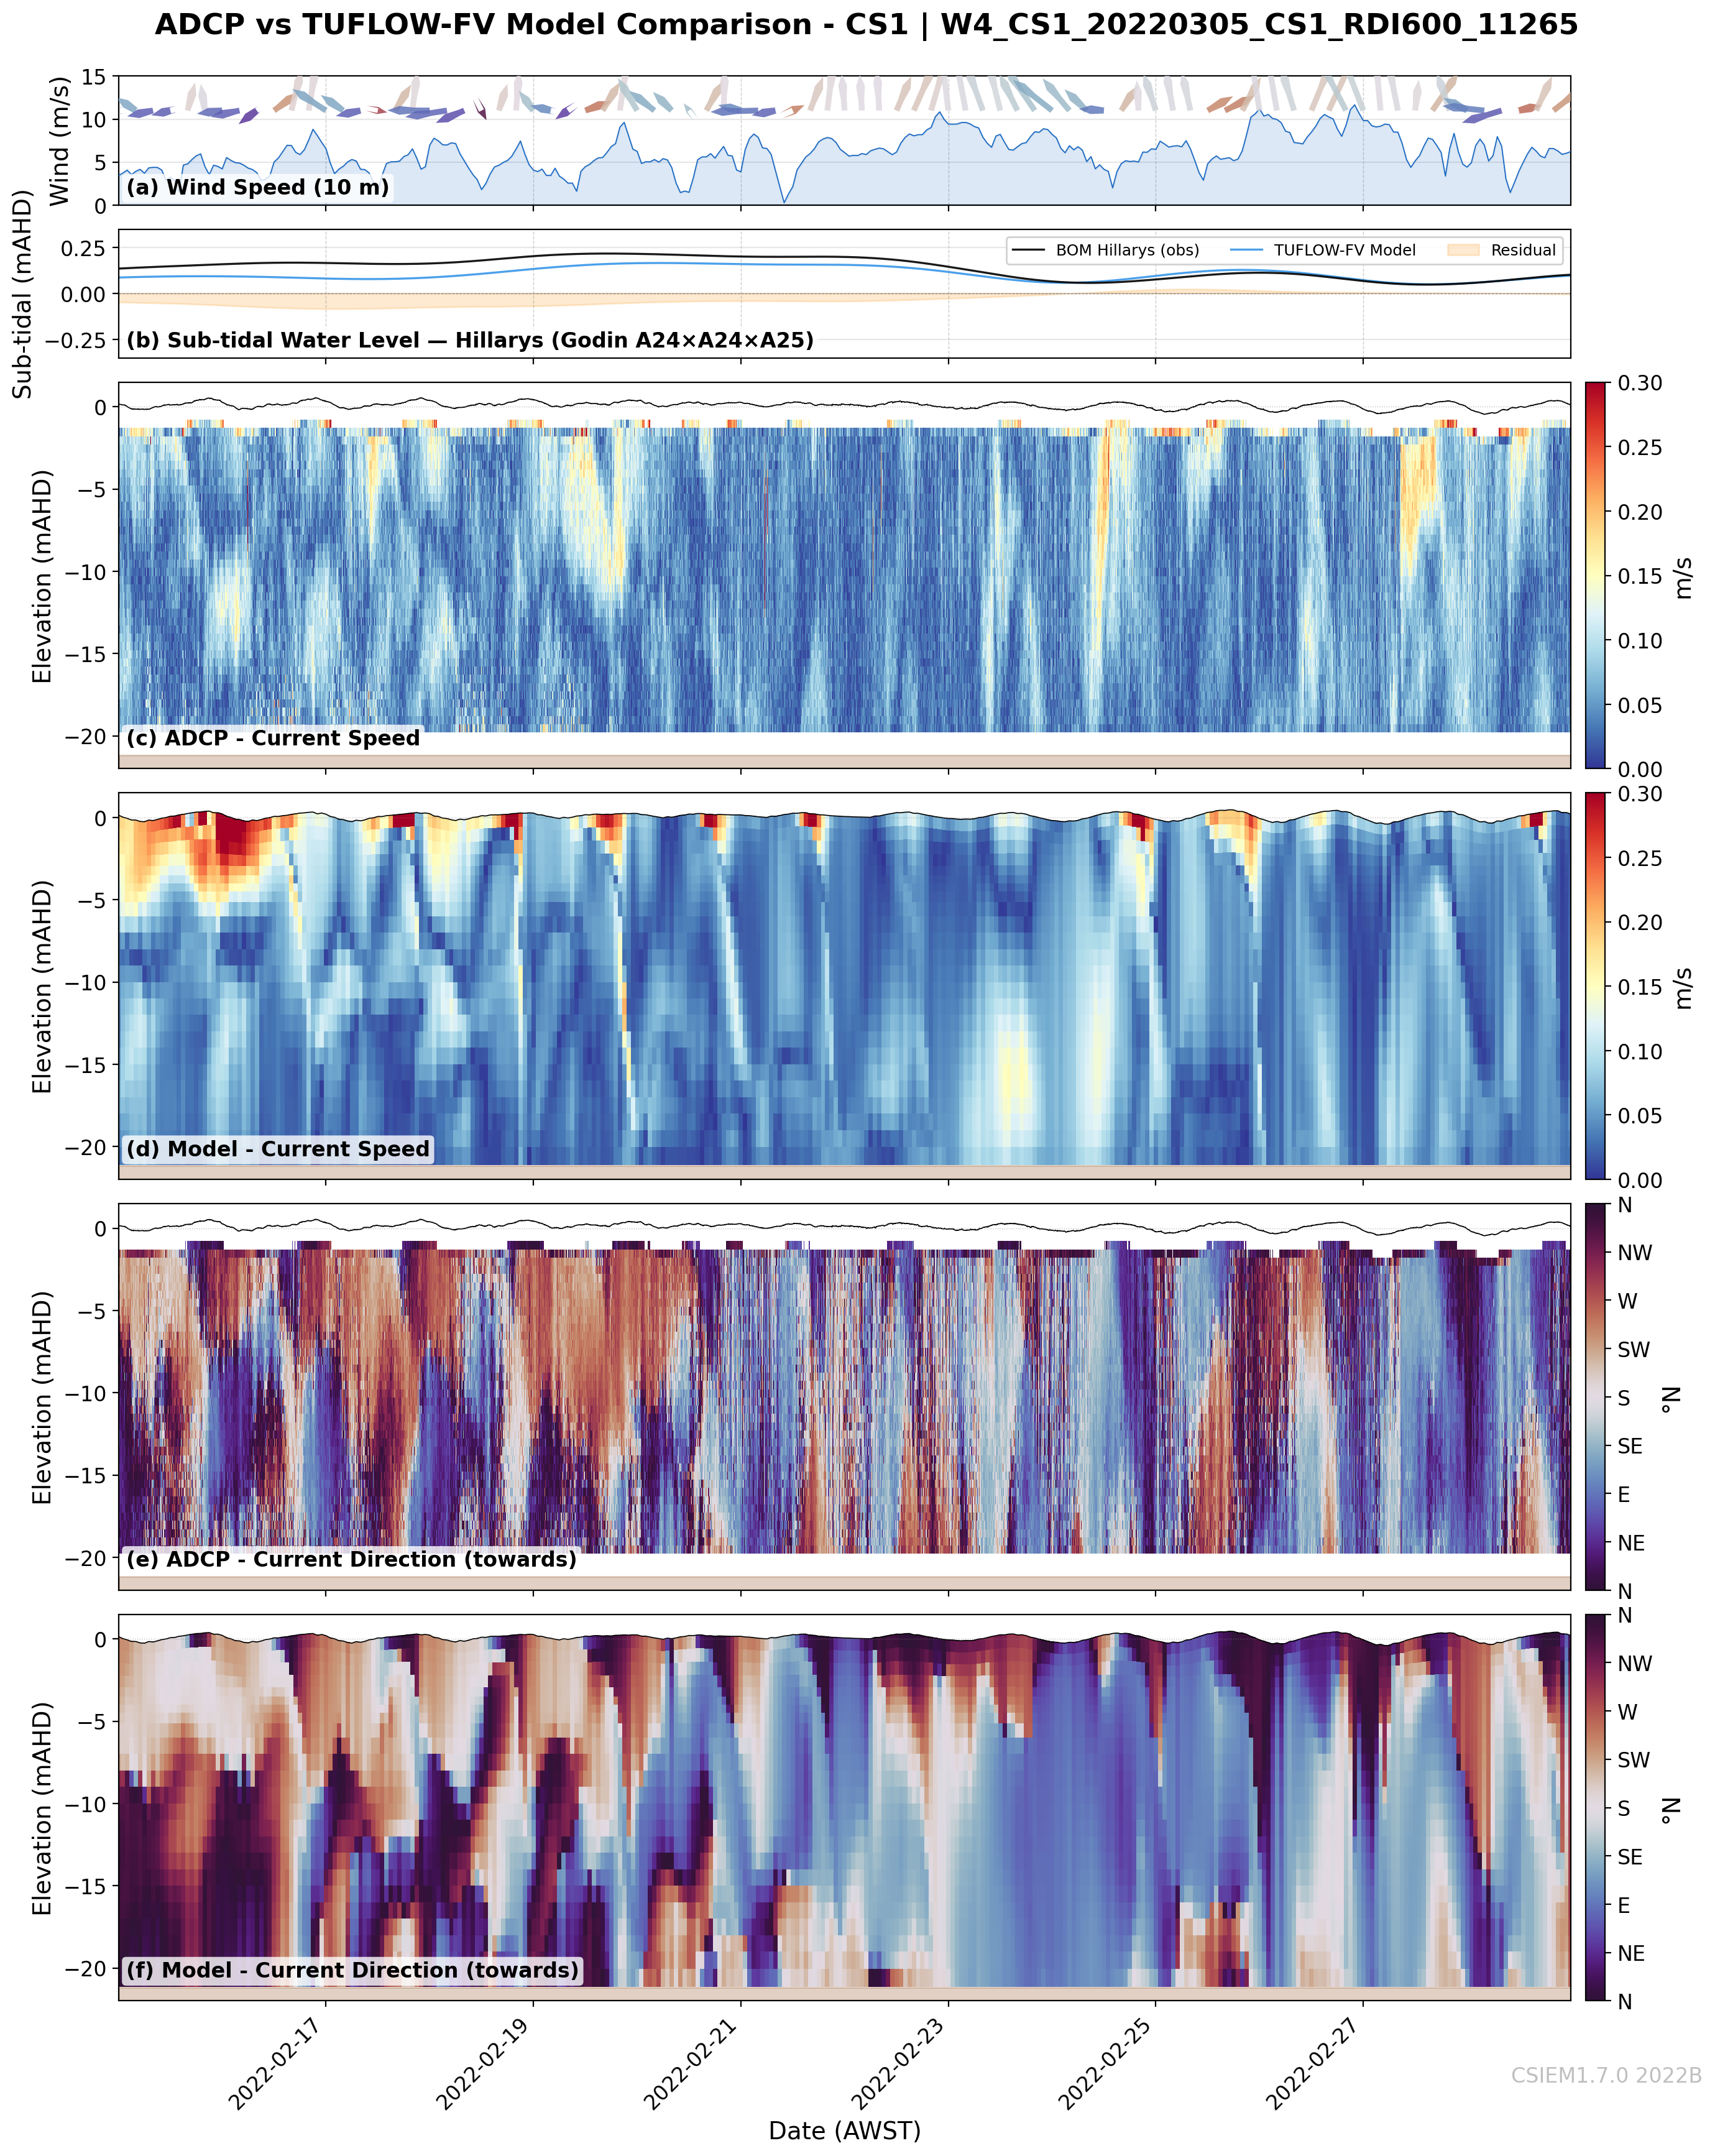
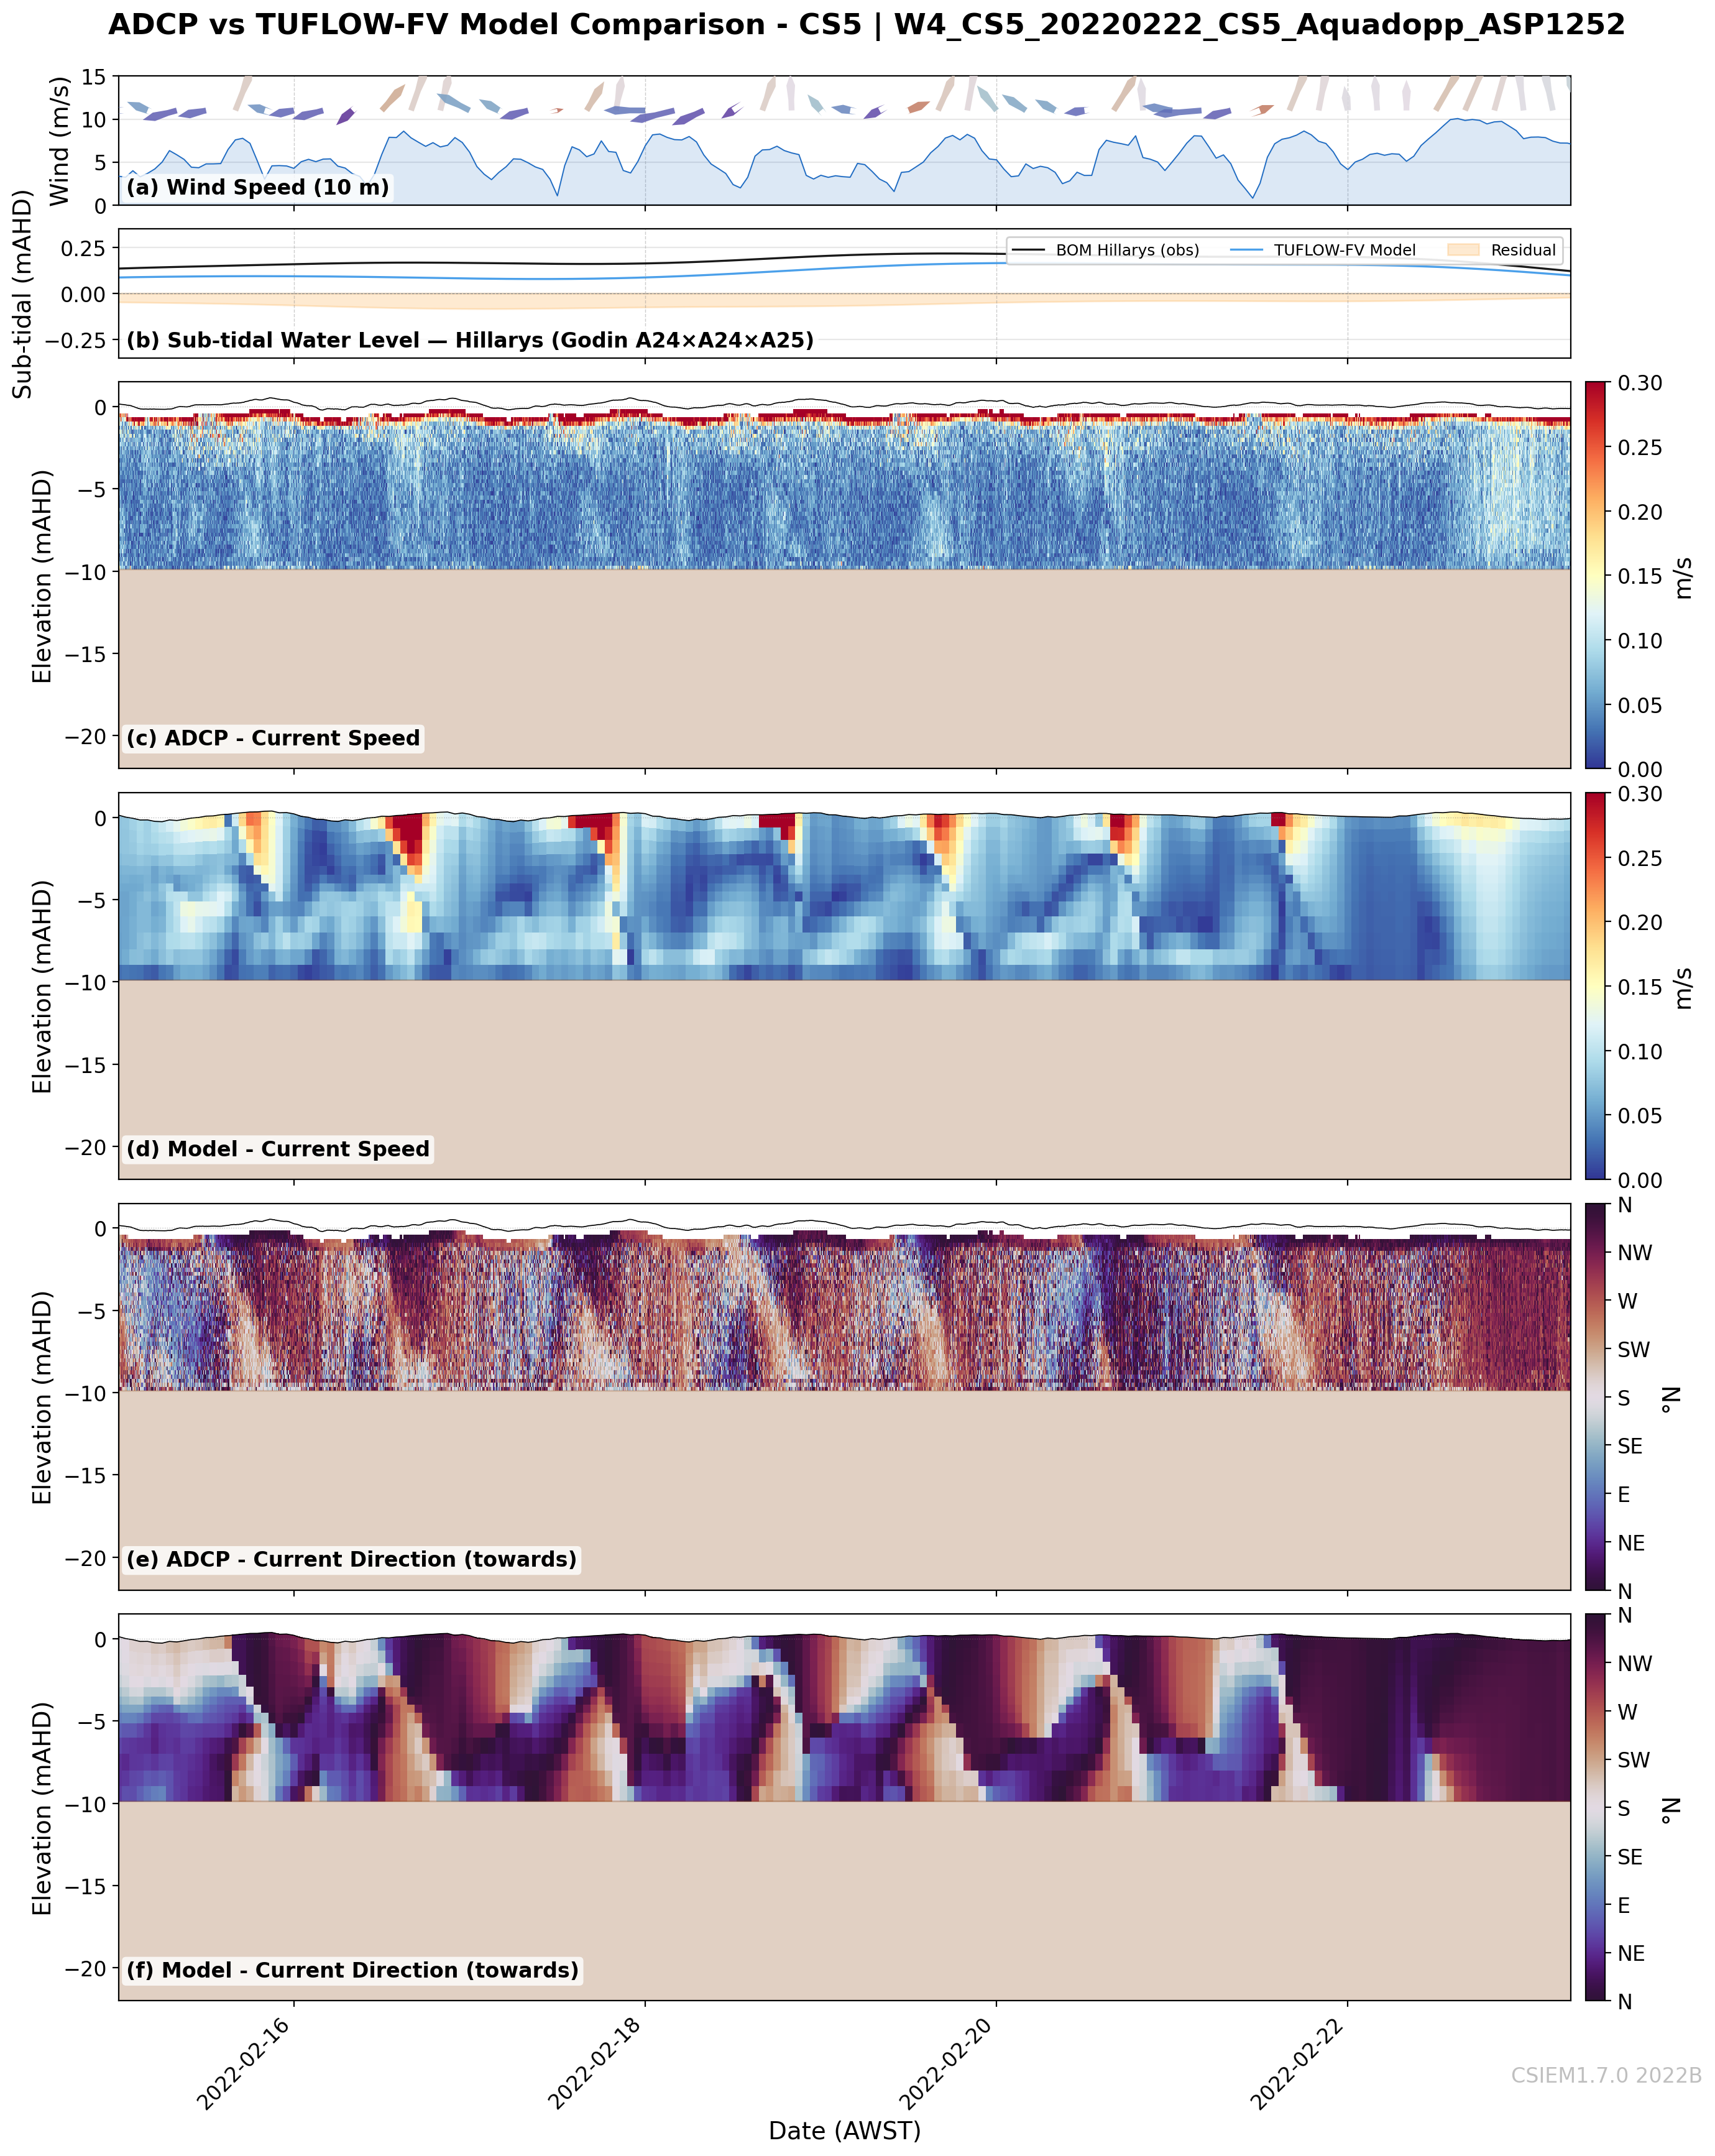
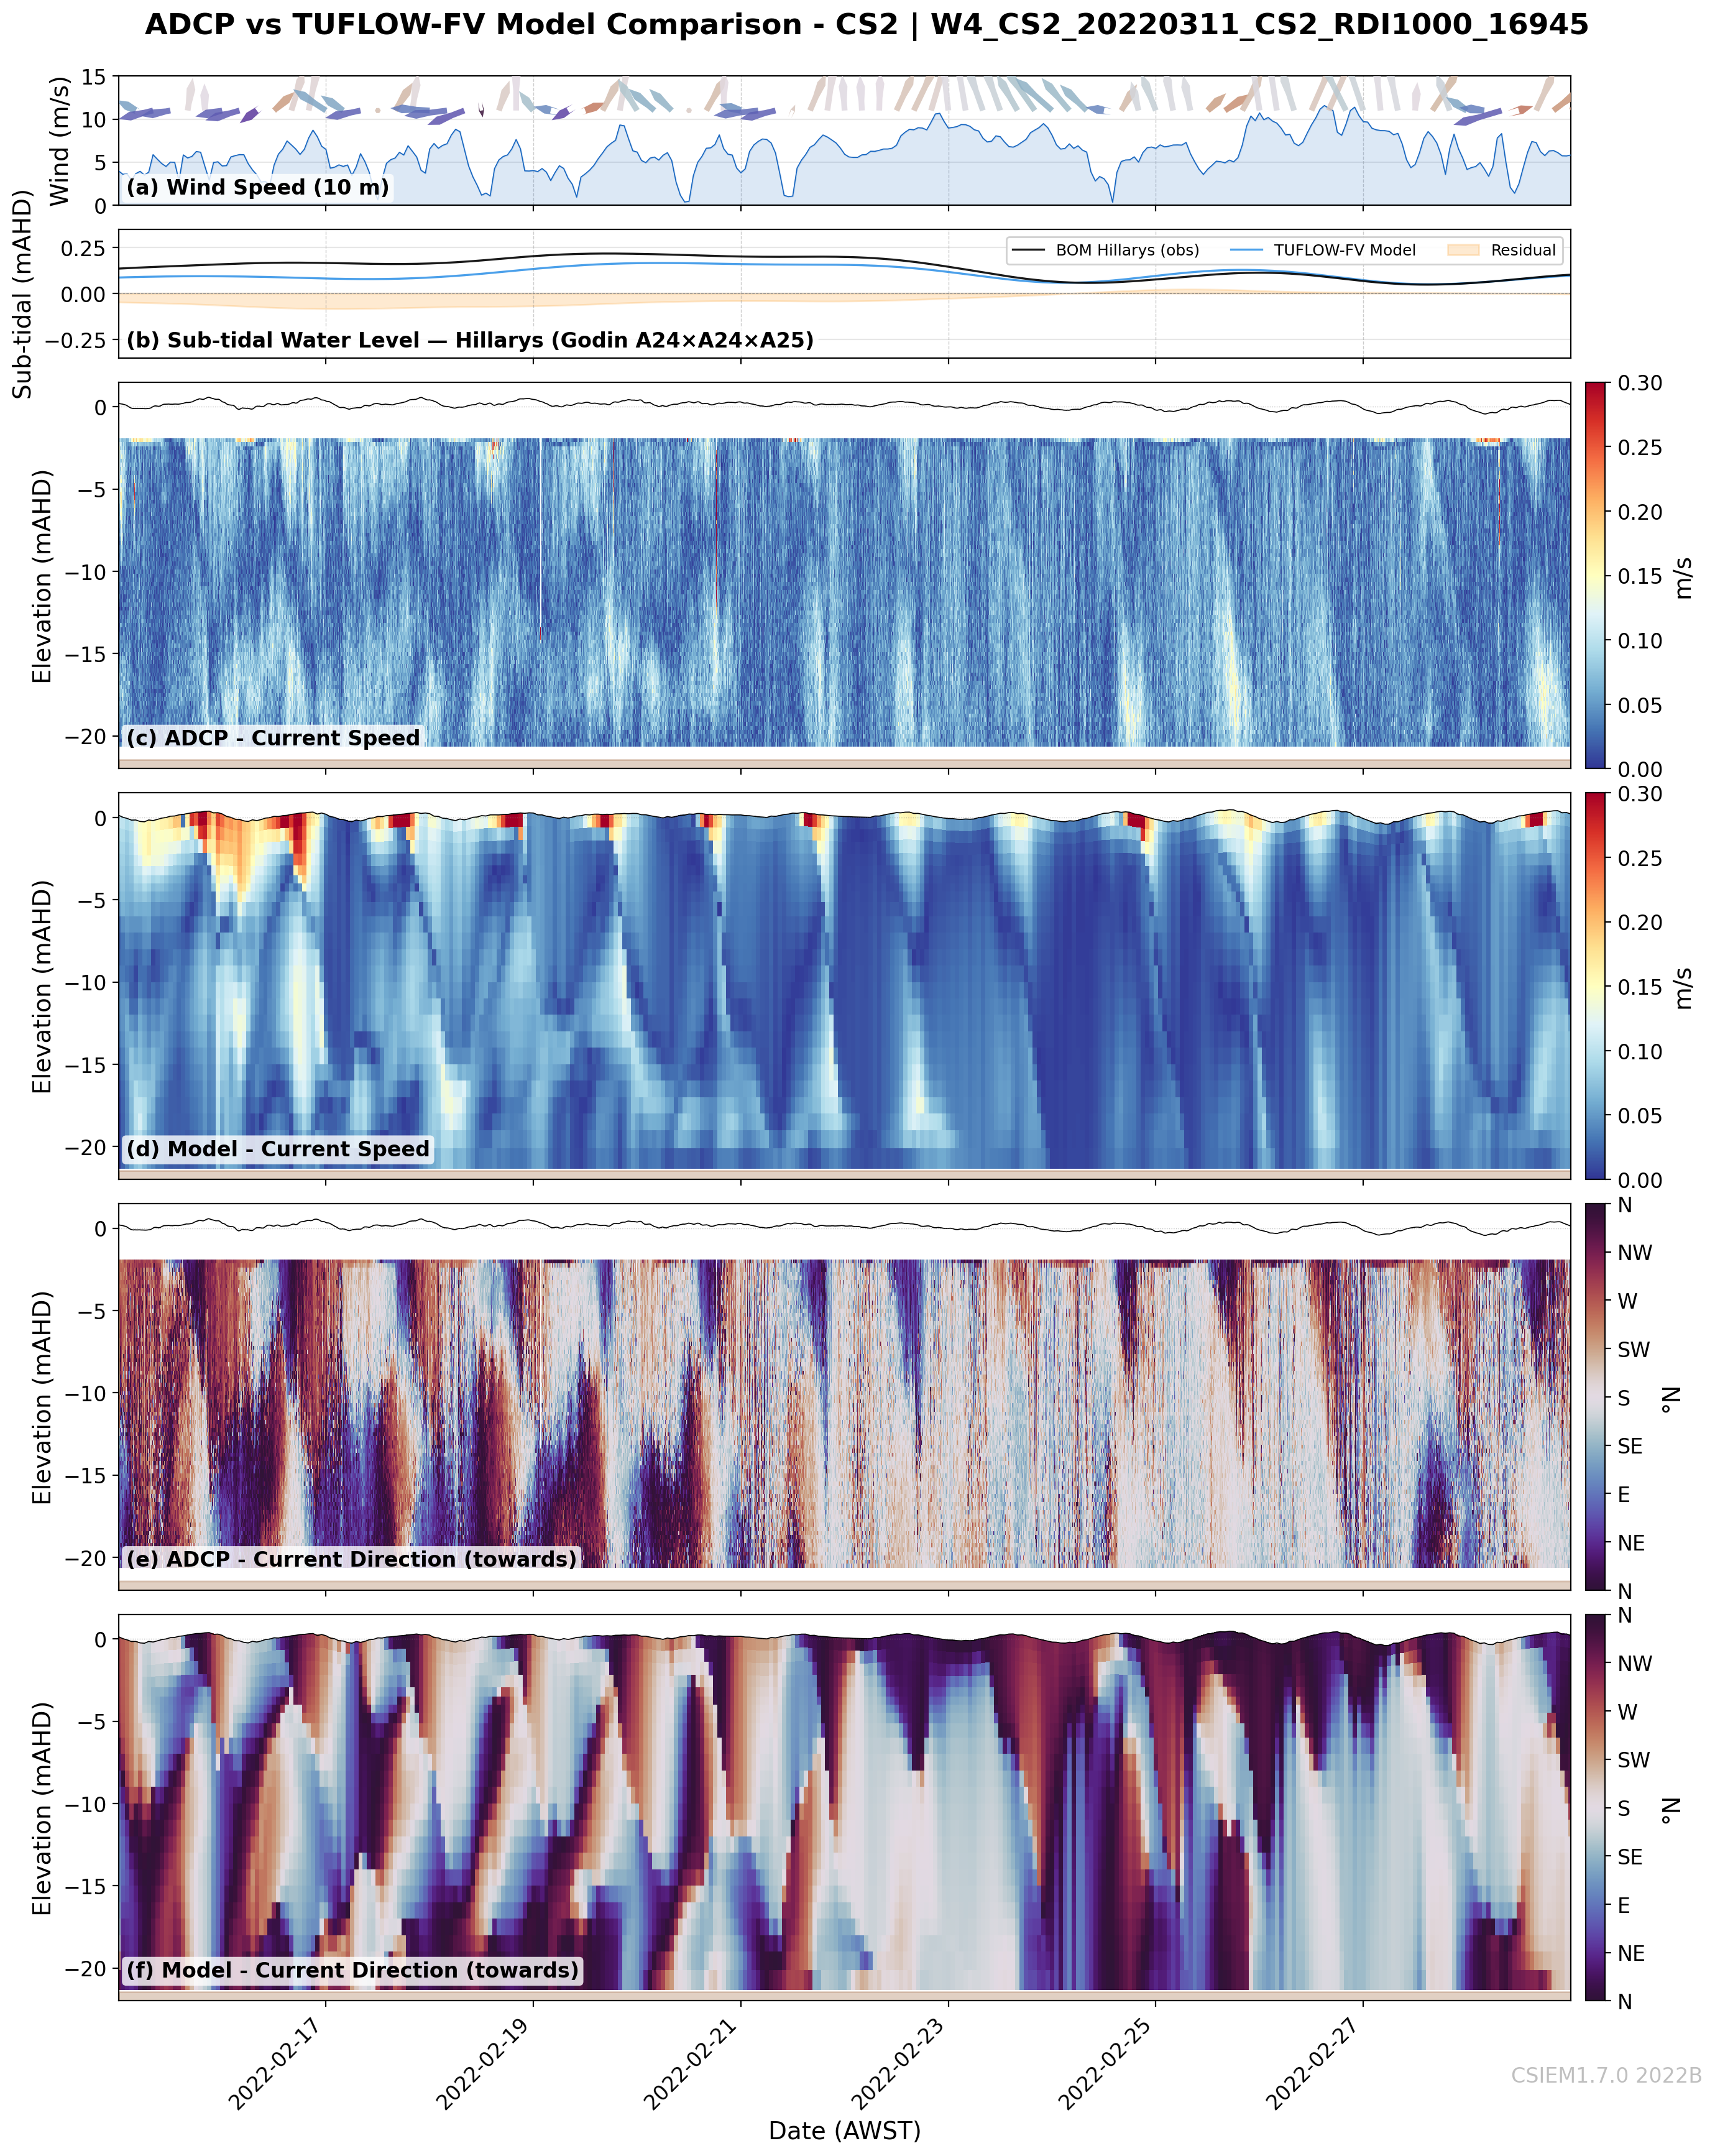
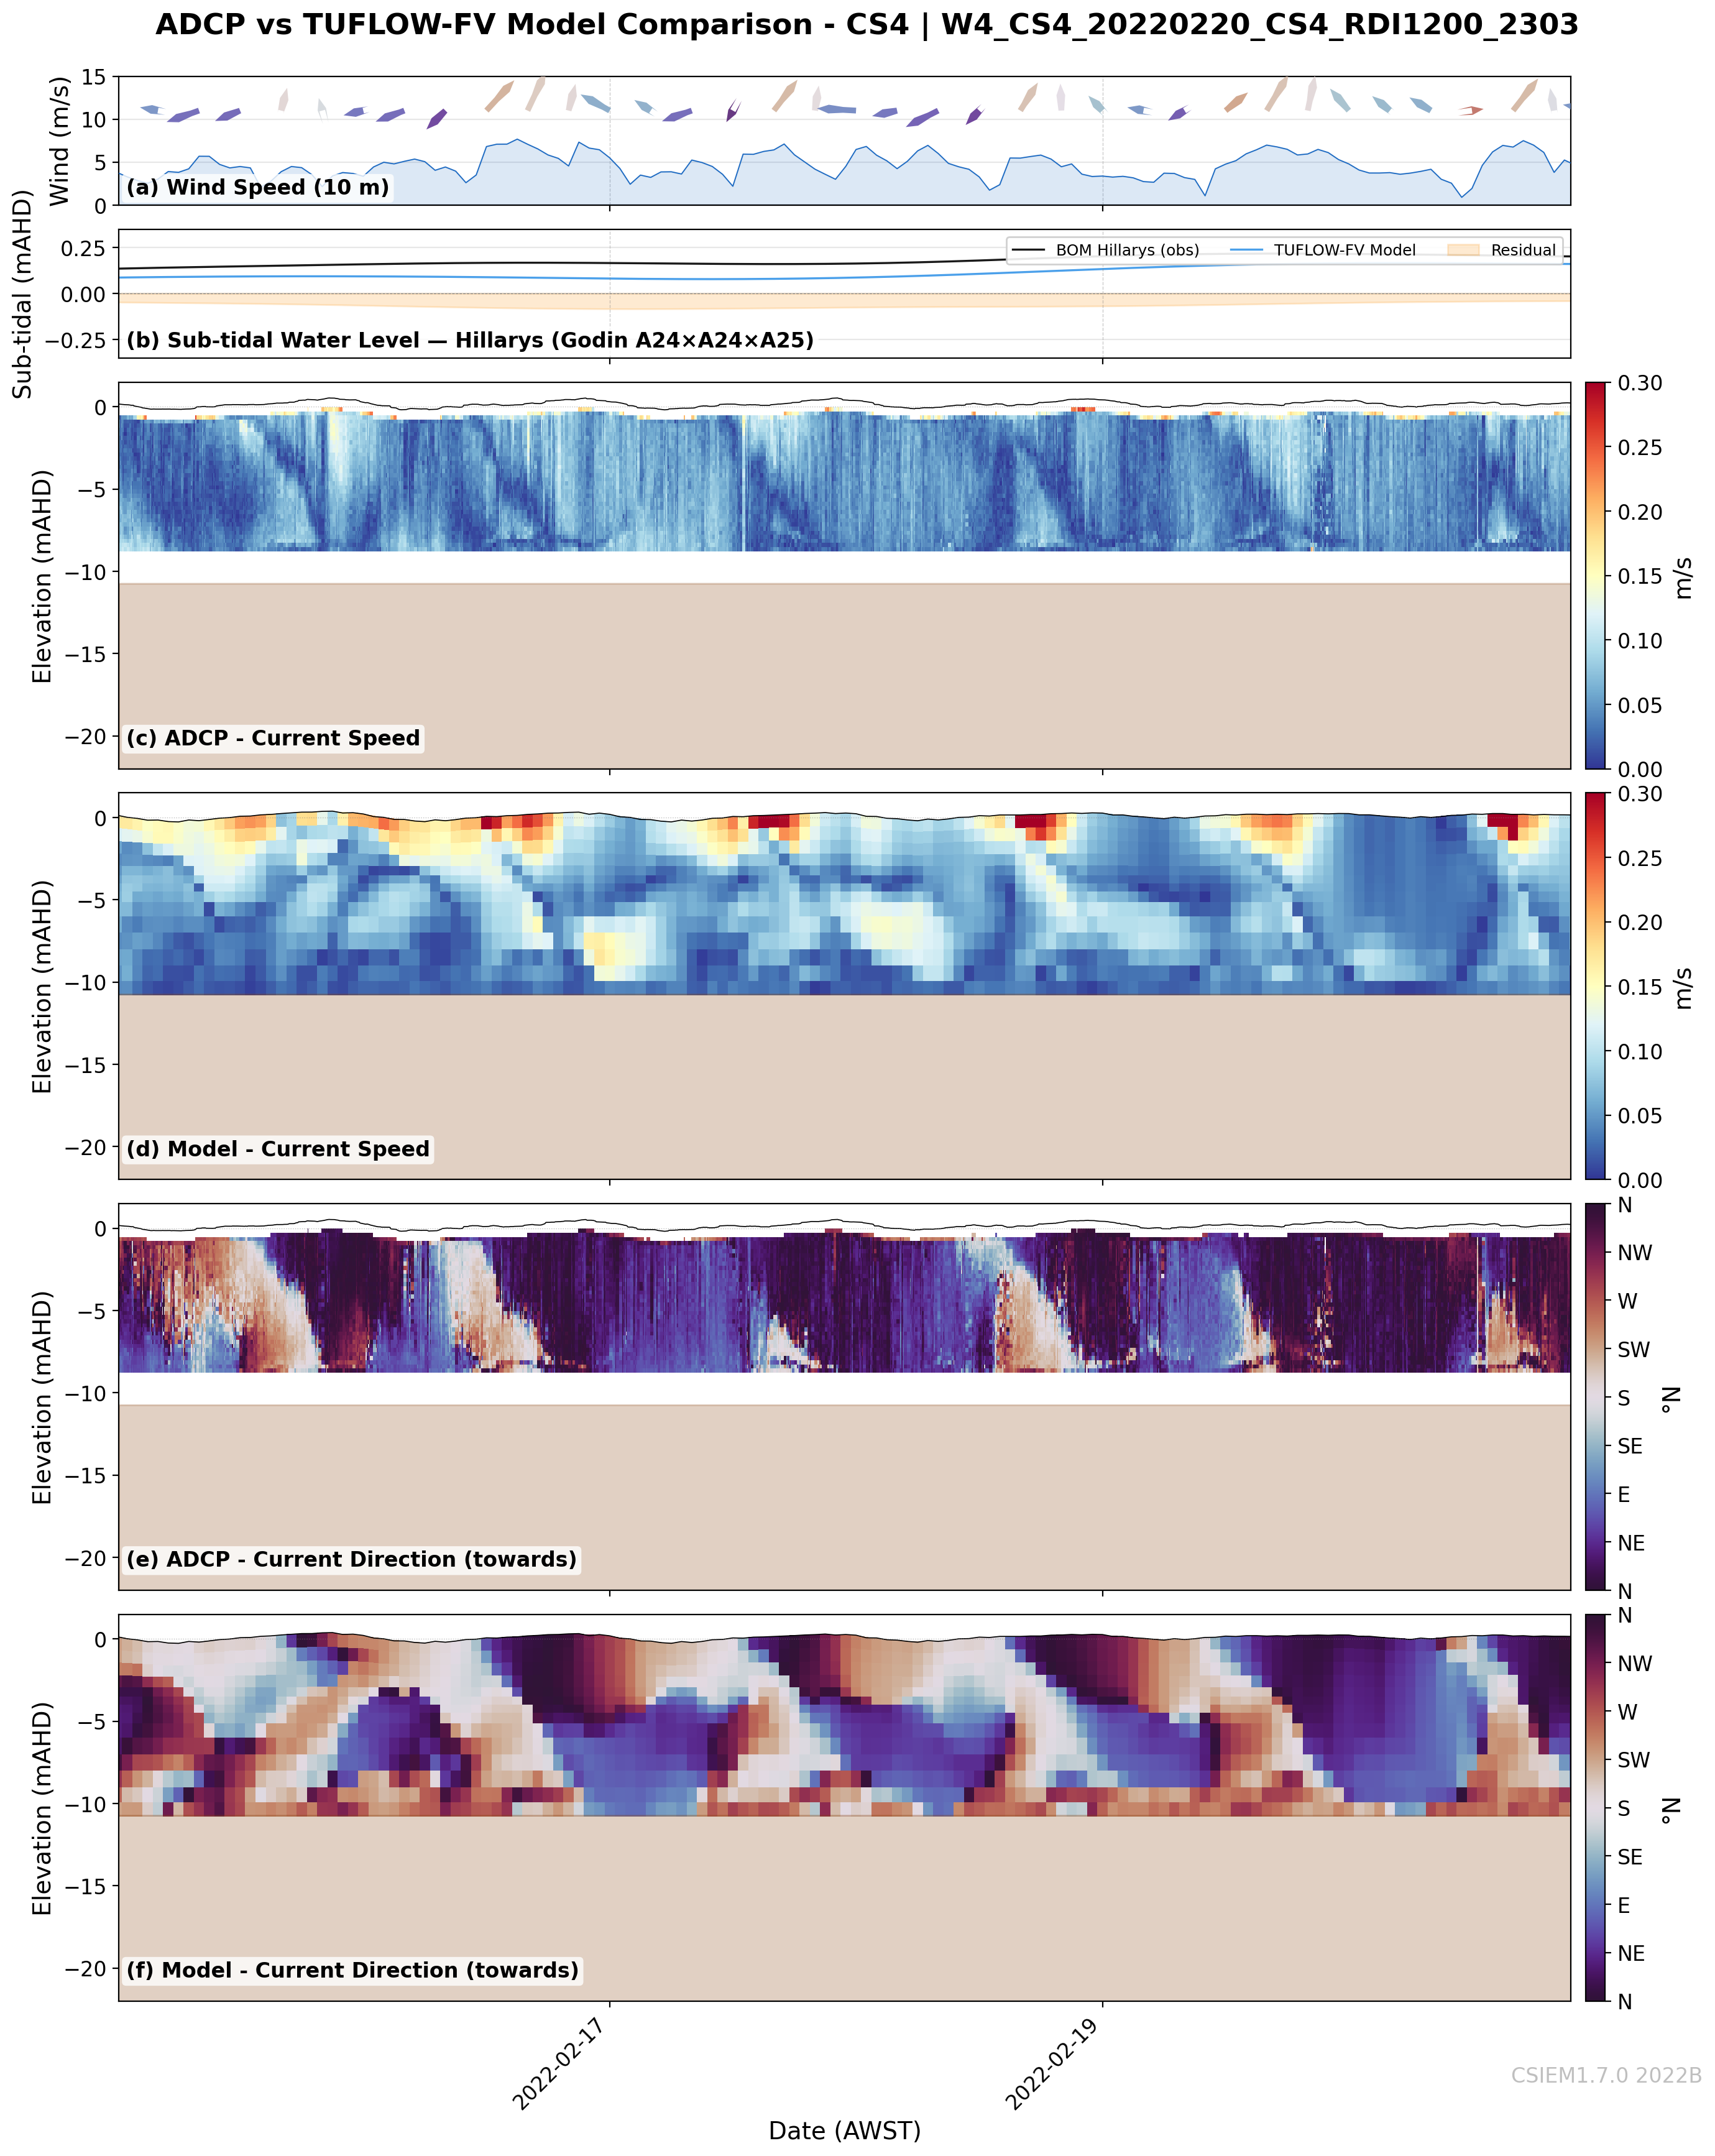
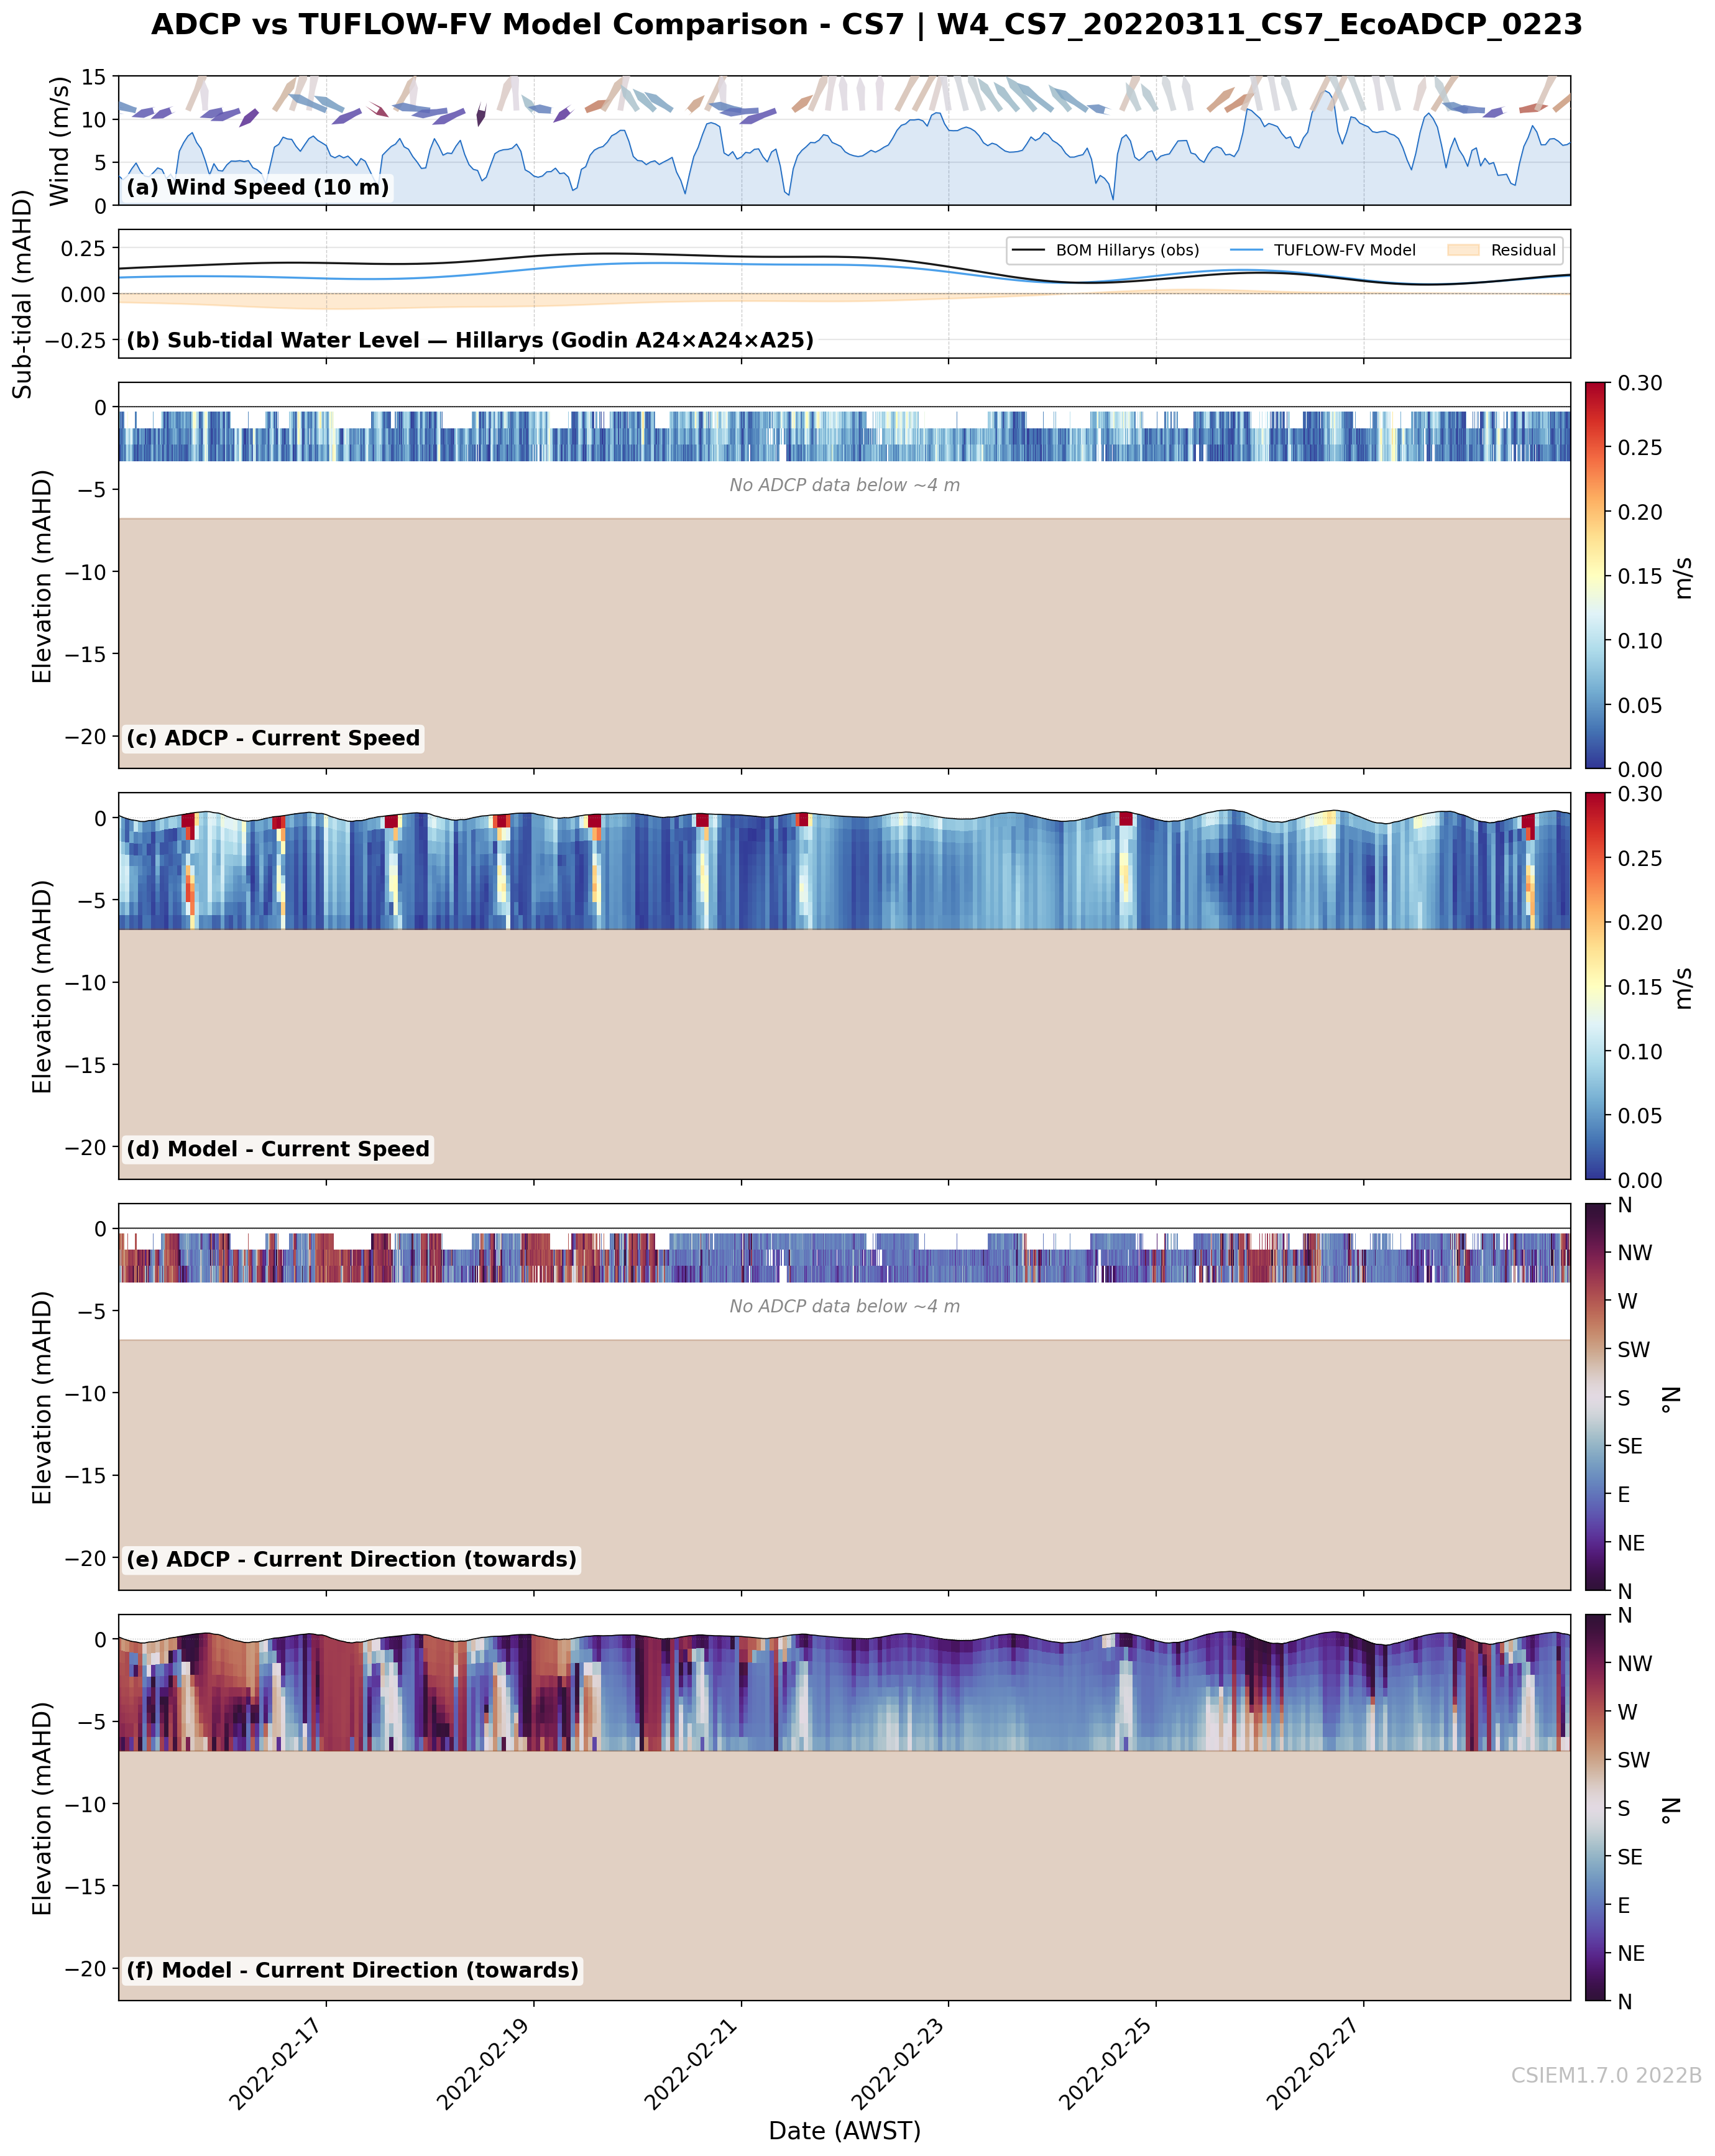
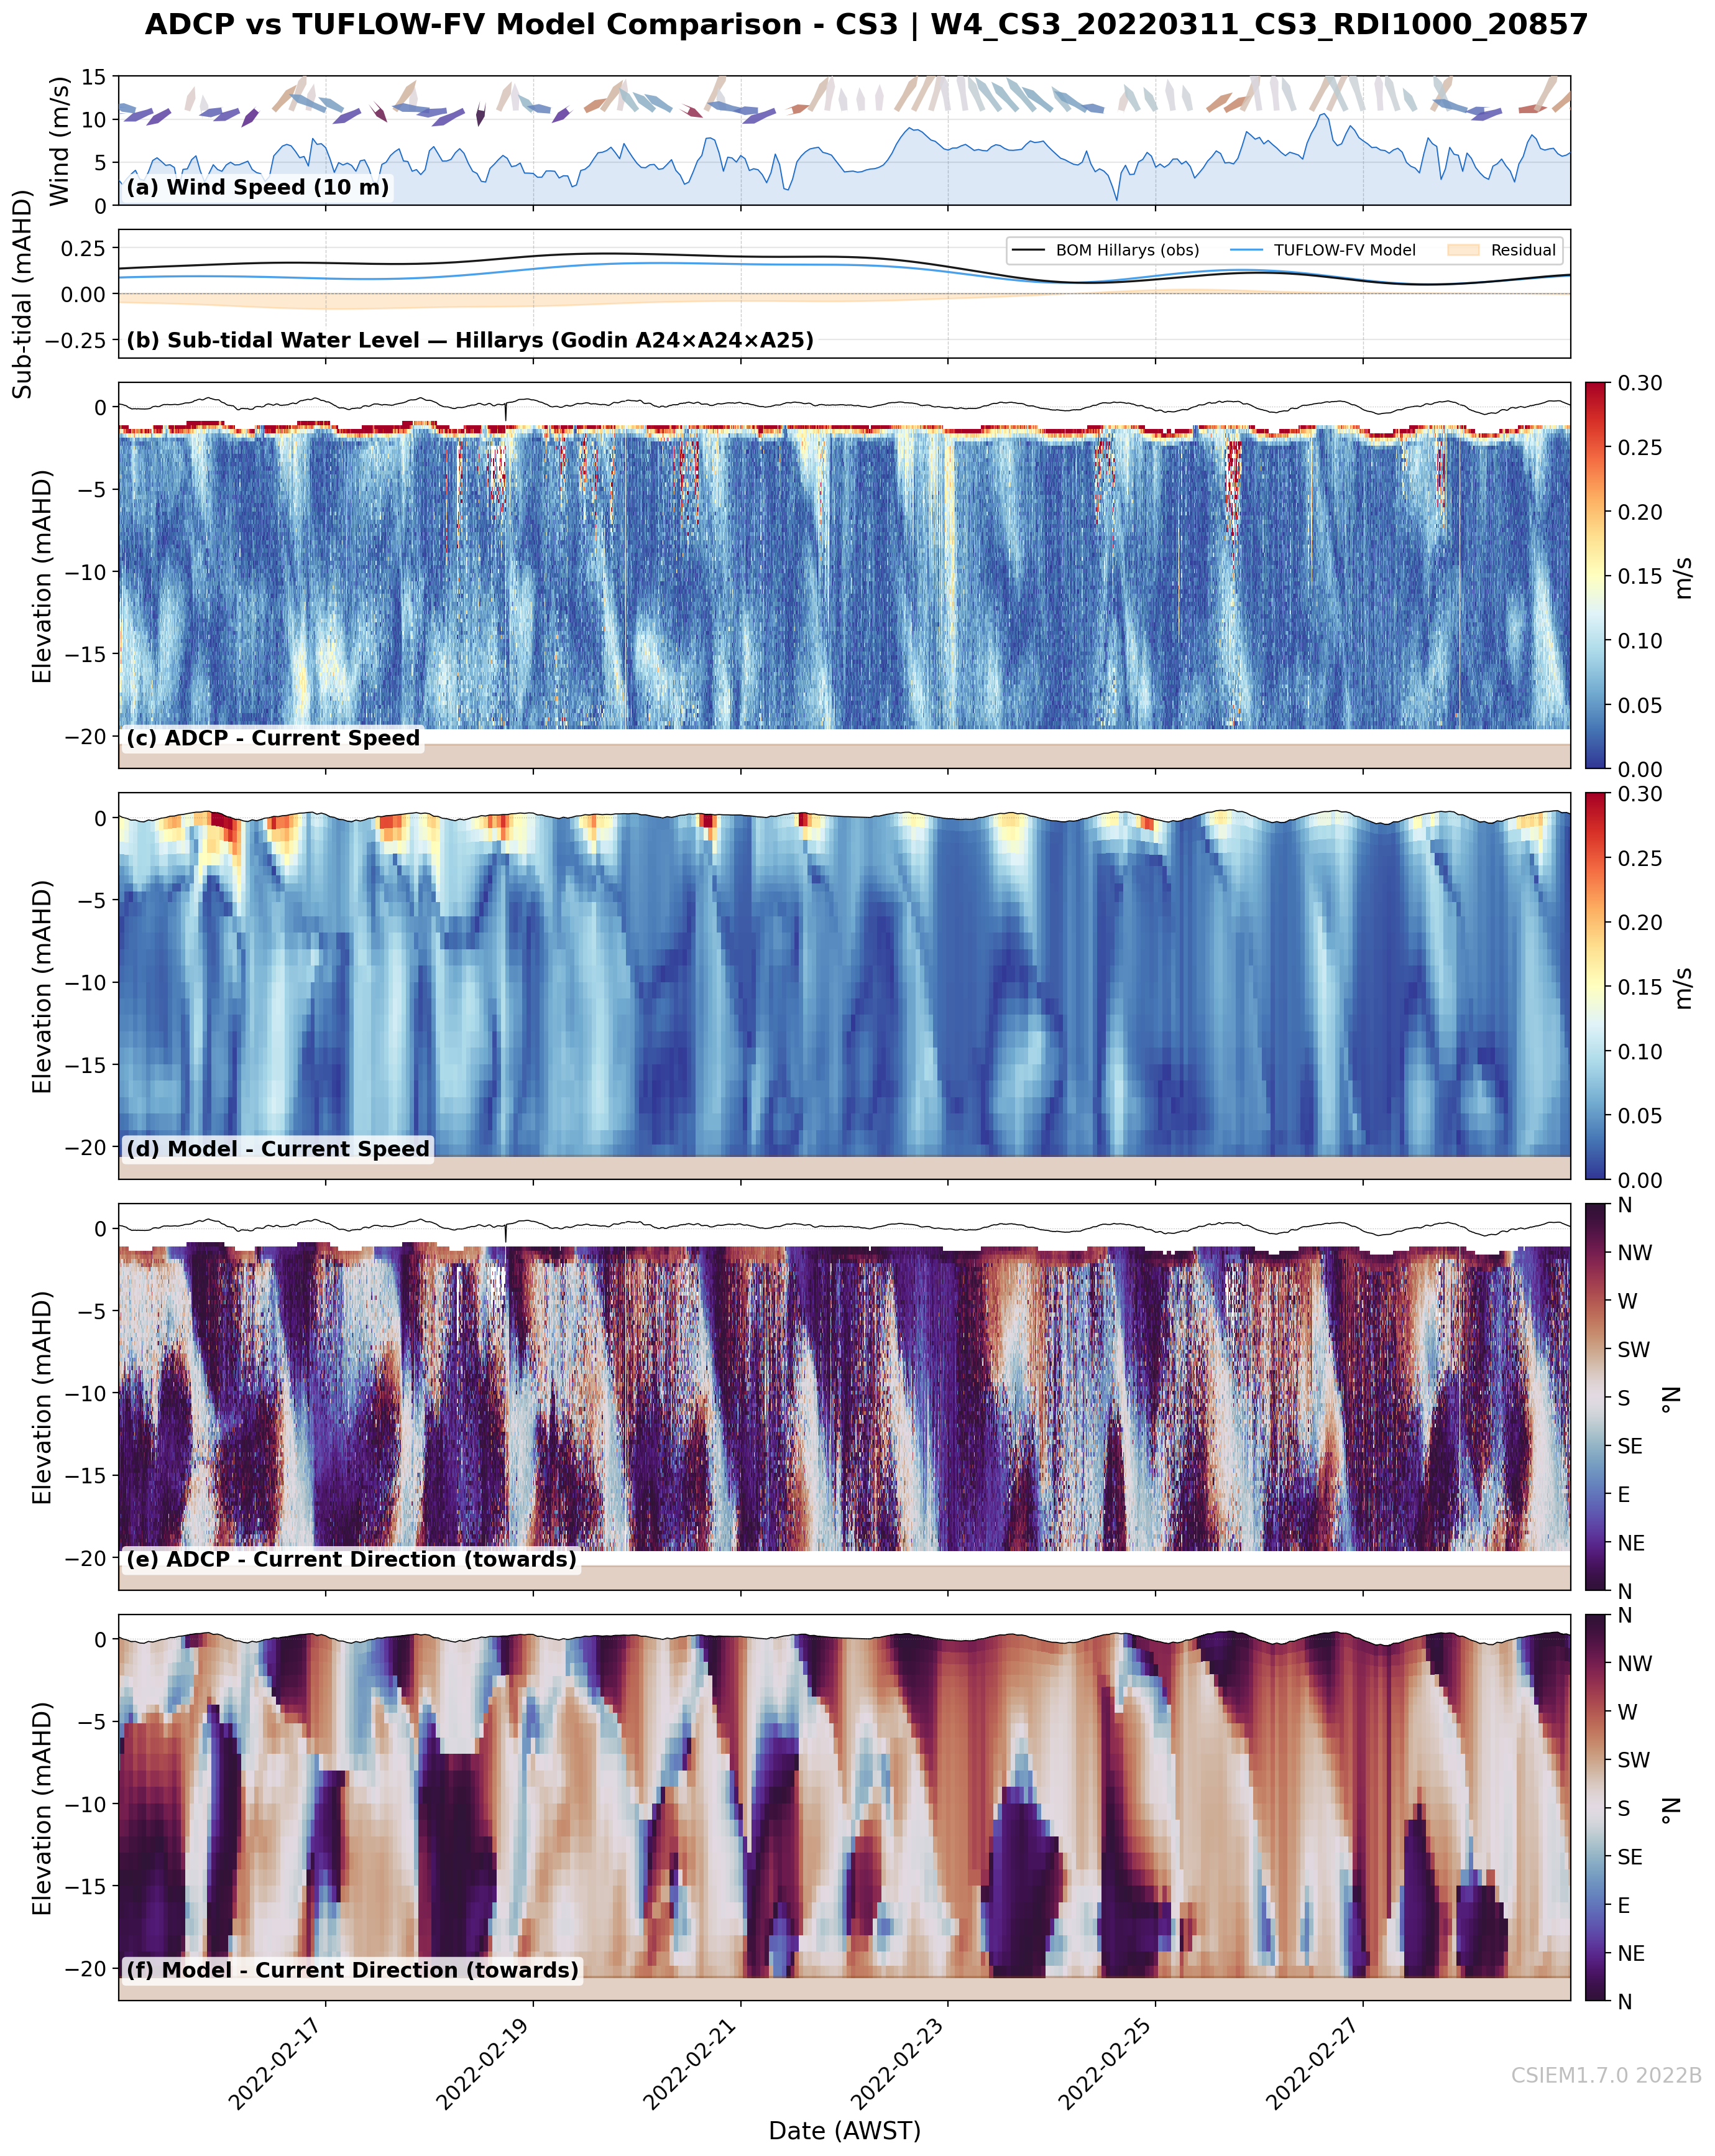
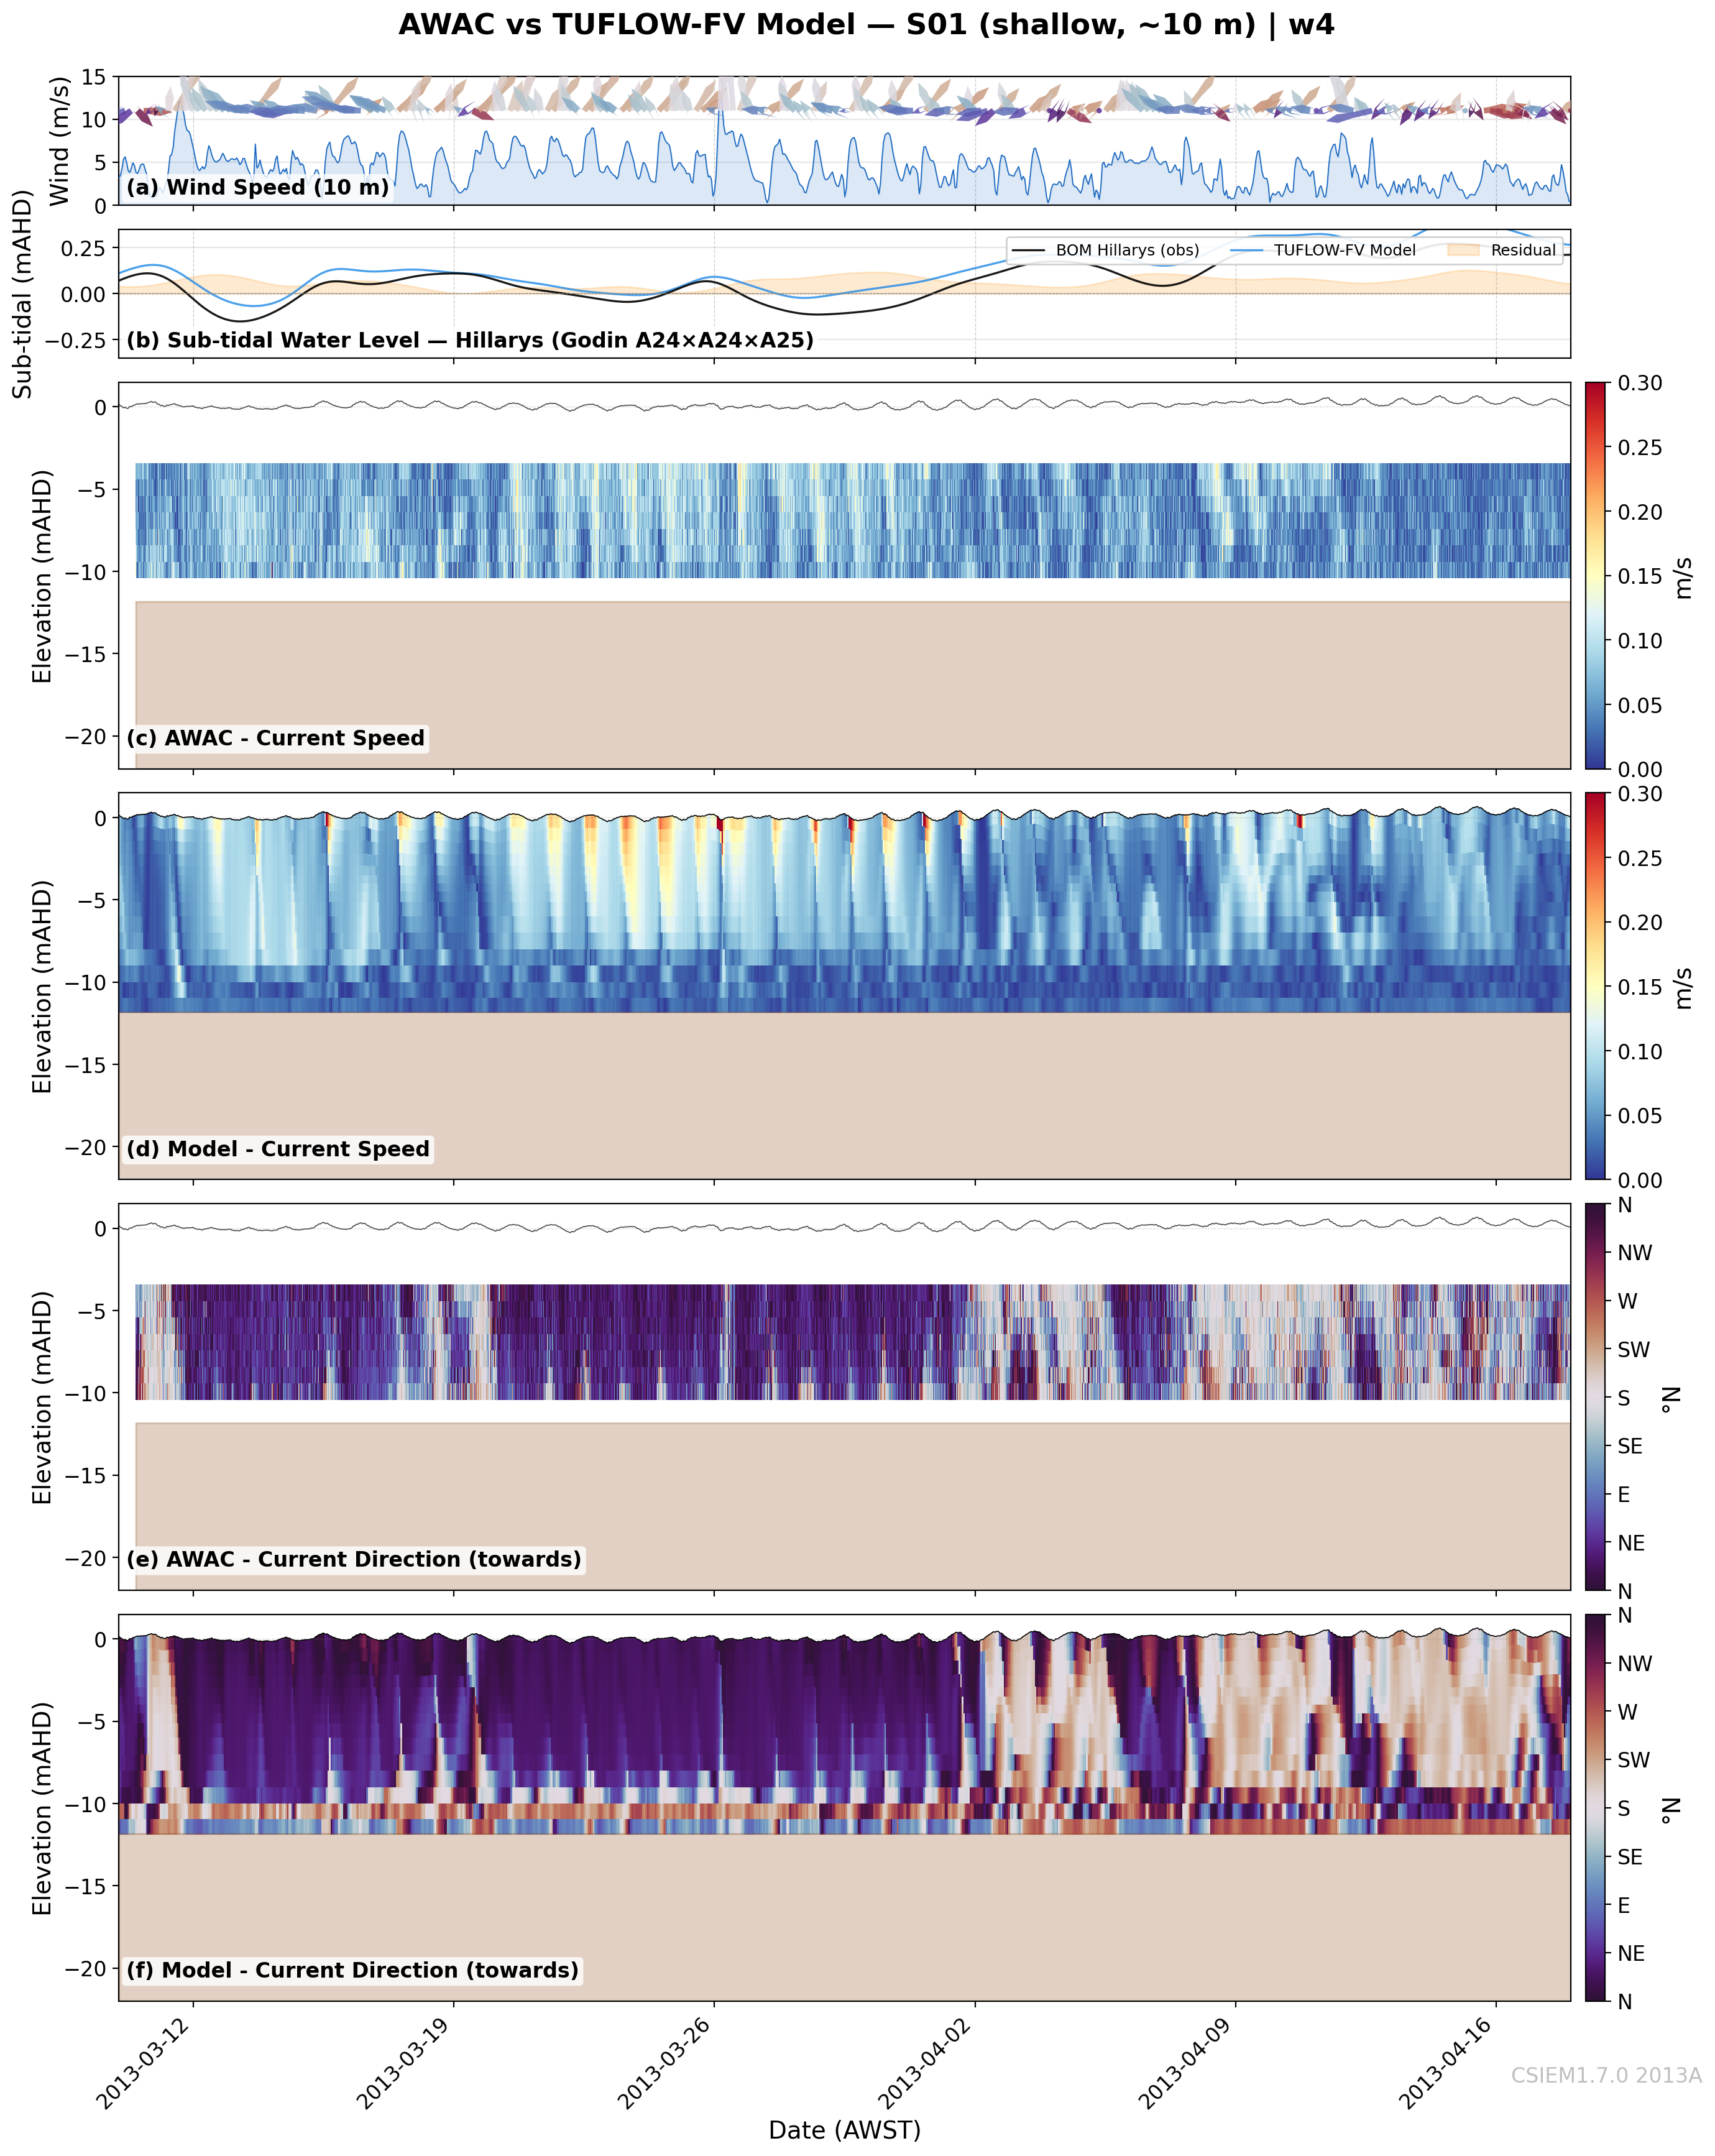
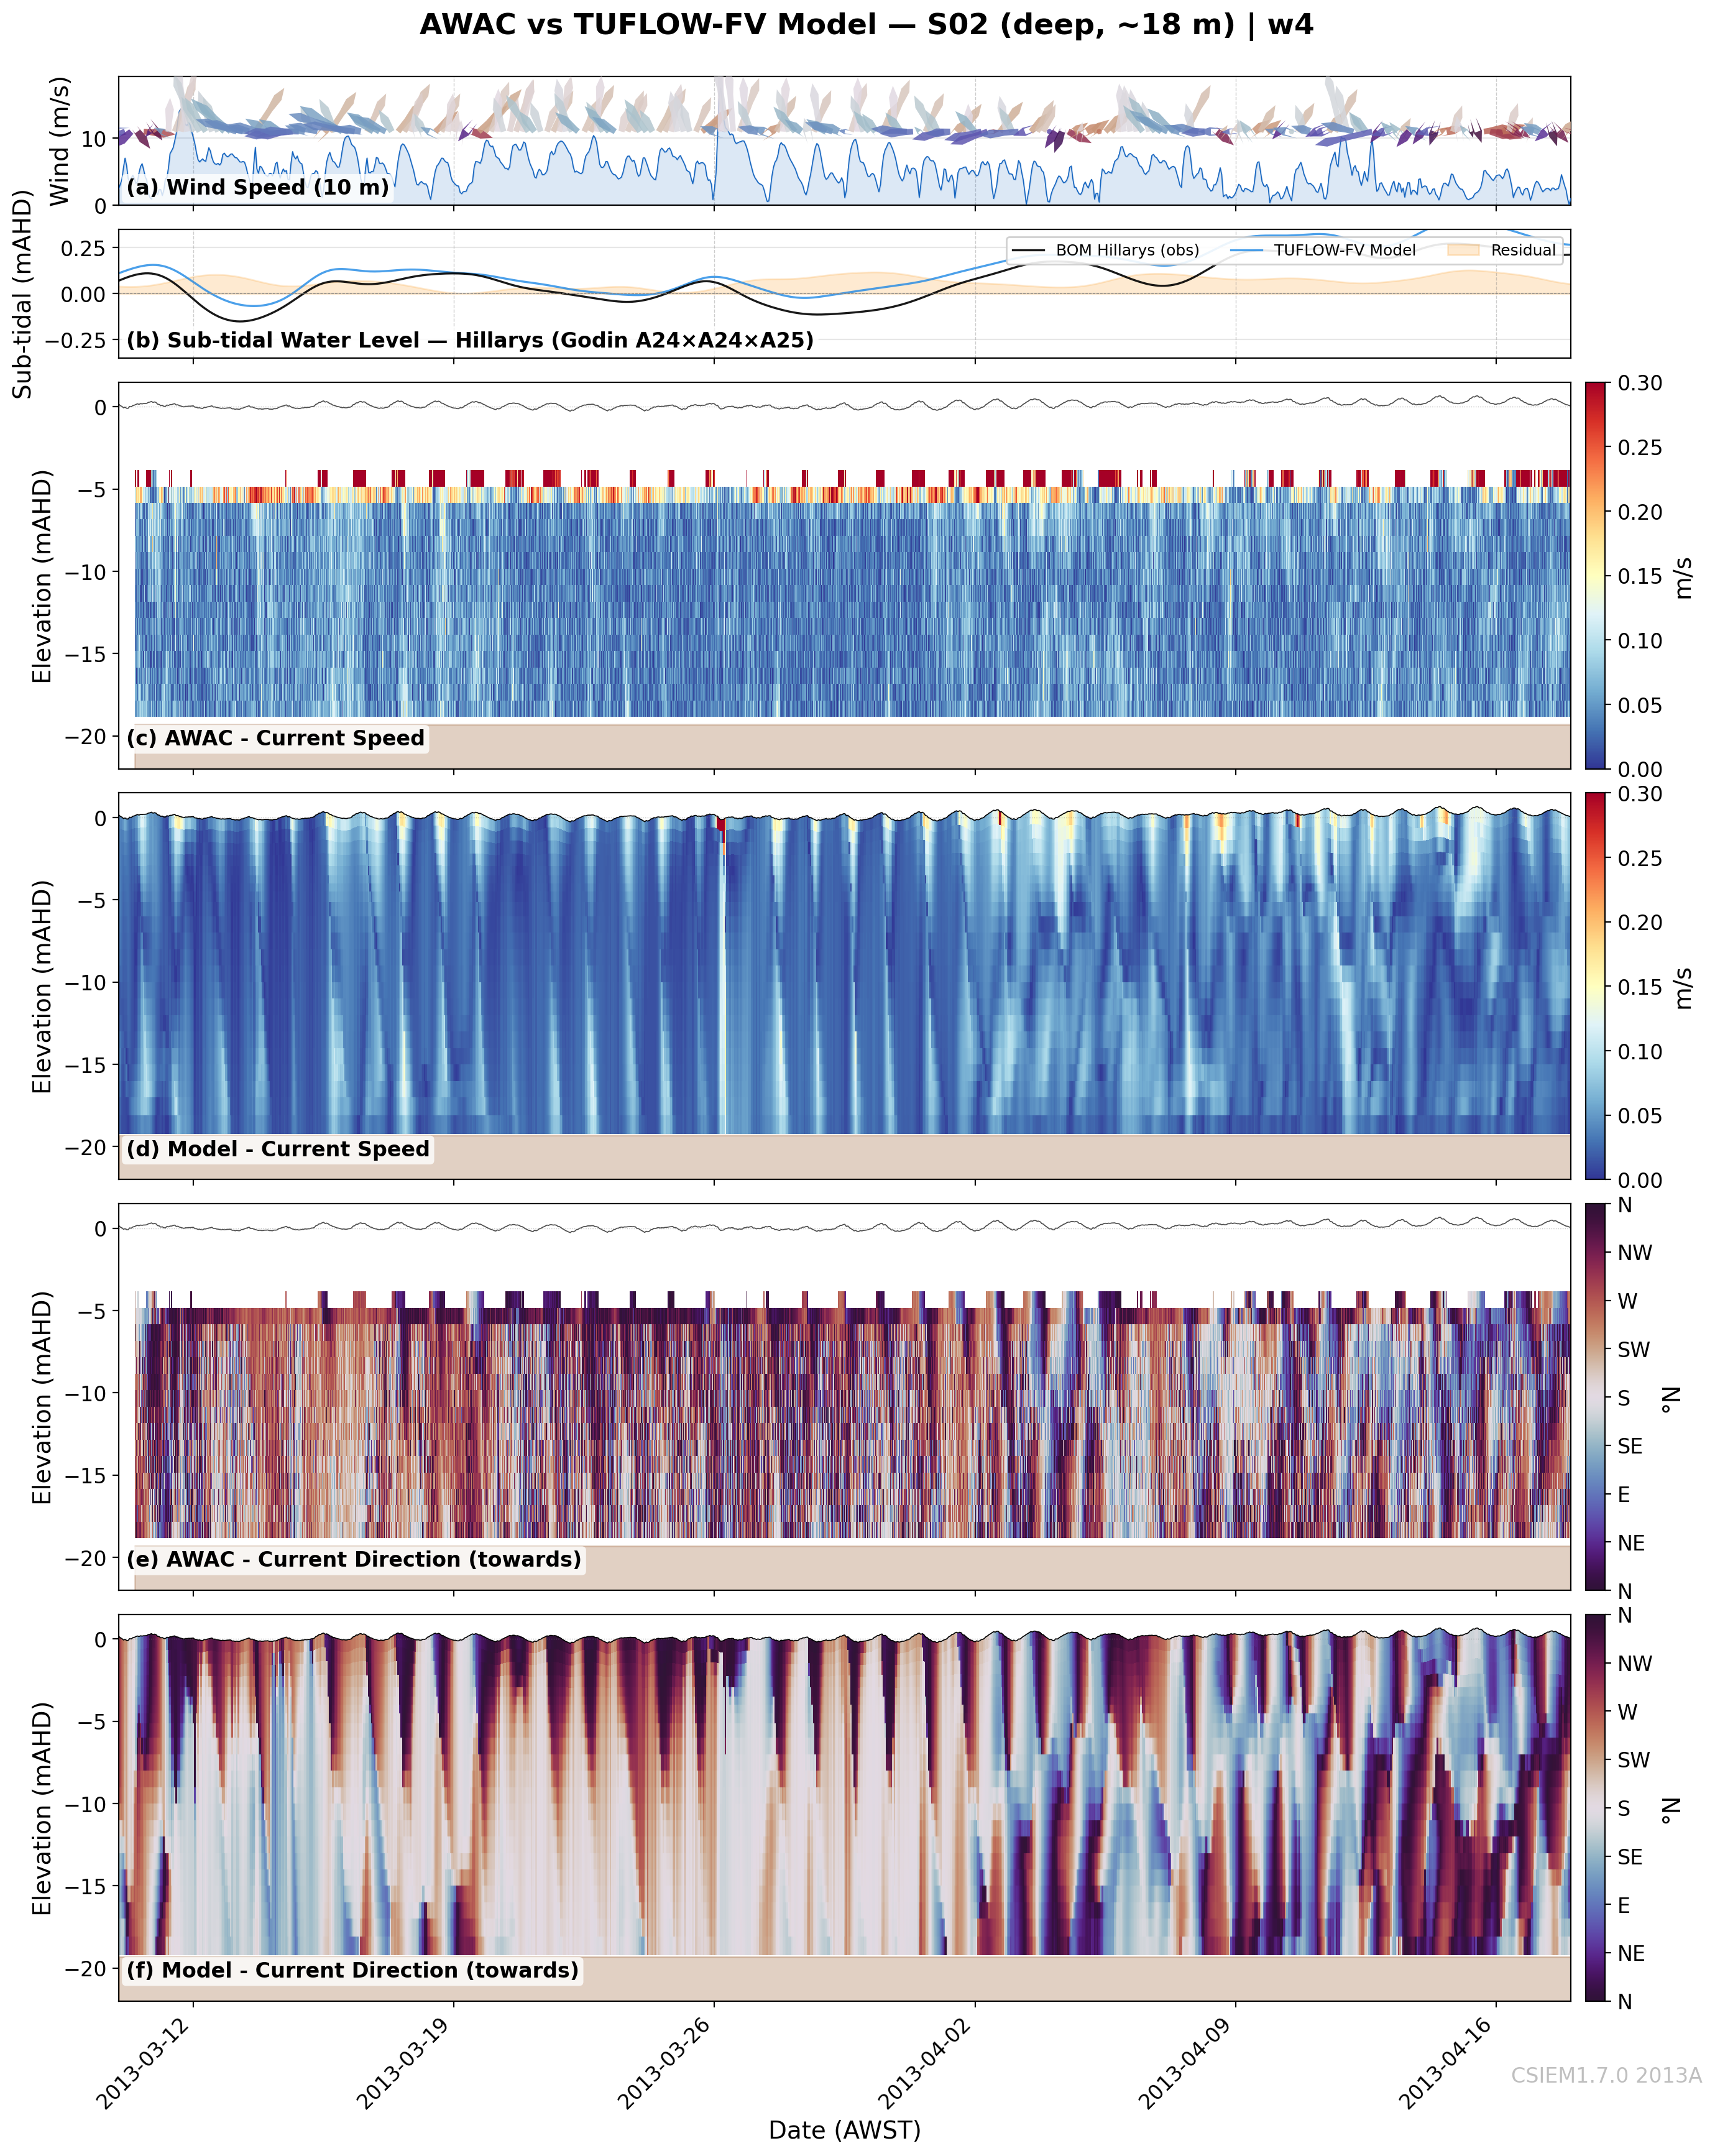
W4: Easterly Component
S/SE/E winds dominate (72%); sea-breeze pattern persists with more E/SE component
Two-layer structure maintained with episodes of stronger near-surface intensification
Model captures overall pattern; slight underestimation of peak speeds
Comparison with W3 gyre pattern tests response to modified wind regime
Model notes: Episodes of stronger near-surface intensification (>0.25 m/s) at CS1 that model tends to underestimate — possibly modified wind fetch under easterly conditions. CS4 deployment ends mid-window (~20 Feb). Bottom gyre comparison with W3 tests whether residual pattern shifts under modified wind regime despite similar overall forcing — may indicate evolving basin–shelf density contrasts.
CS6 (11m) — Owen Anchorage
CS1 (20m) — Basin (north)
CS5 (11m) — Shelf (north)
CS2 (20m) — Basin (mid-west)
CS4 (11m) — Shelf (south)
CS7 (6m) — Causeway
CS3 (20m) — Basin (south)
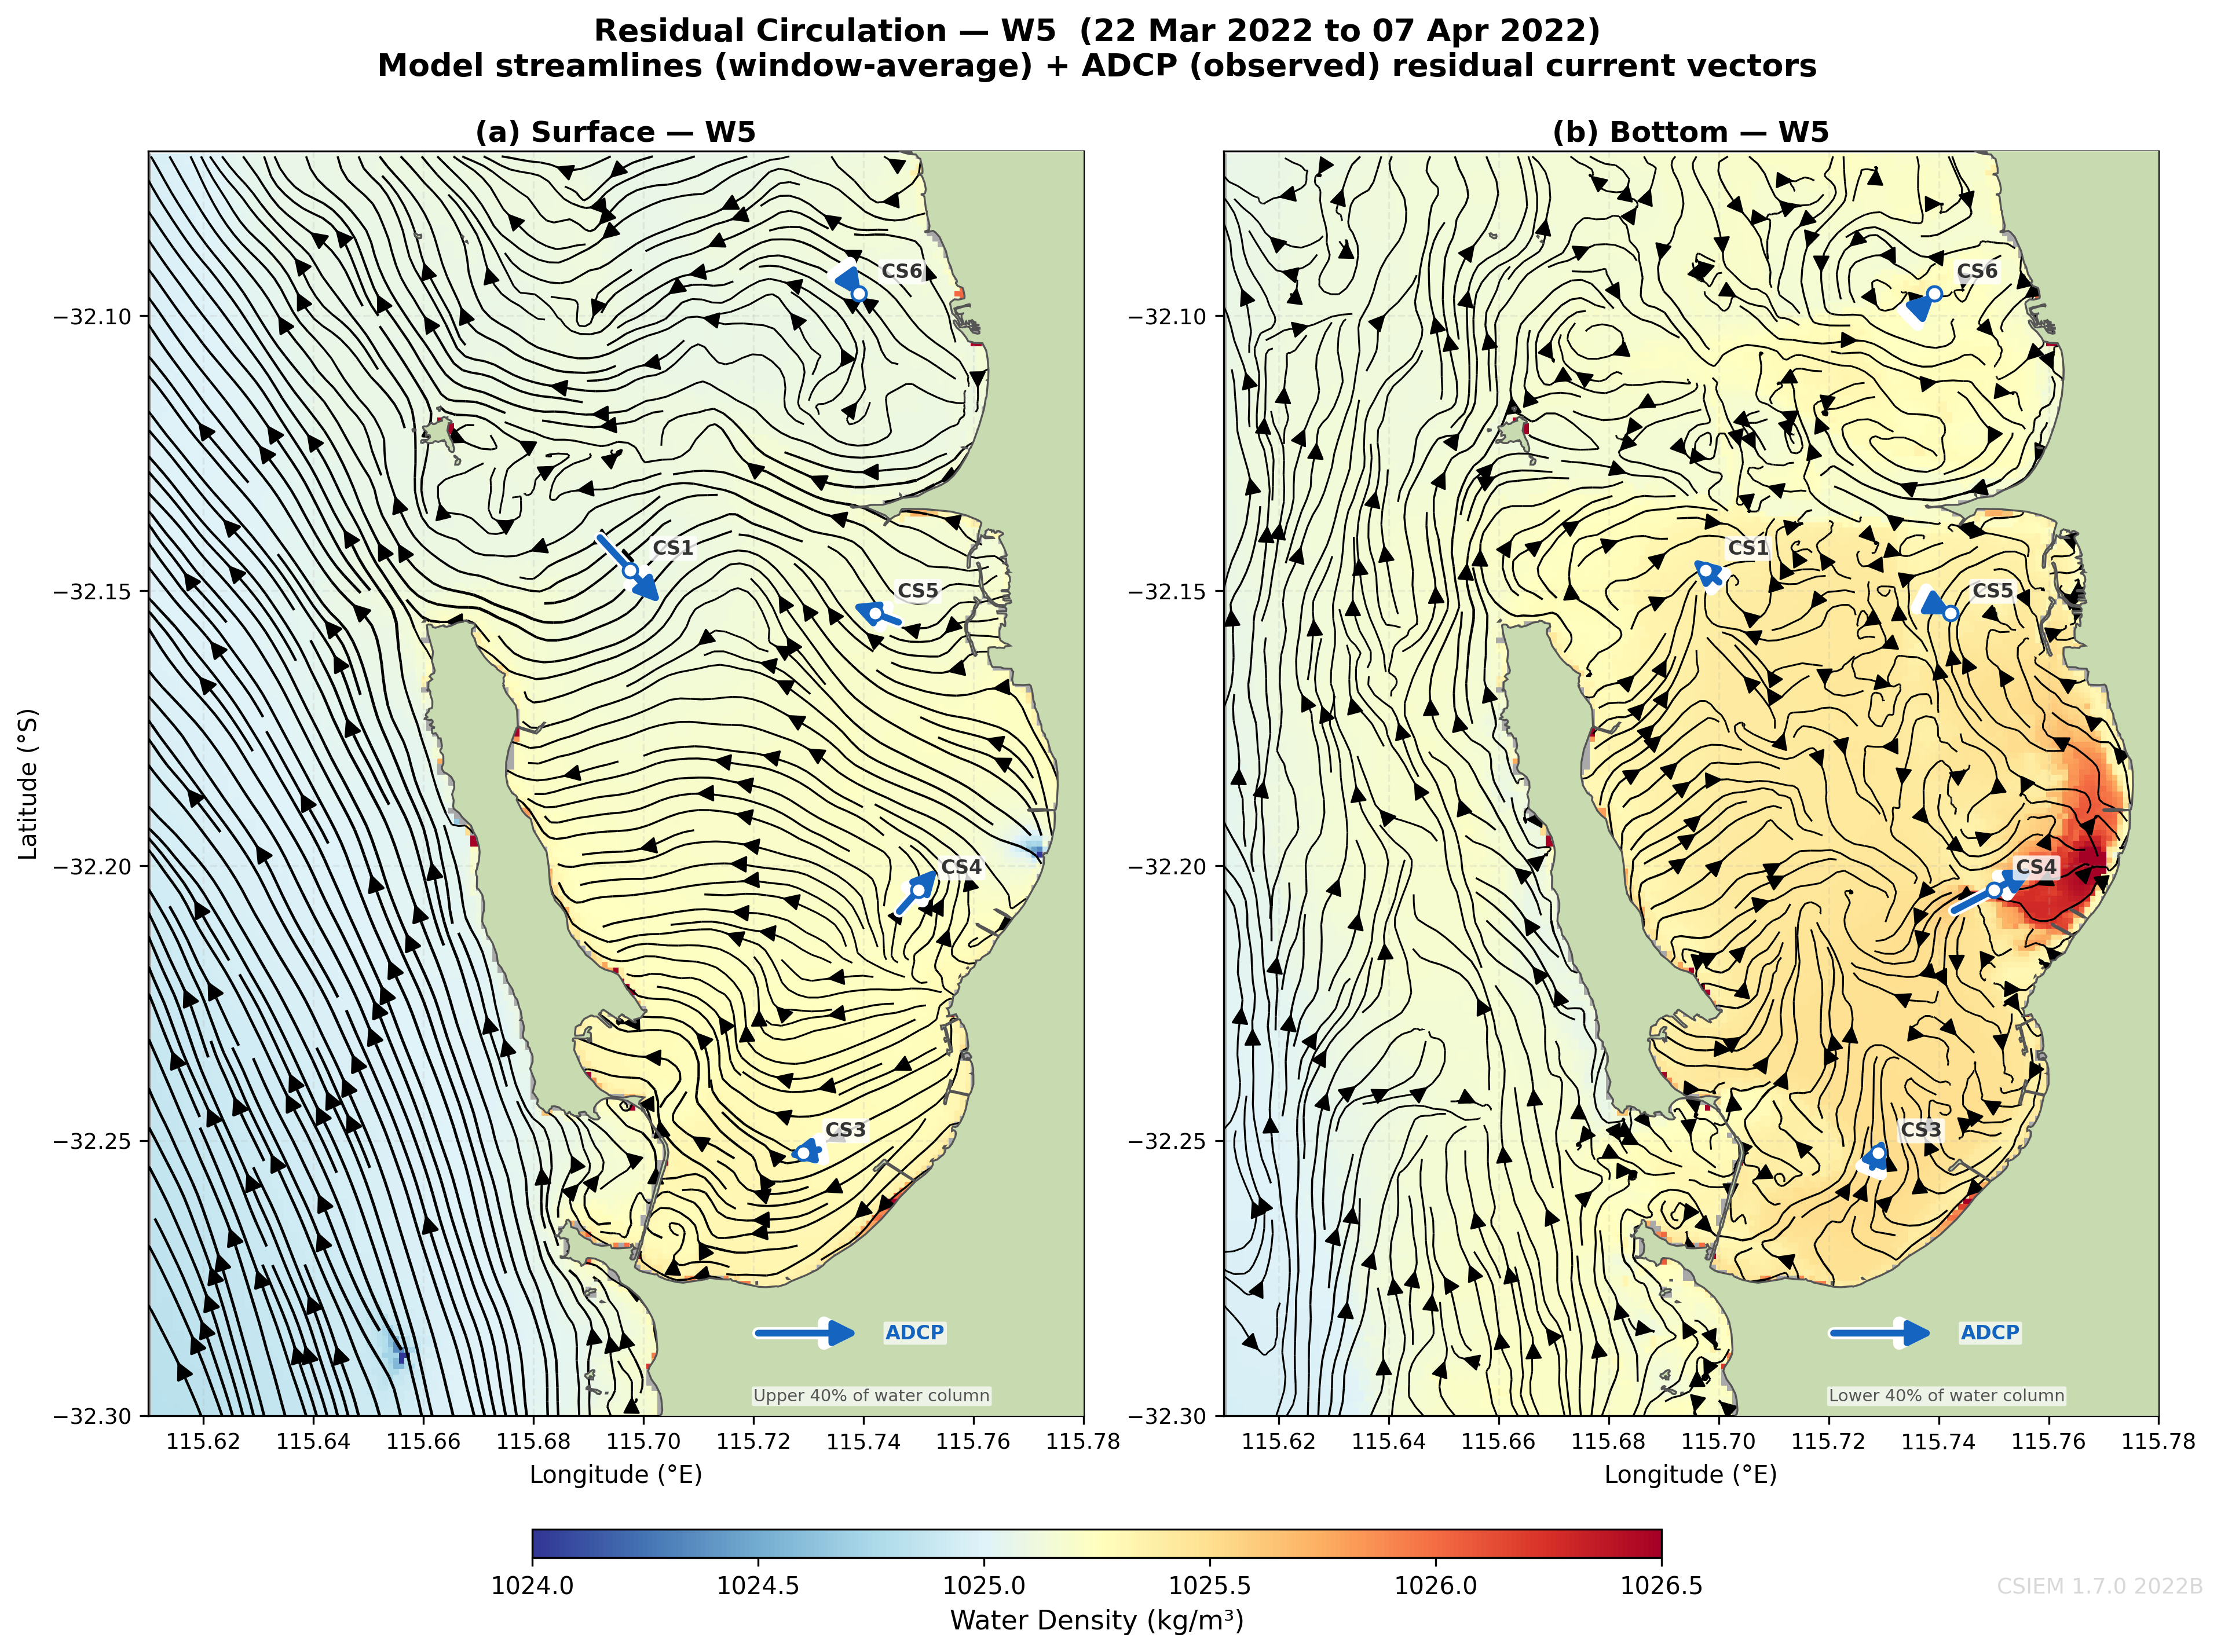
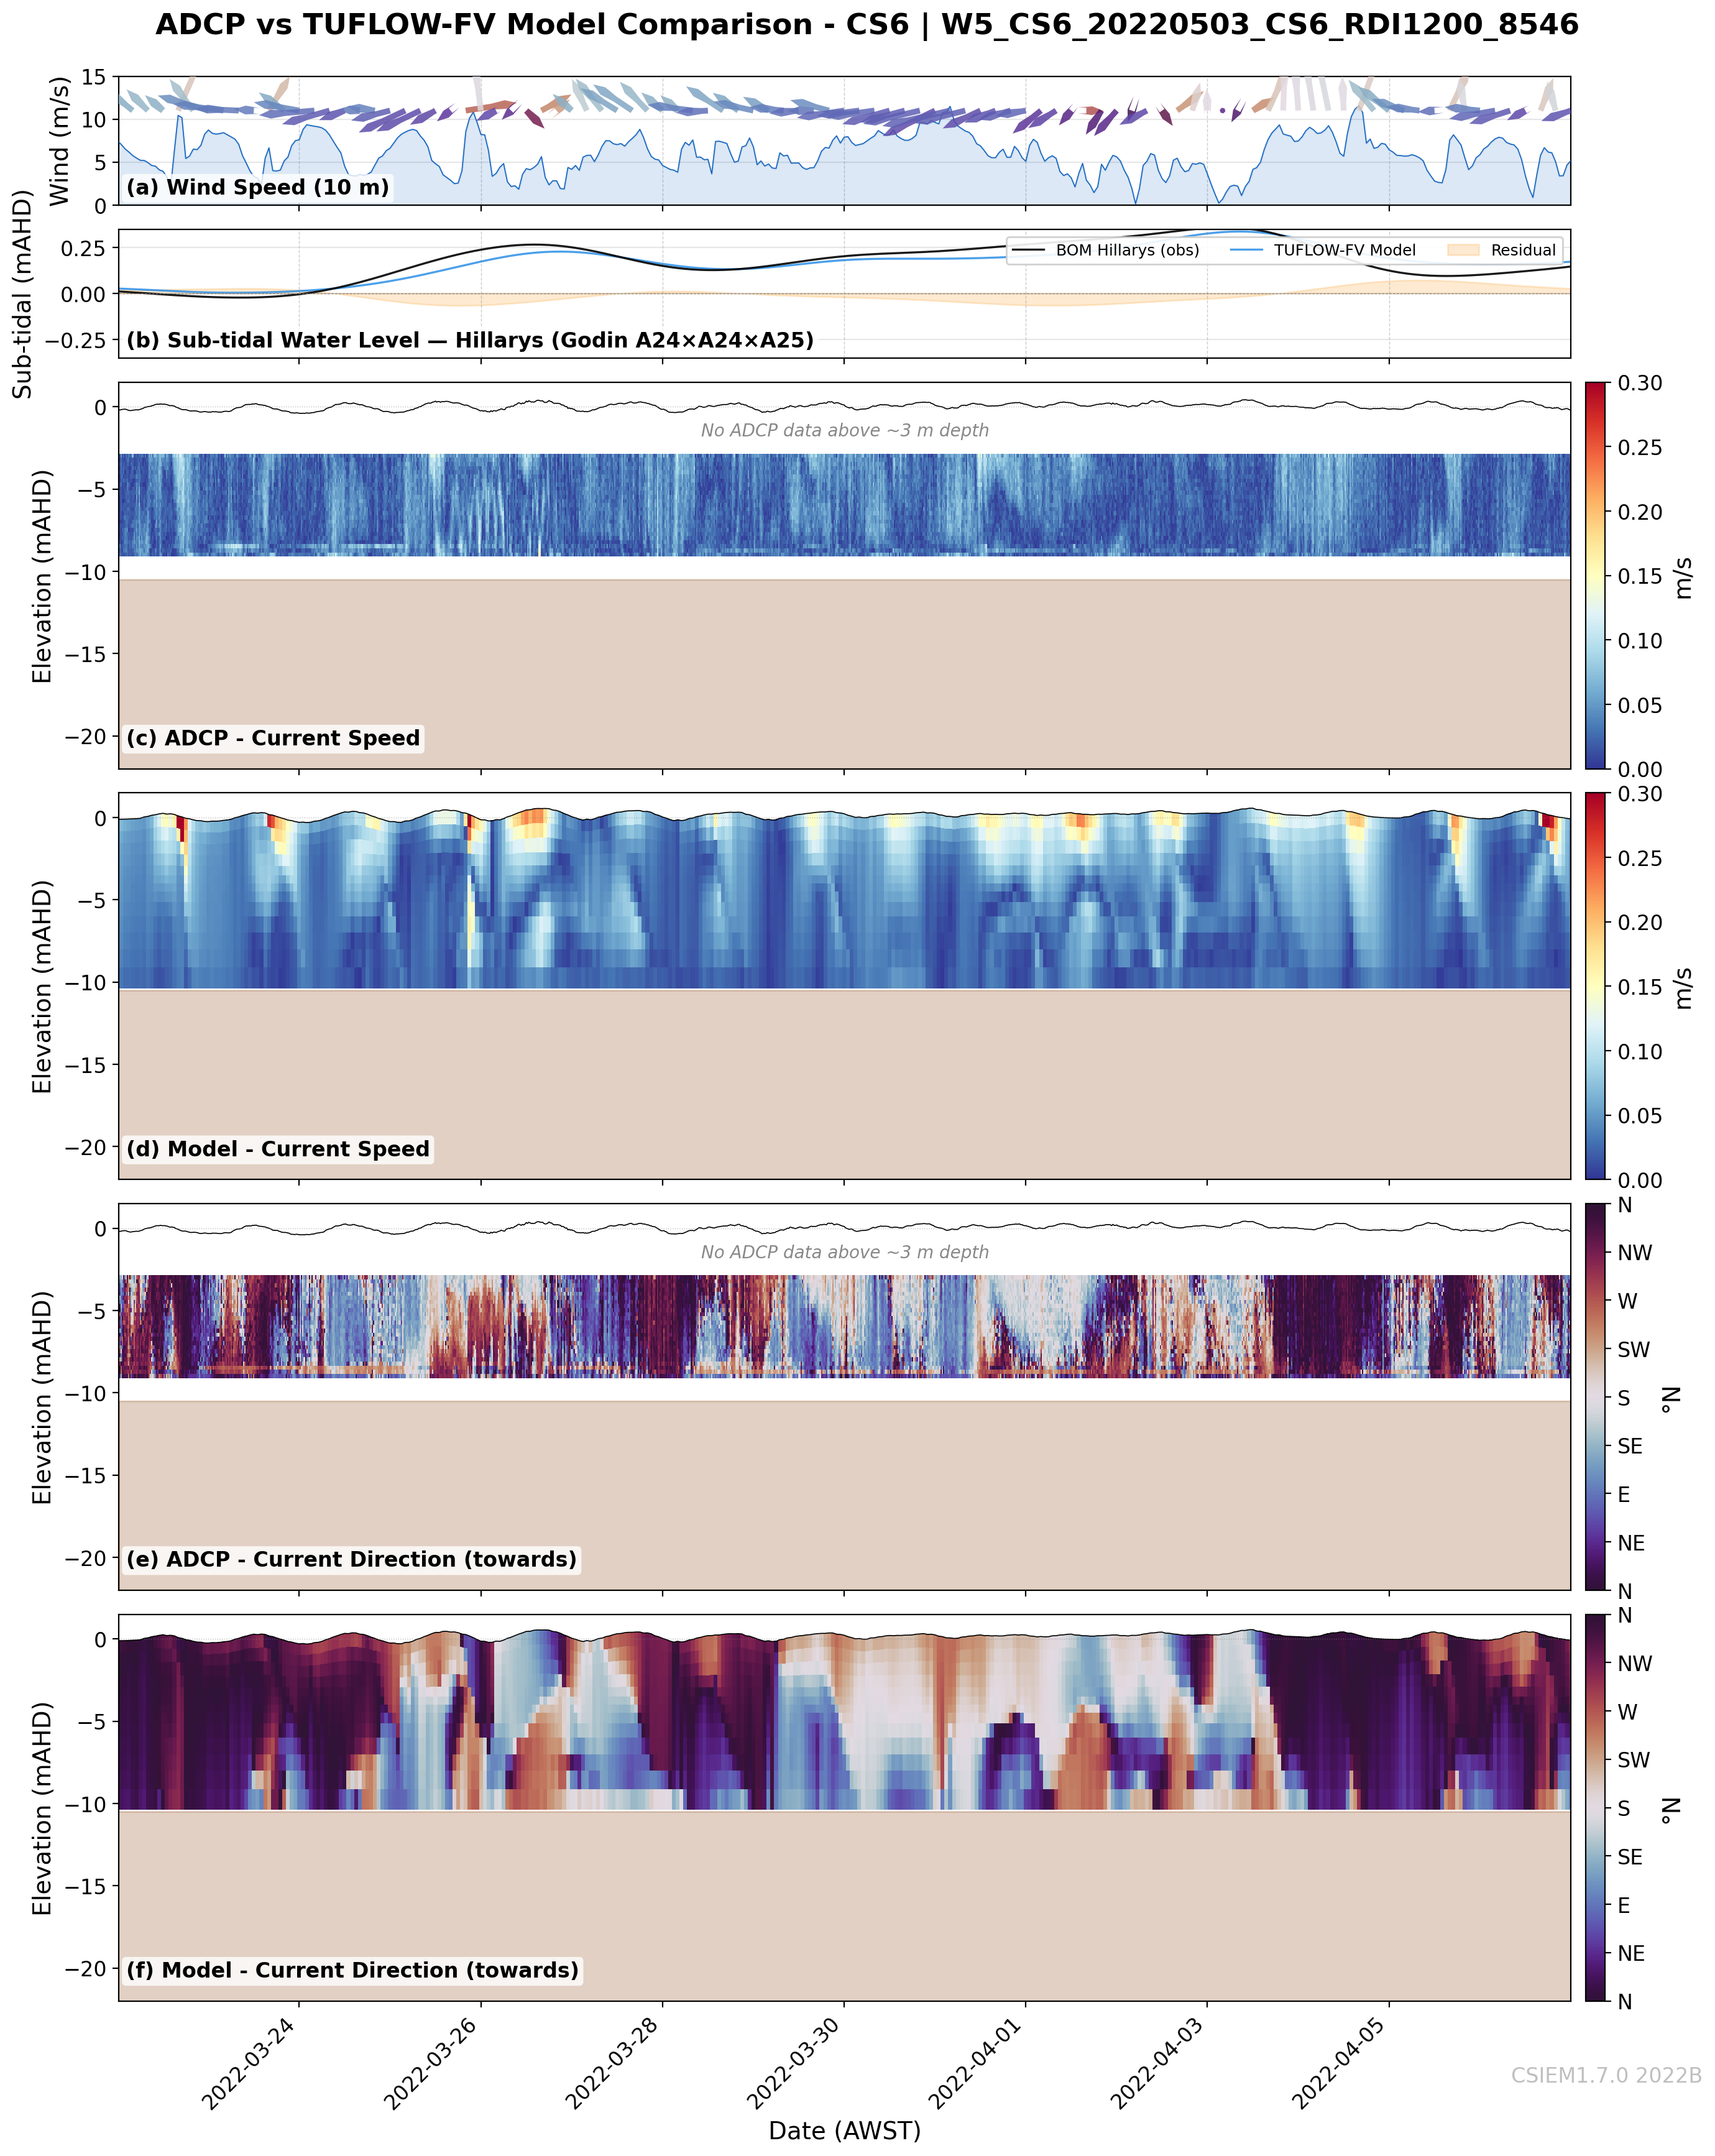
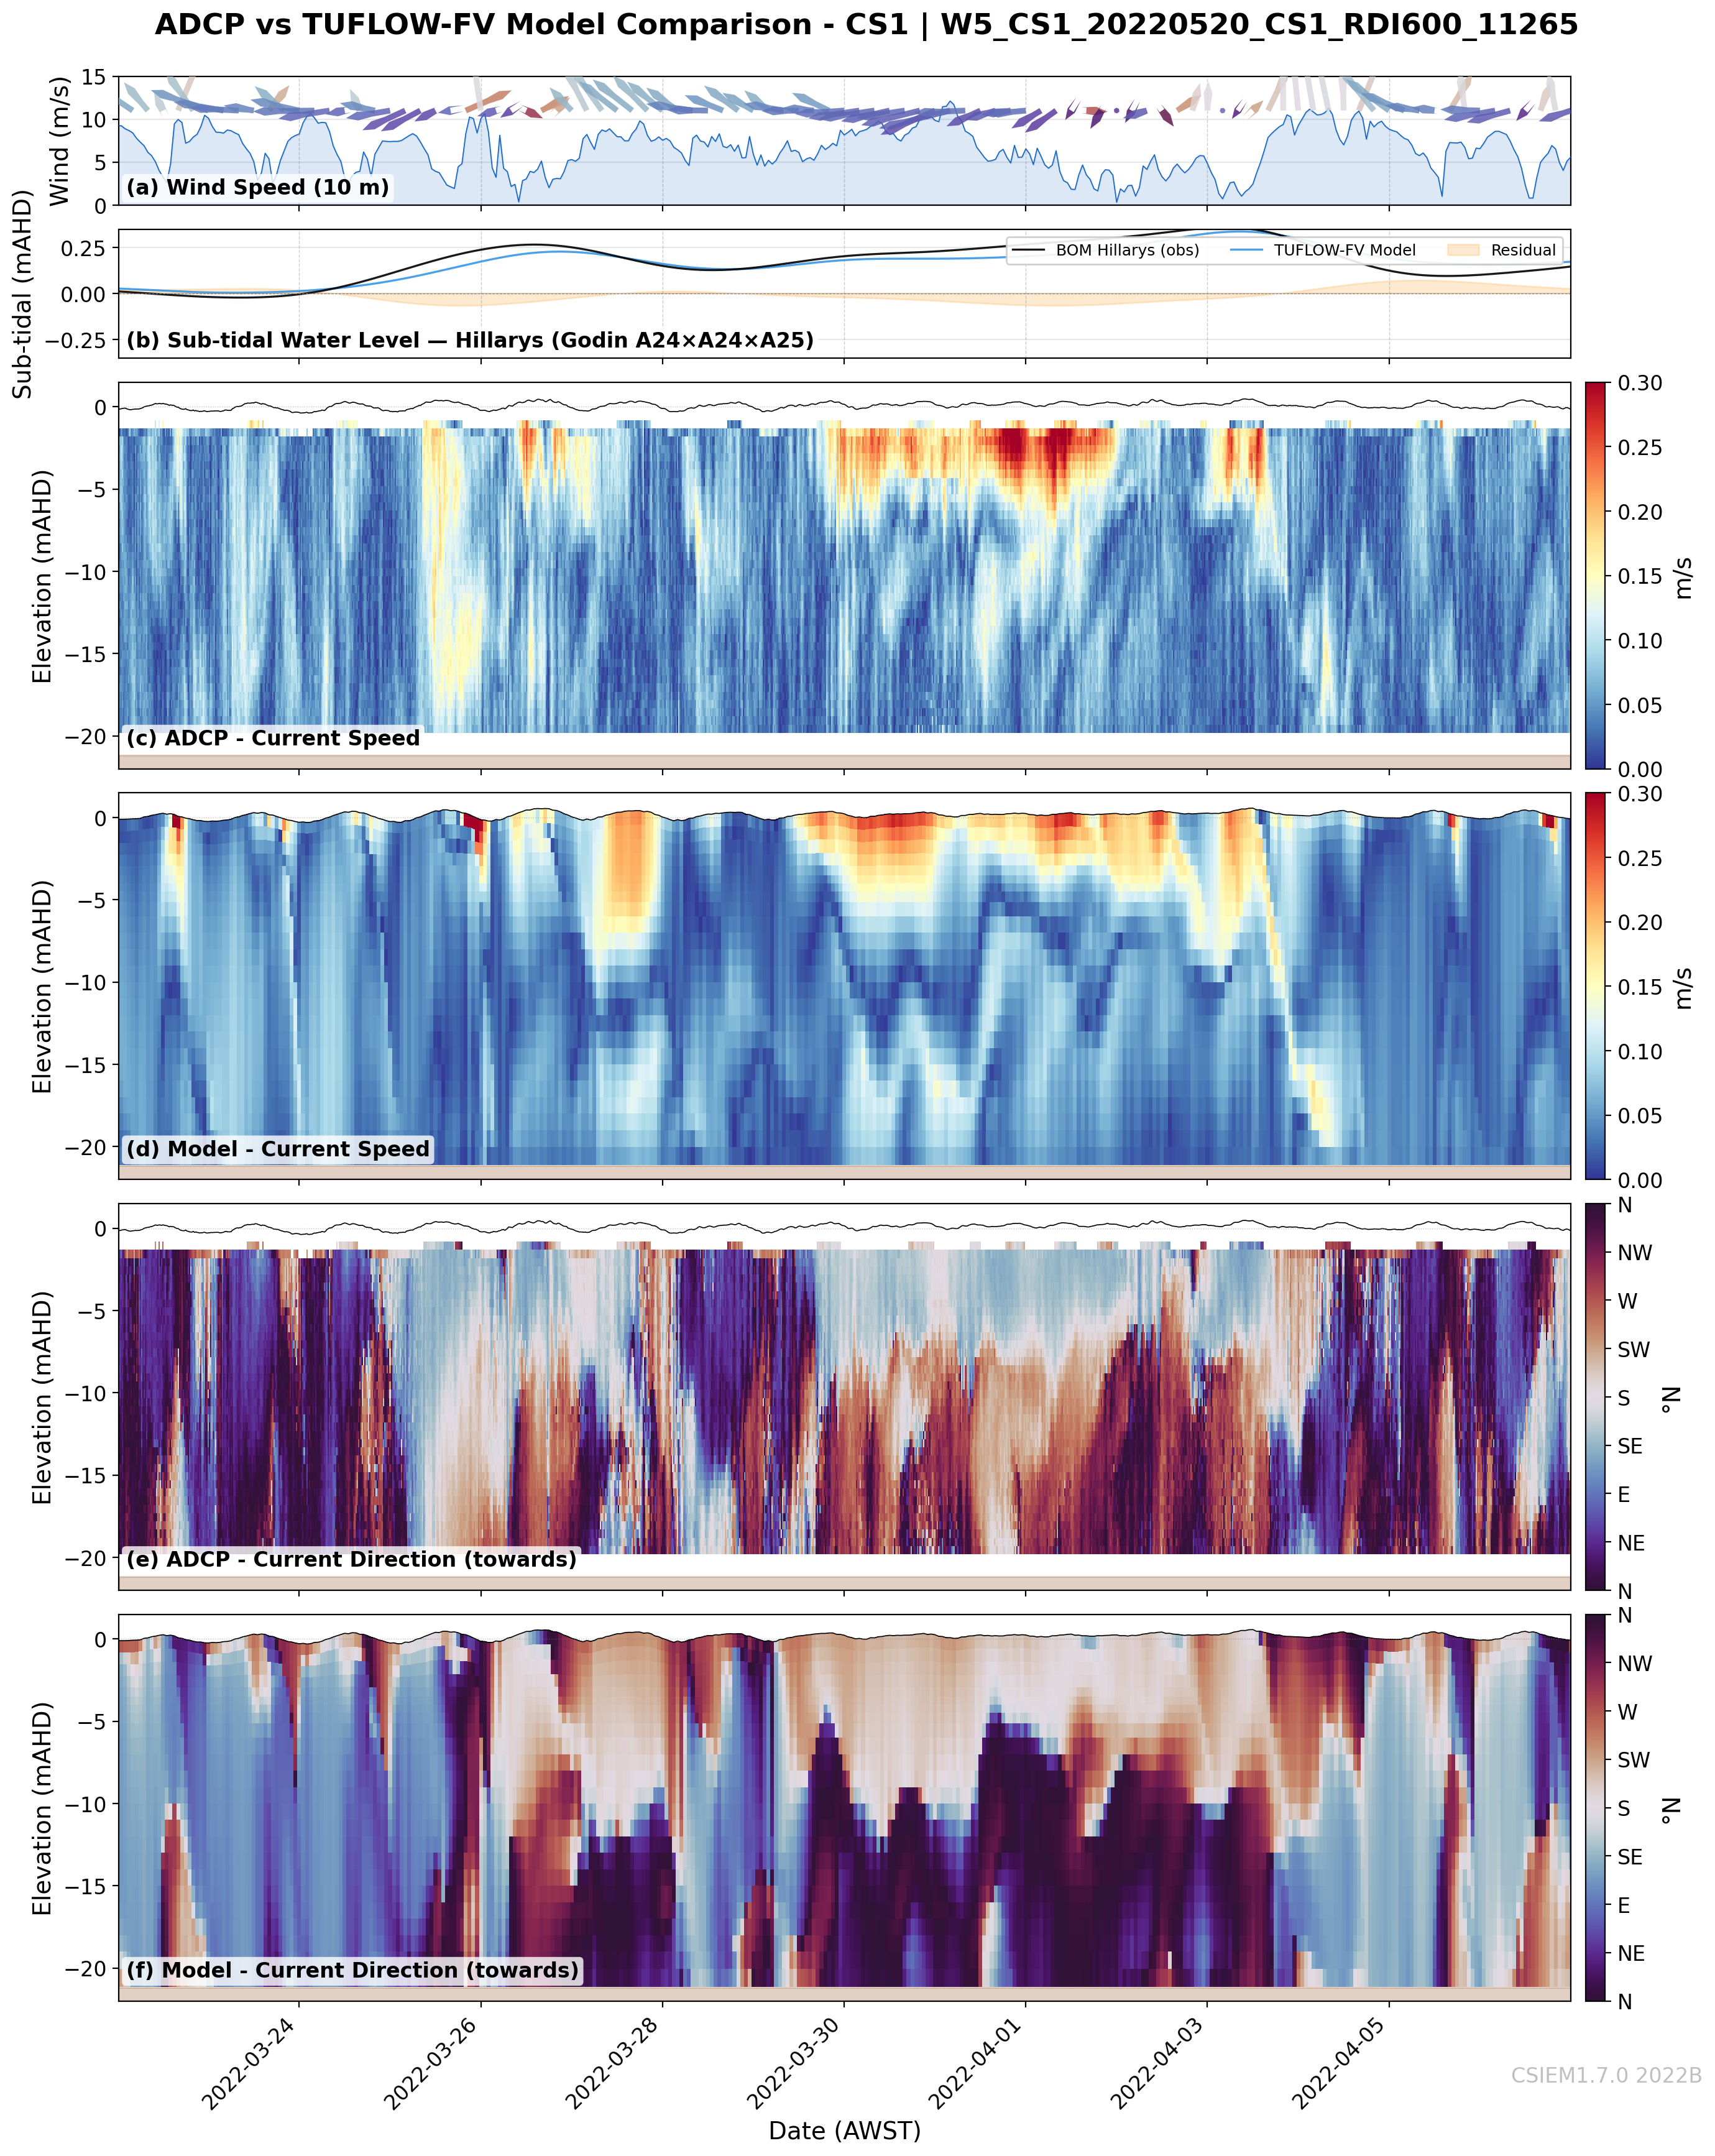
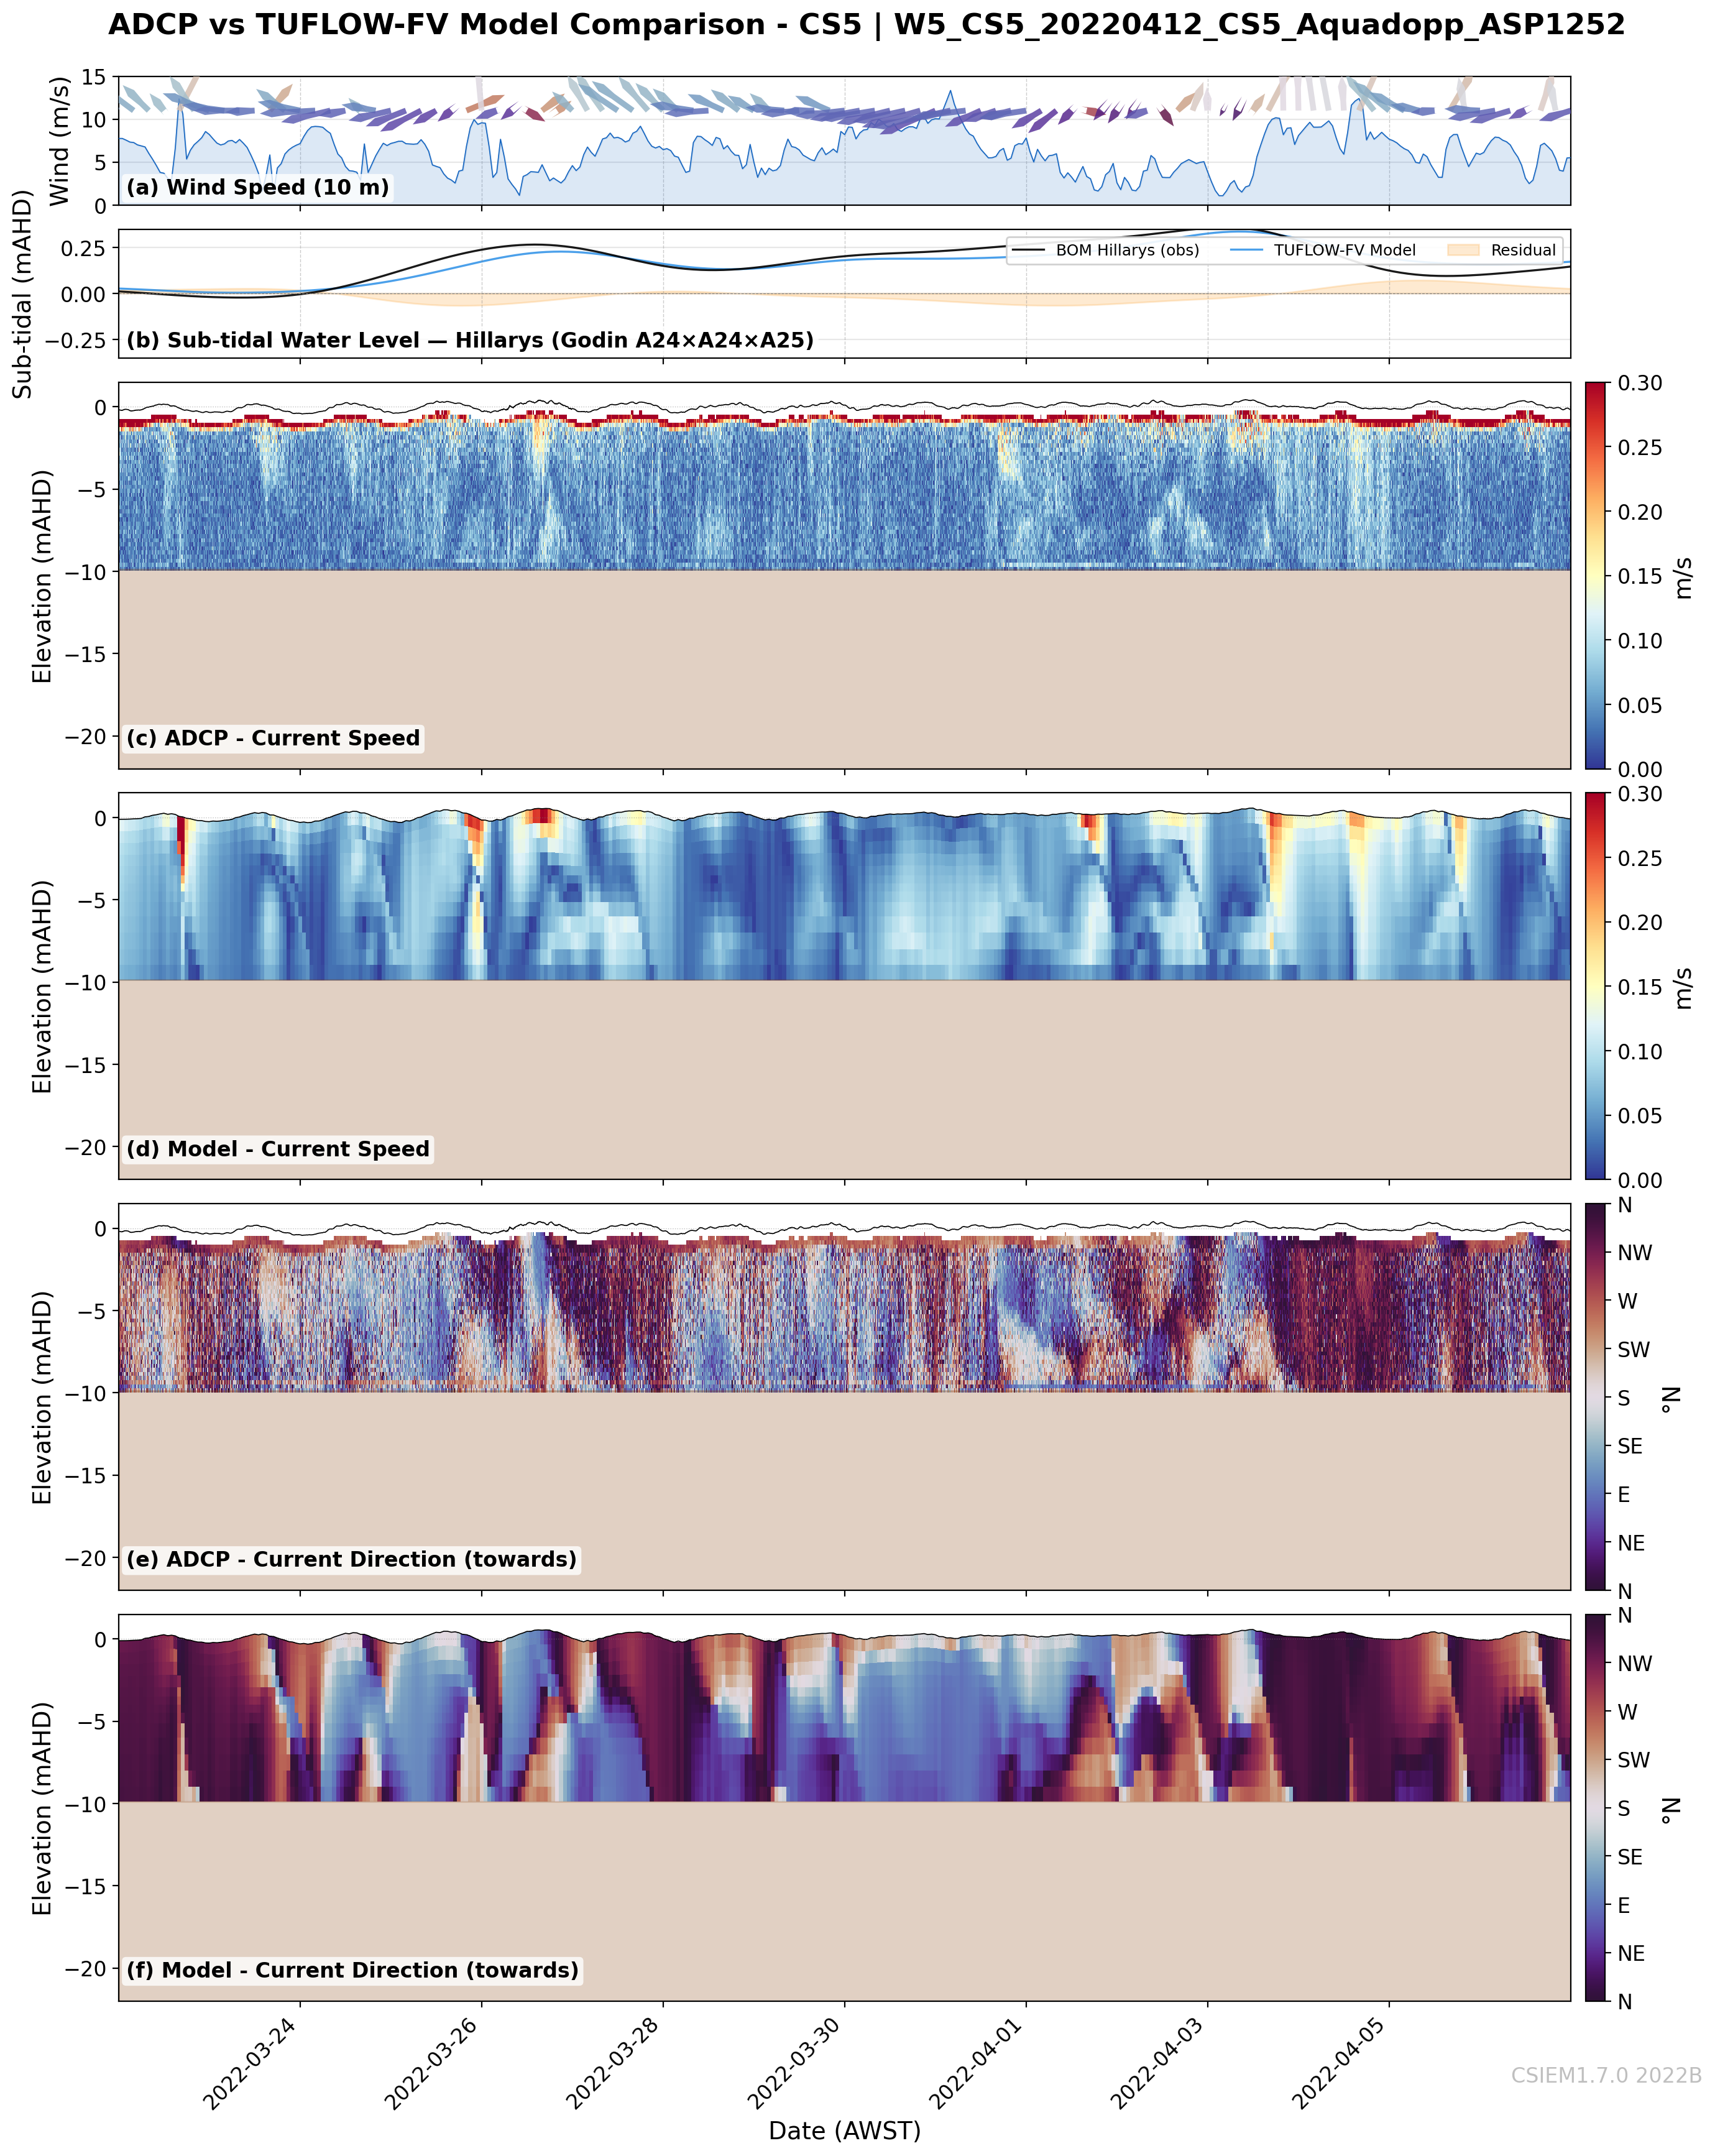
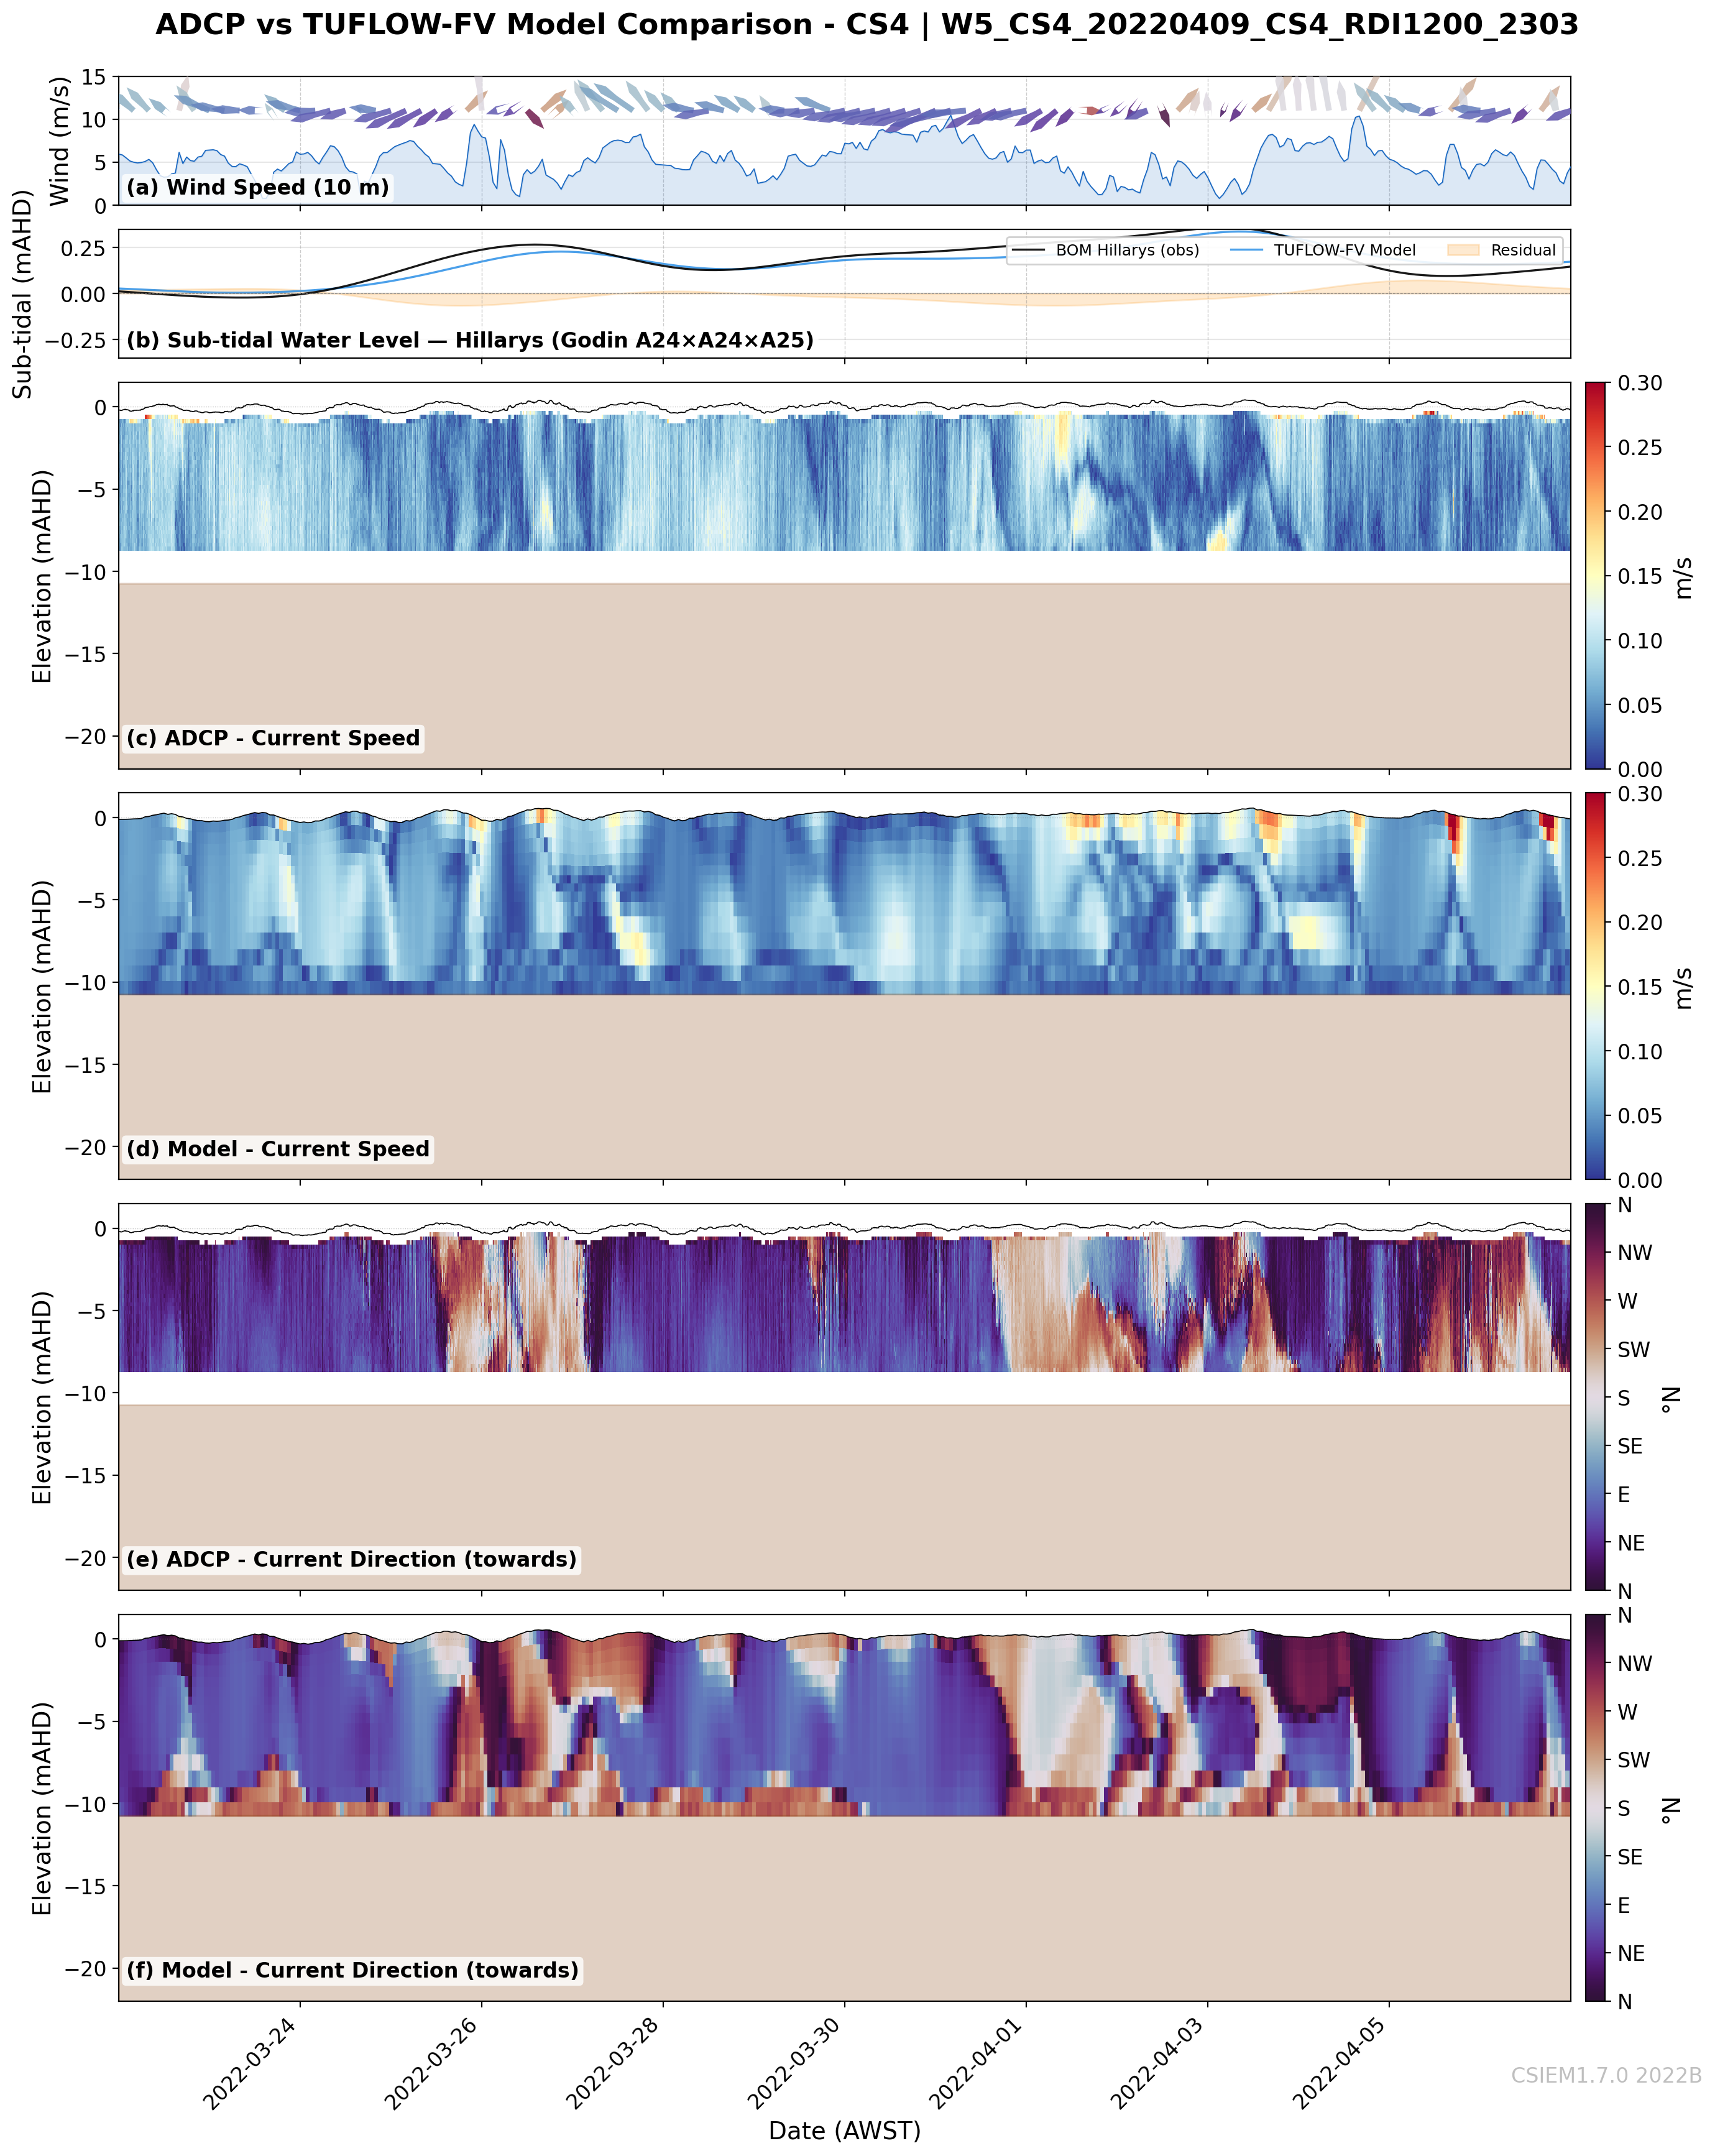
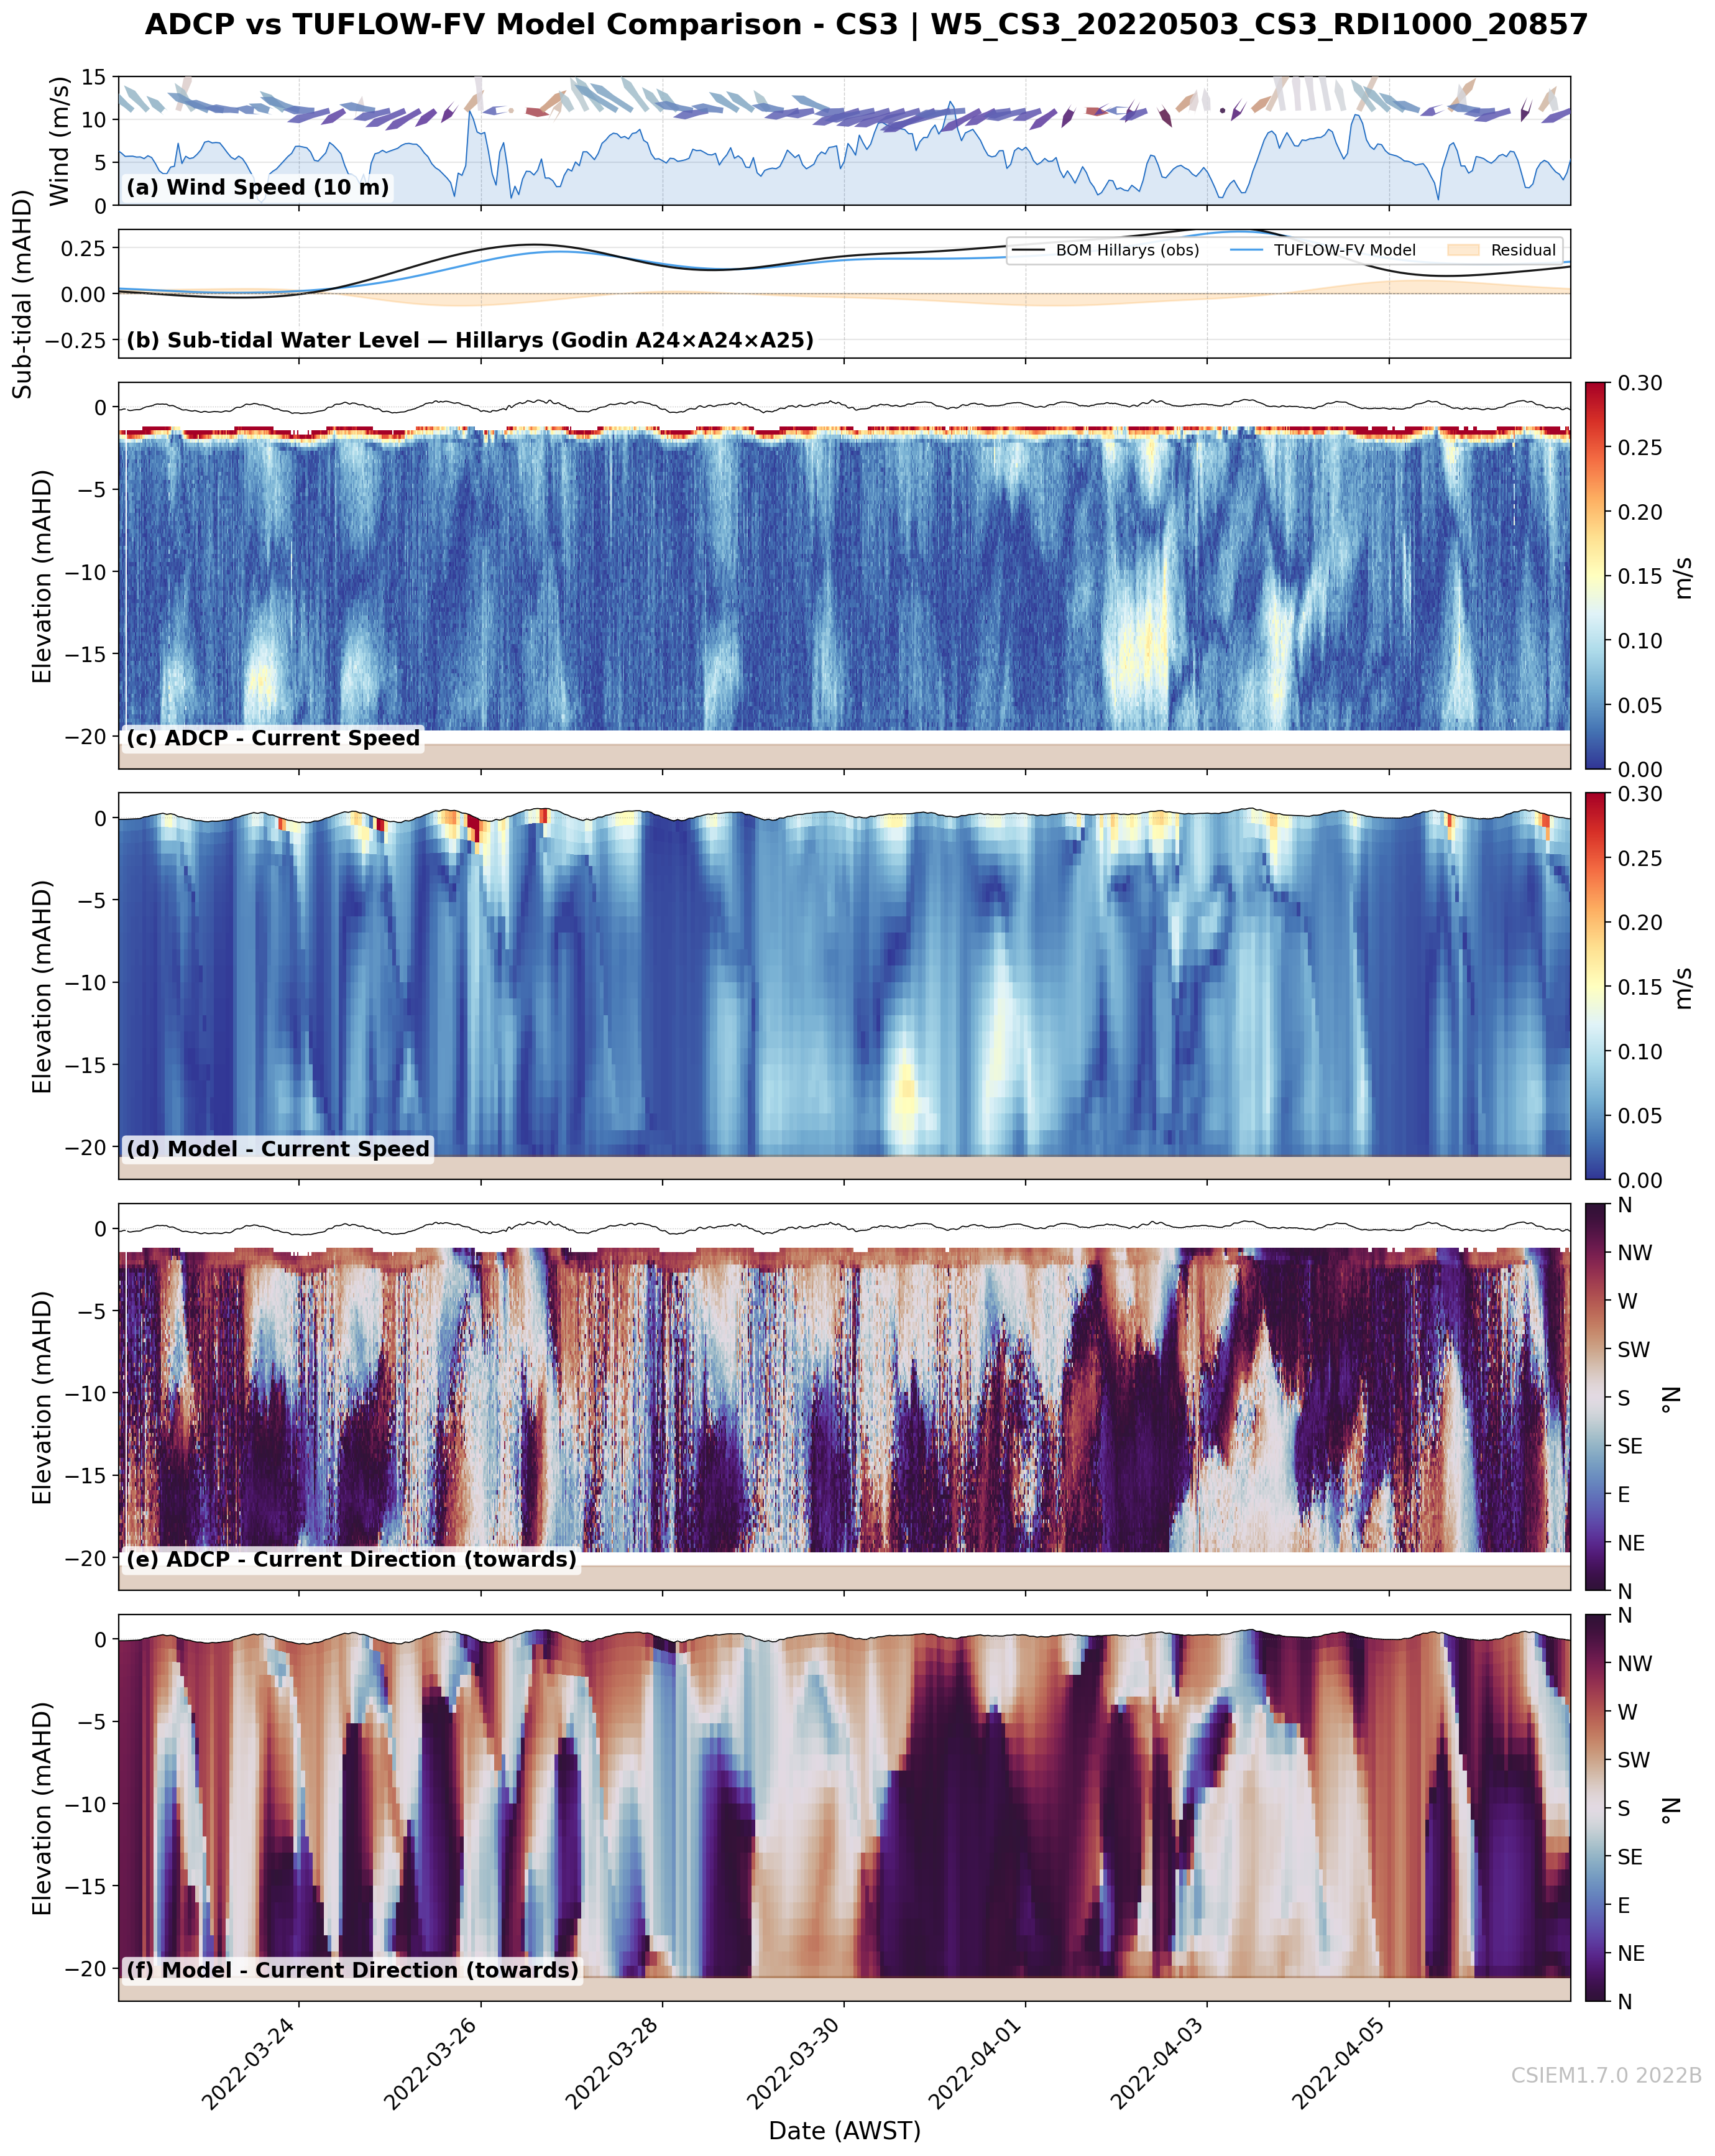
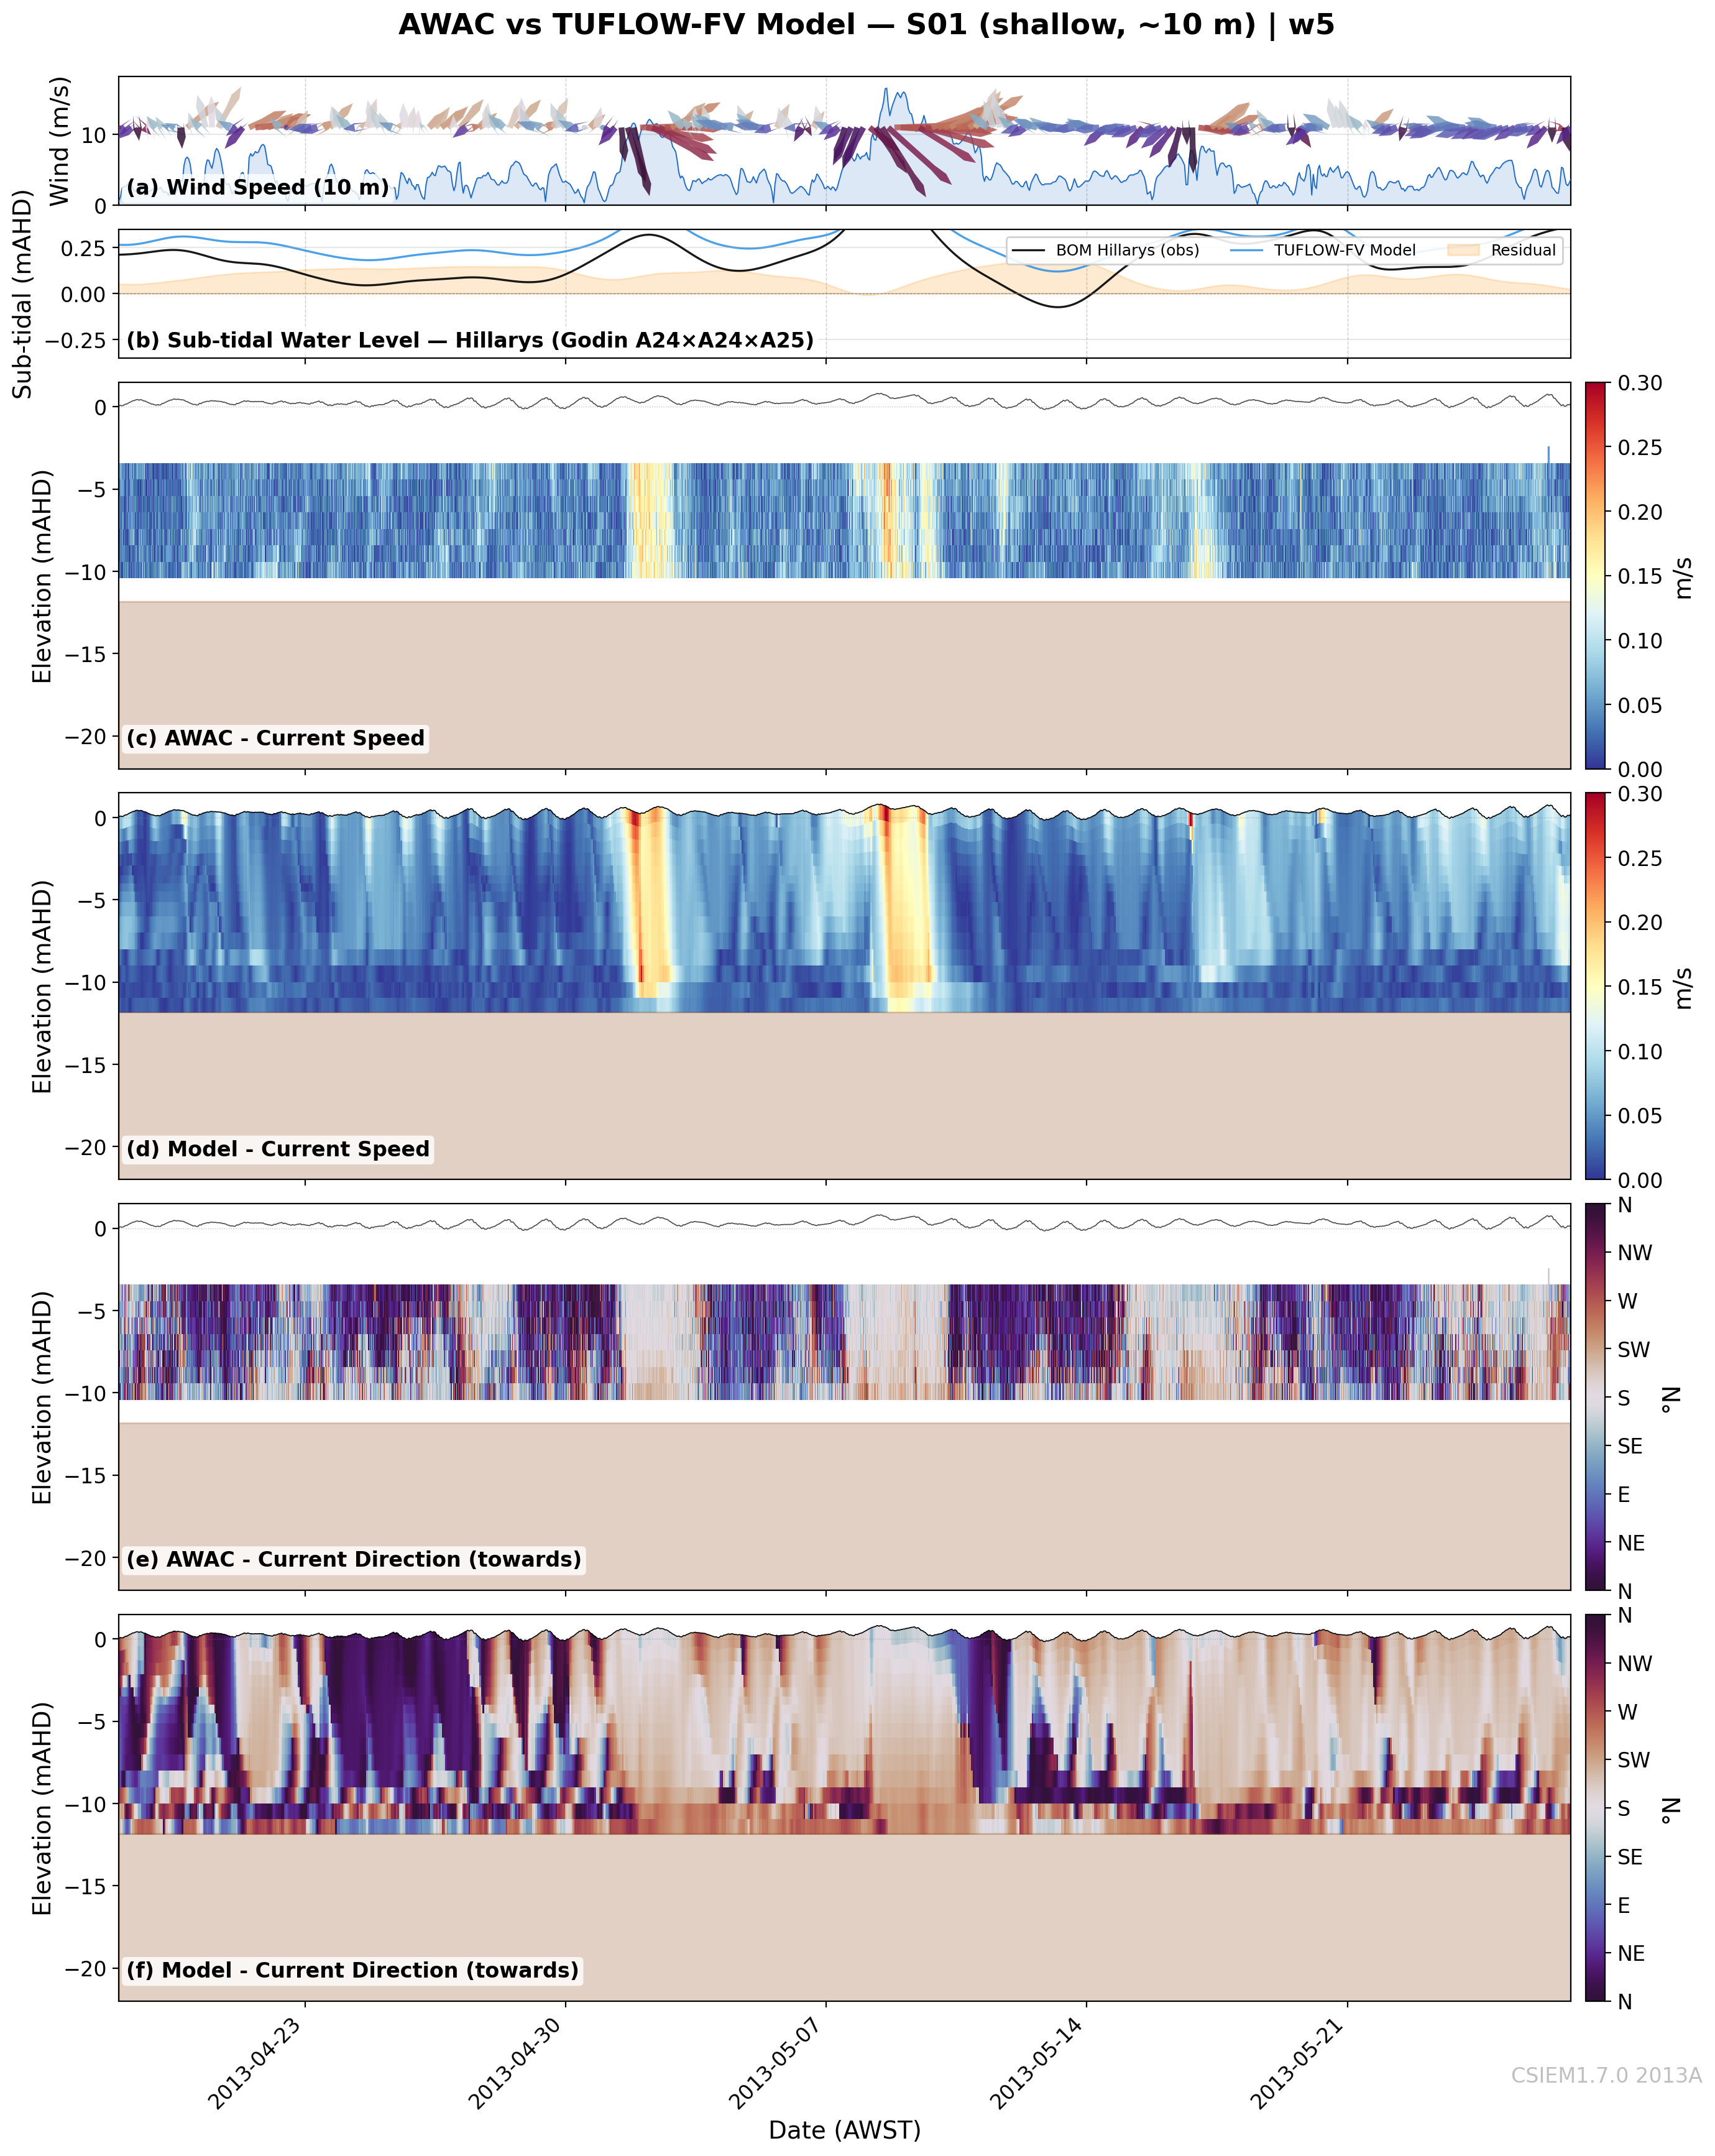
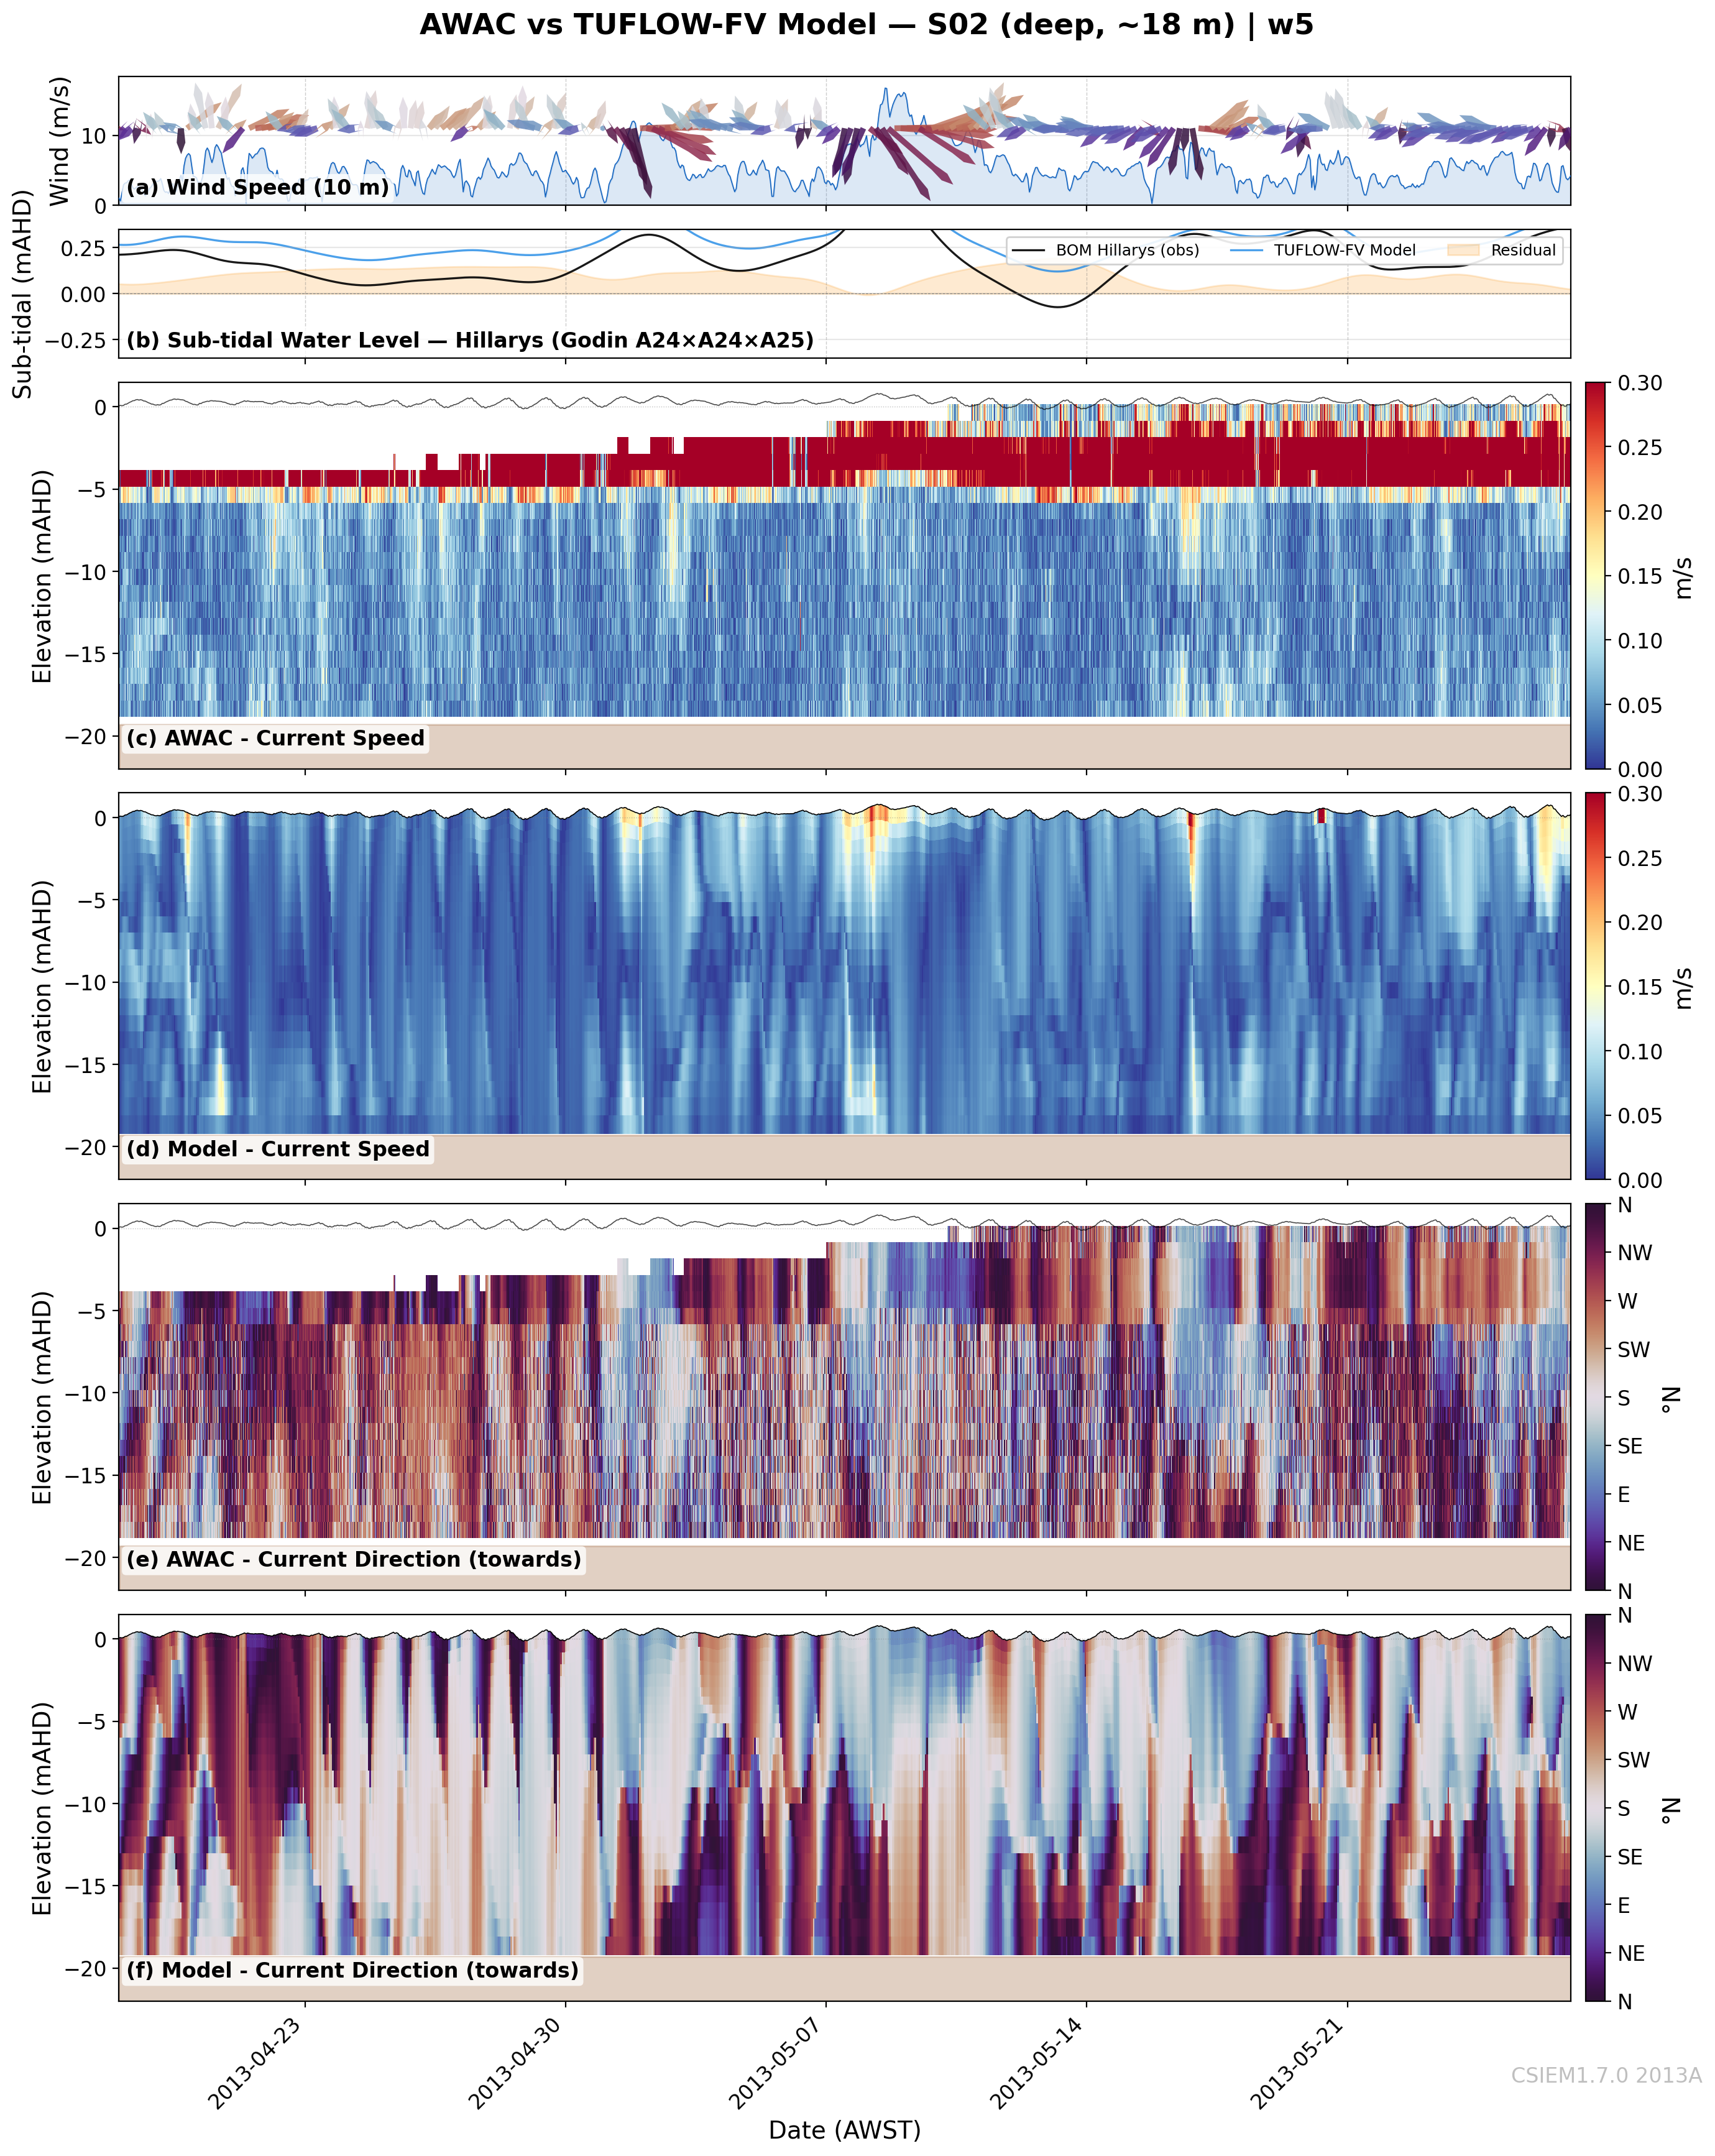
W5: Post-Cyclone CSW
TC Charlotte CSW: ~0.2–0.25 m sub-tidal peak arrives ~28 Mar
Model captures CSW timing and amplitude via open boundary forcing
Depth-uniform flow on shallow shelf sites during weak local wind
Model notes: Open boundary forcing (WA-ROMS) successfully transmits CSW signal into the CSIEM domain. CS1 observed near-surface speeds slightly exceed model during strongest exchange events. CS3 persistent directional offset continues — bathymetric steering effect at southern basin not fully captured by B-mesh. CS4/CS5 barotropic response well reproduced; CS6 some directional discrepancies in lower water column.
CS6 (11m) — Owen Anchorage
CS1 (20m) — Basin (north)
CS5 (11m) — Shelf (north)
CS2 not available
CS4 (11m) — Shelf (south)
CS7 not available
CS3 (20m) — Basin (south)
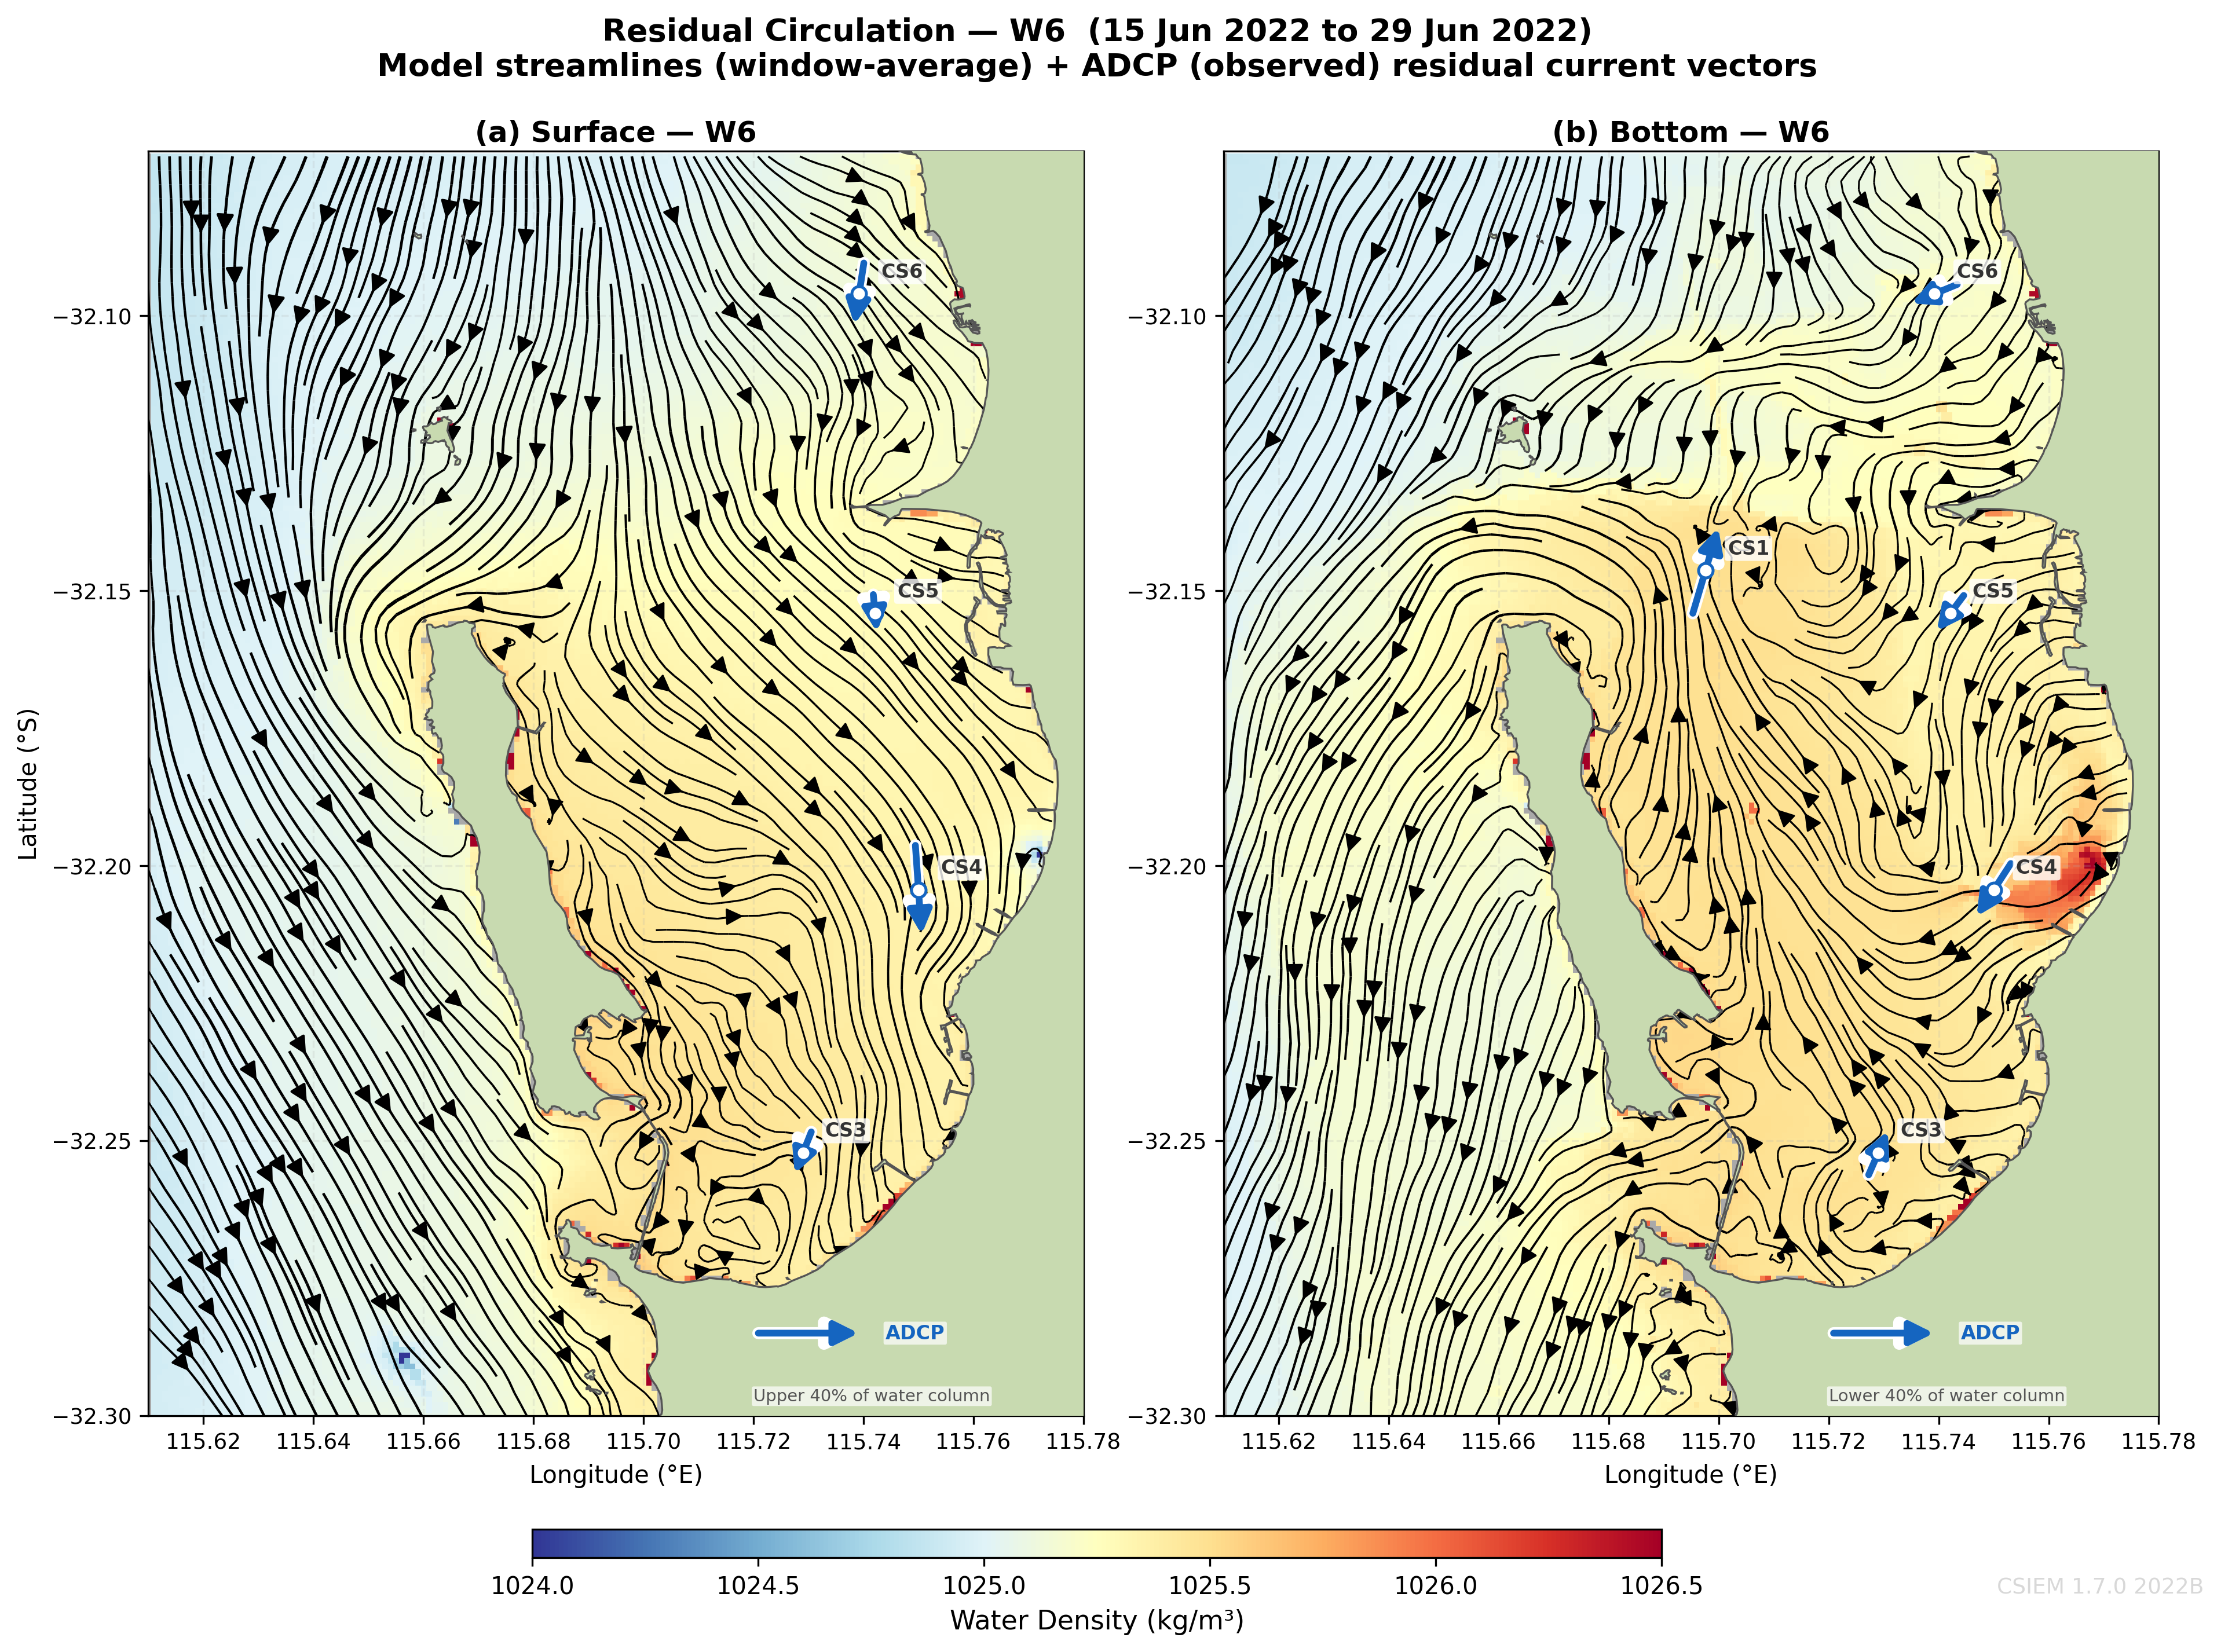
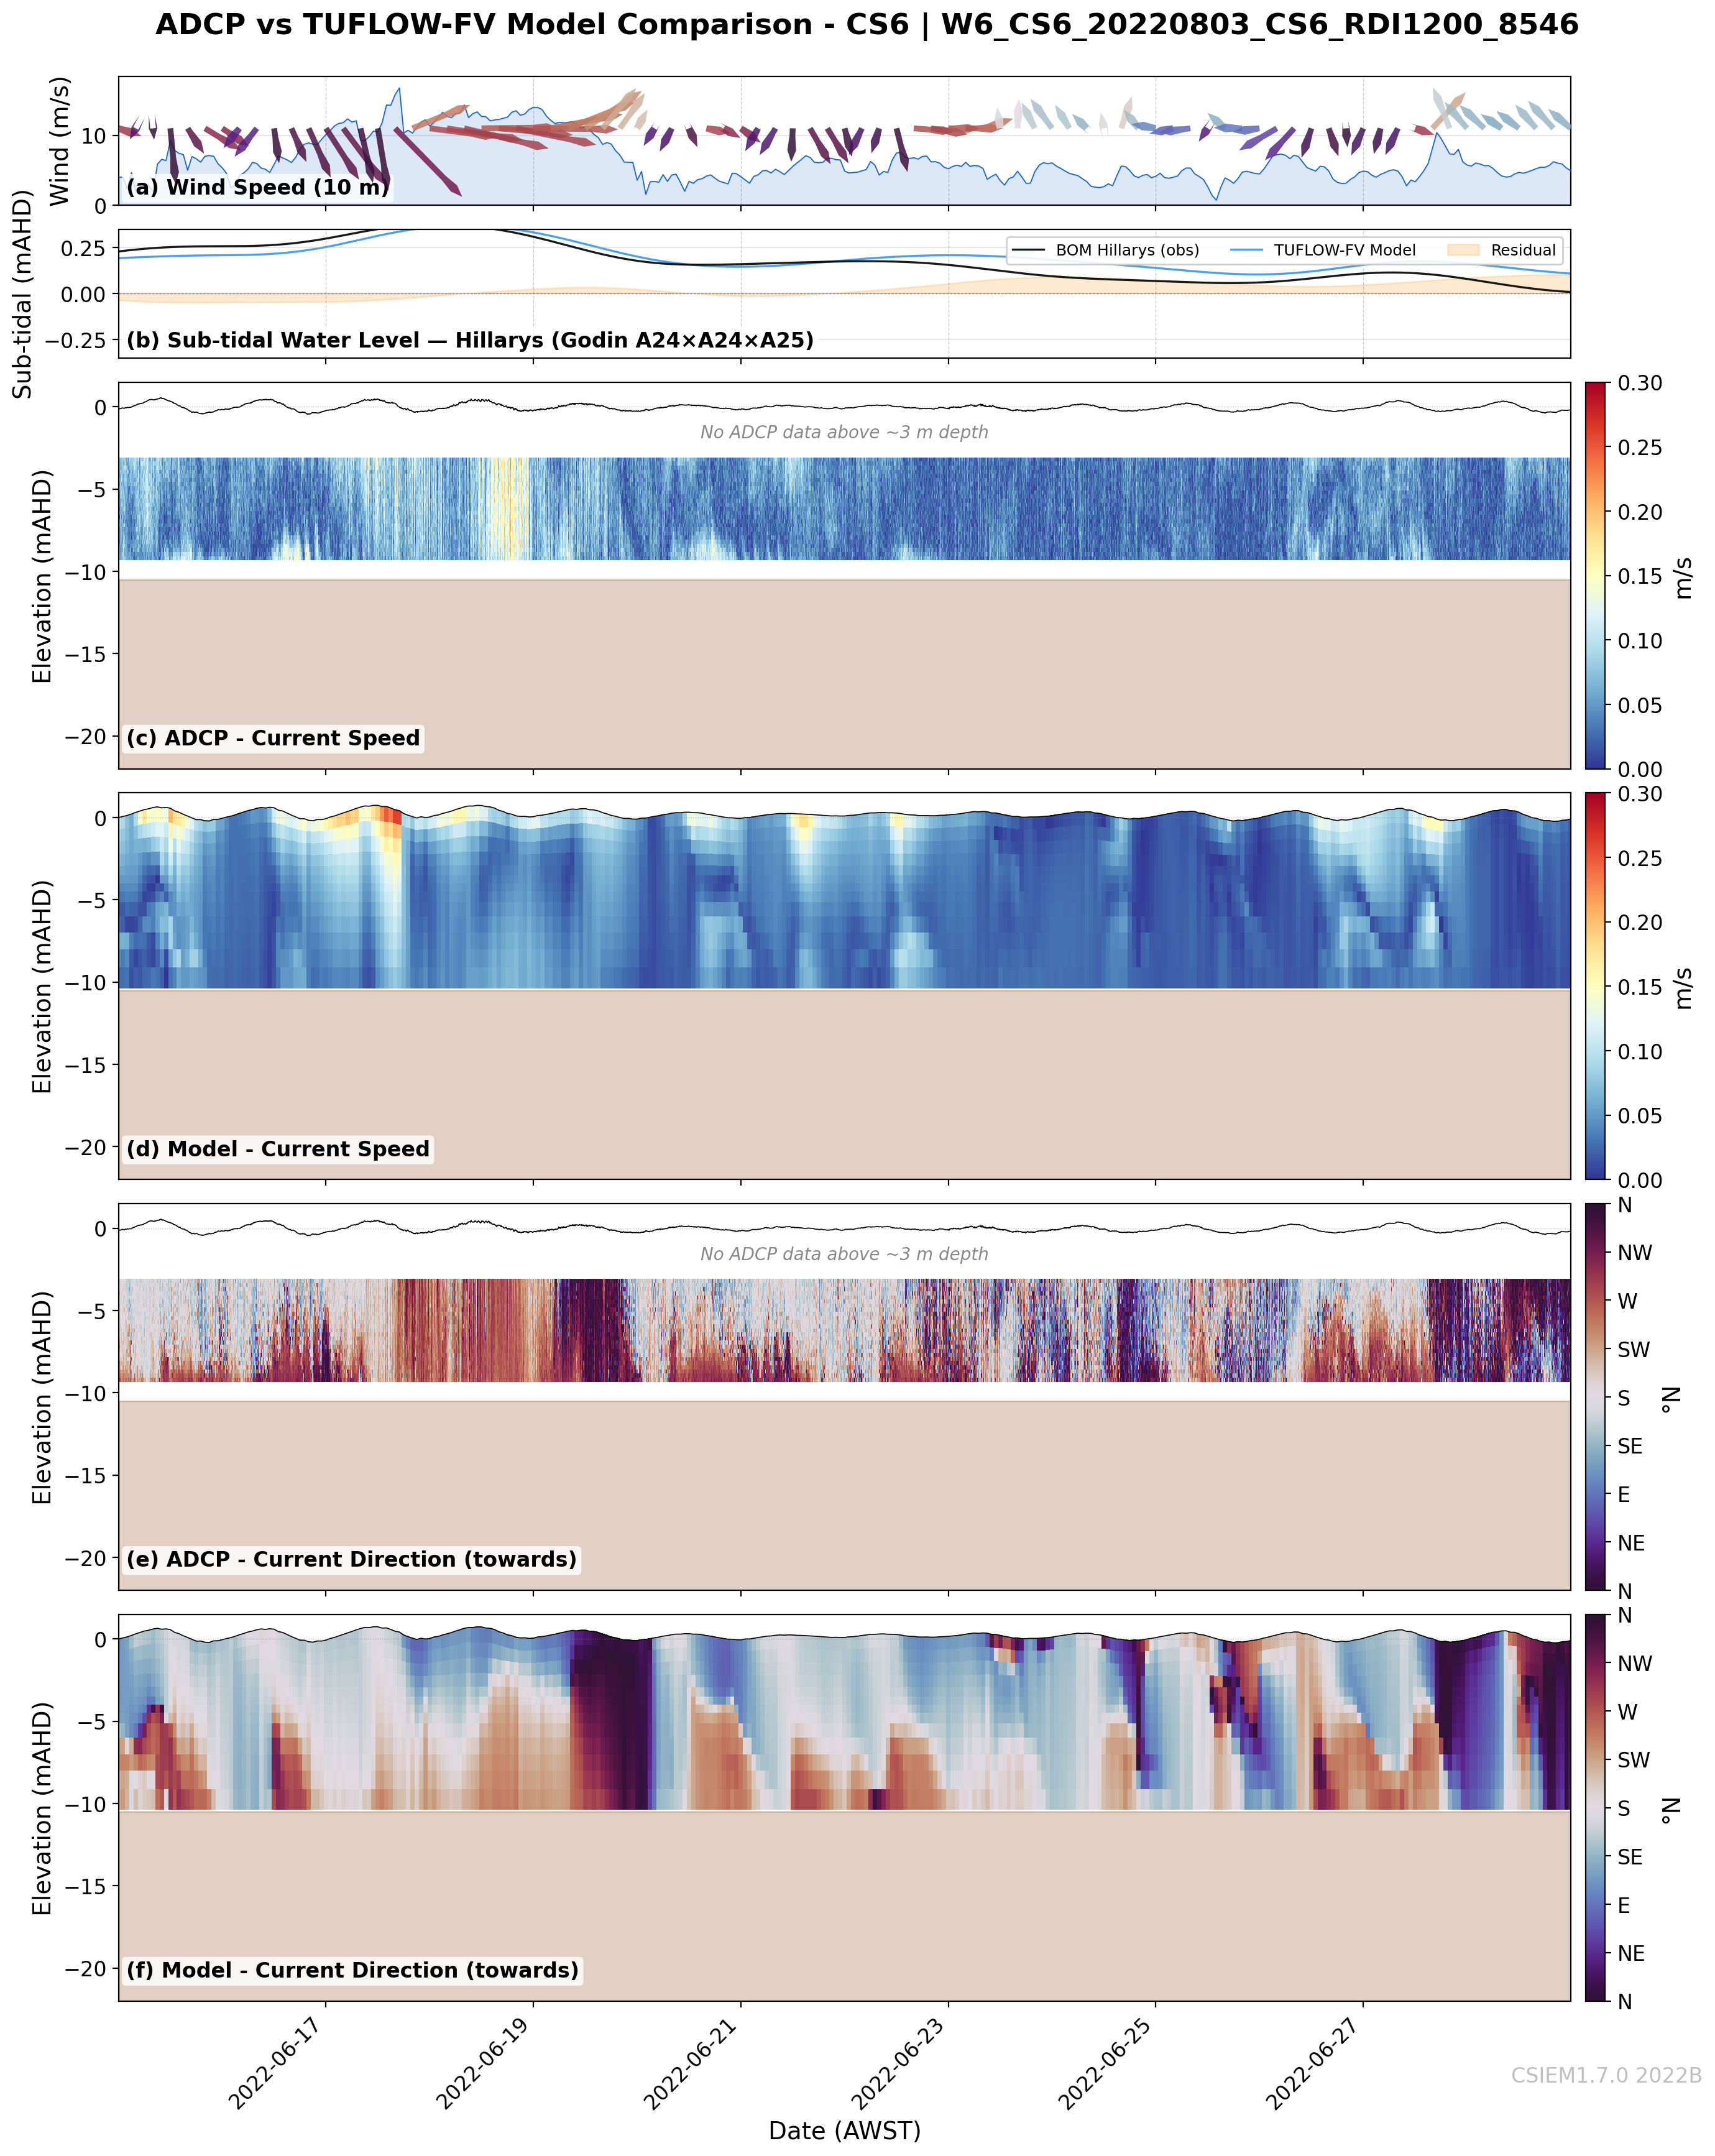
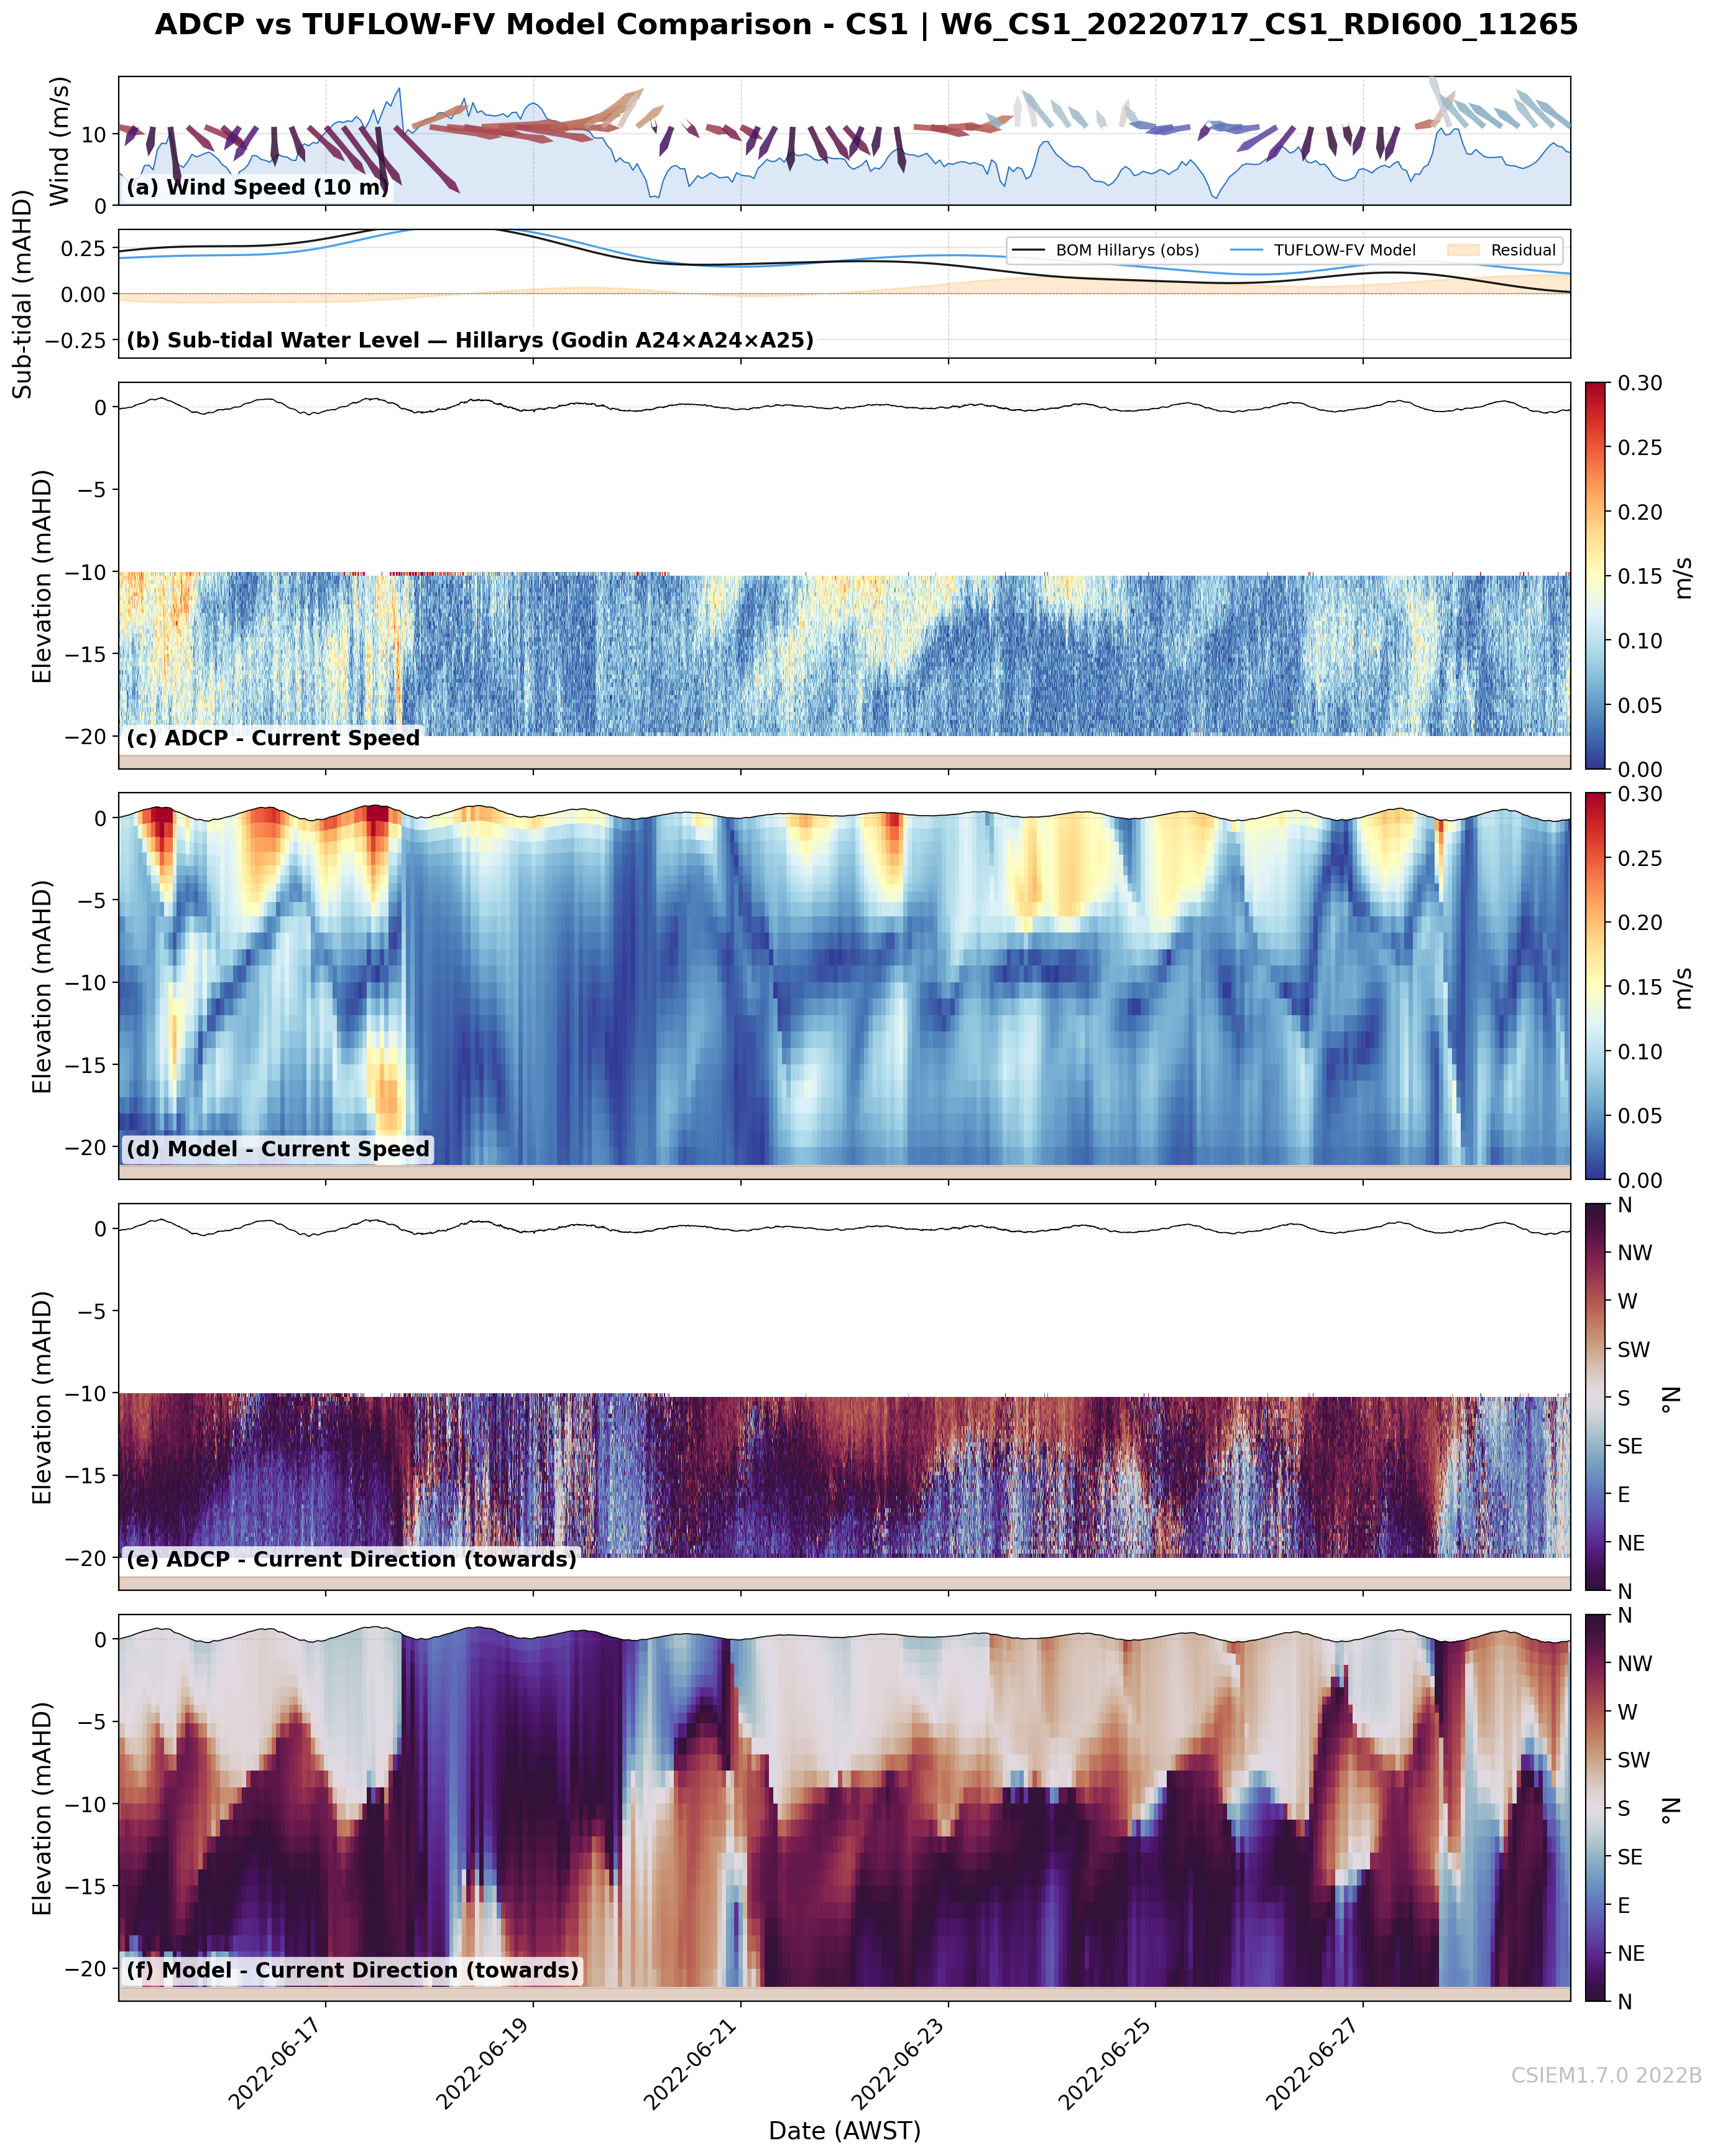
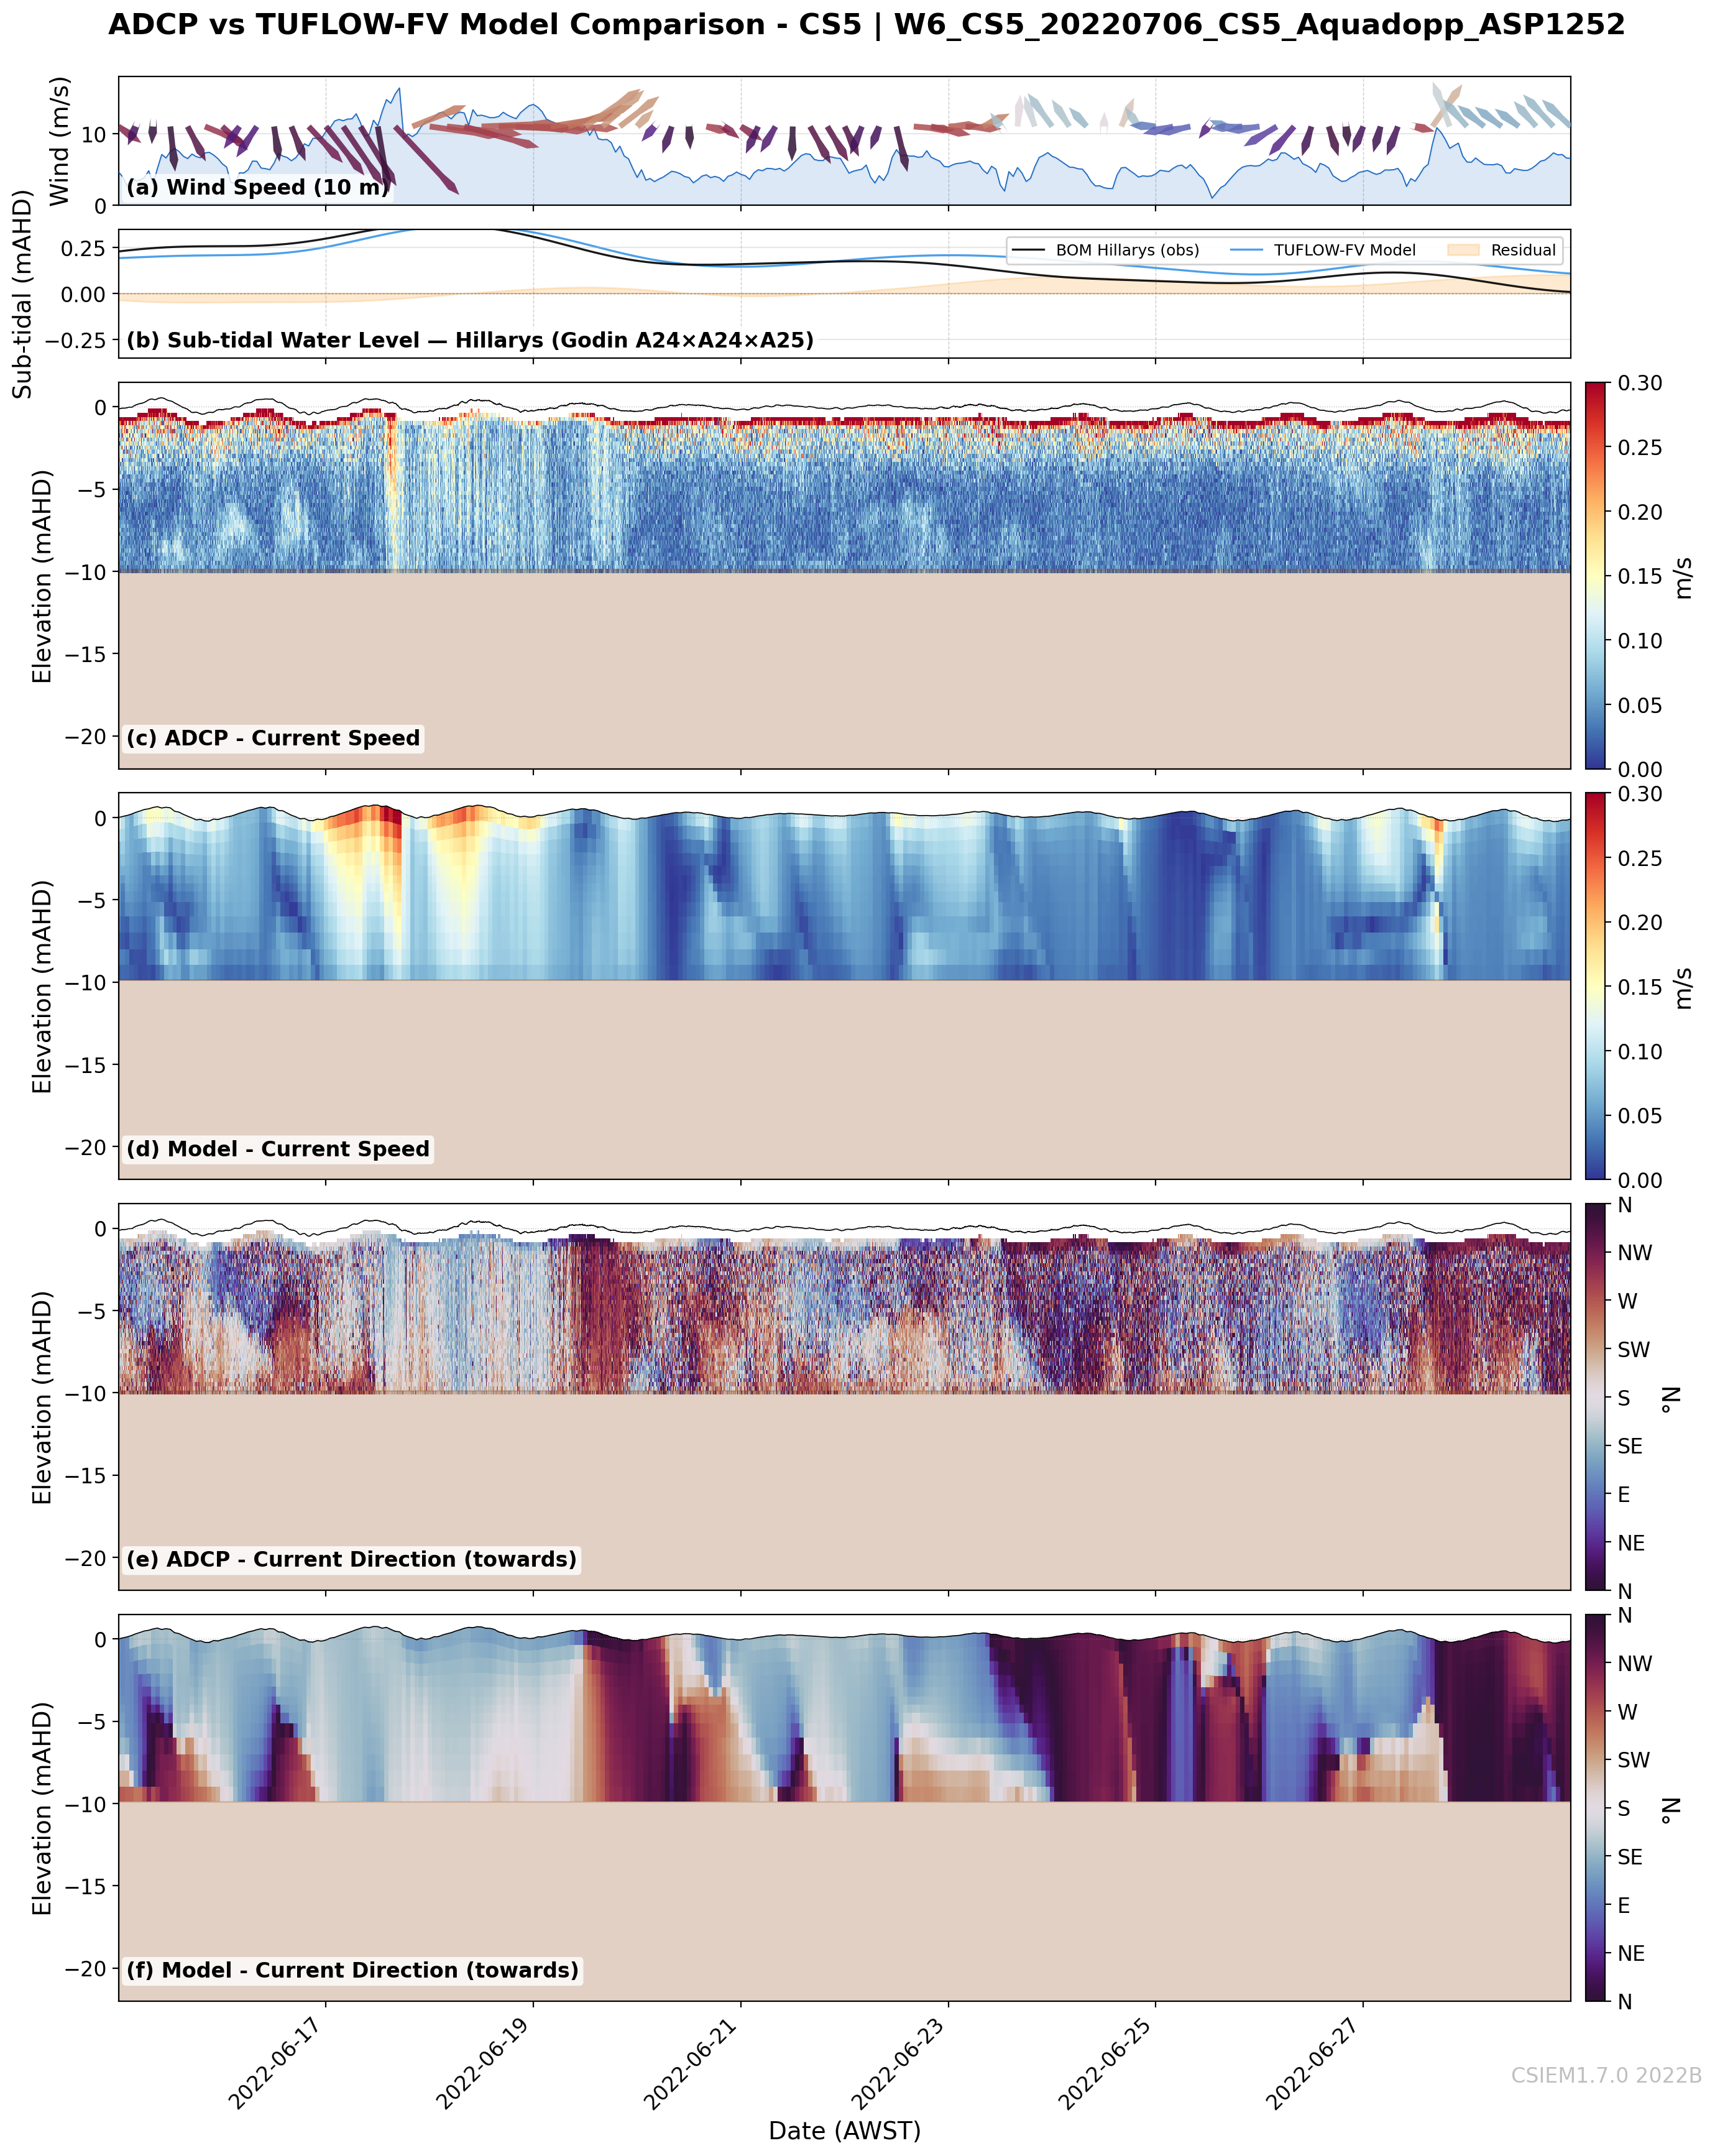
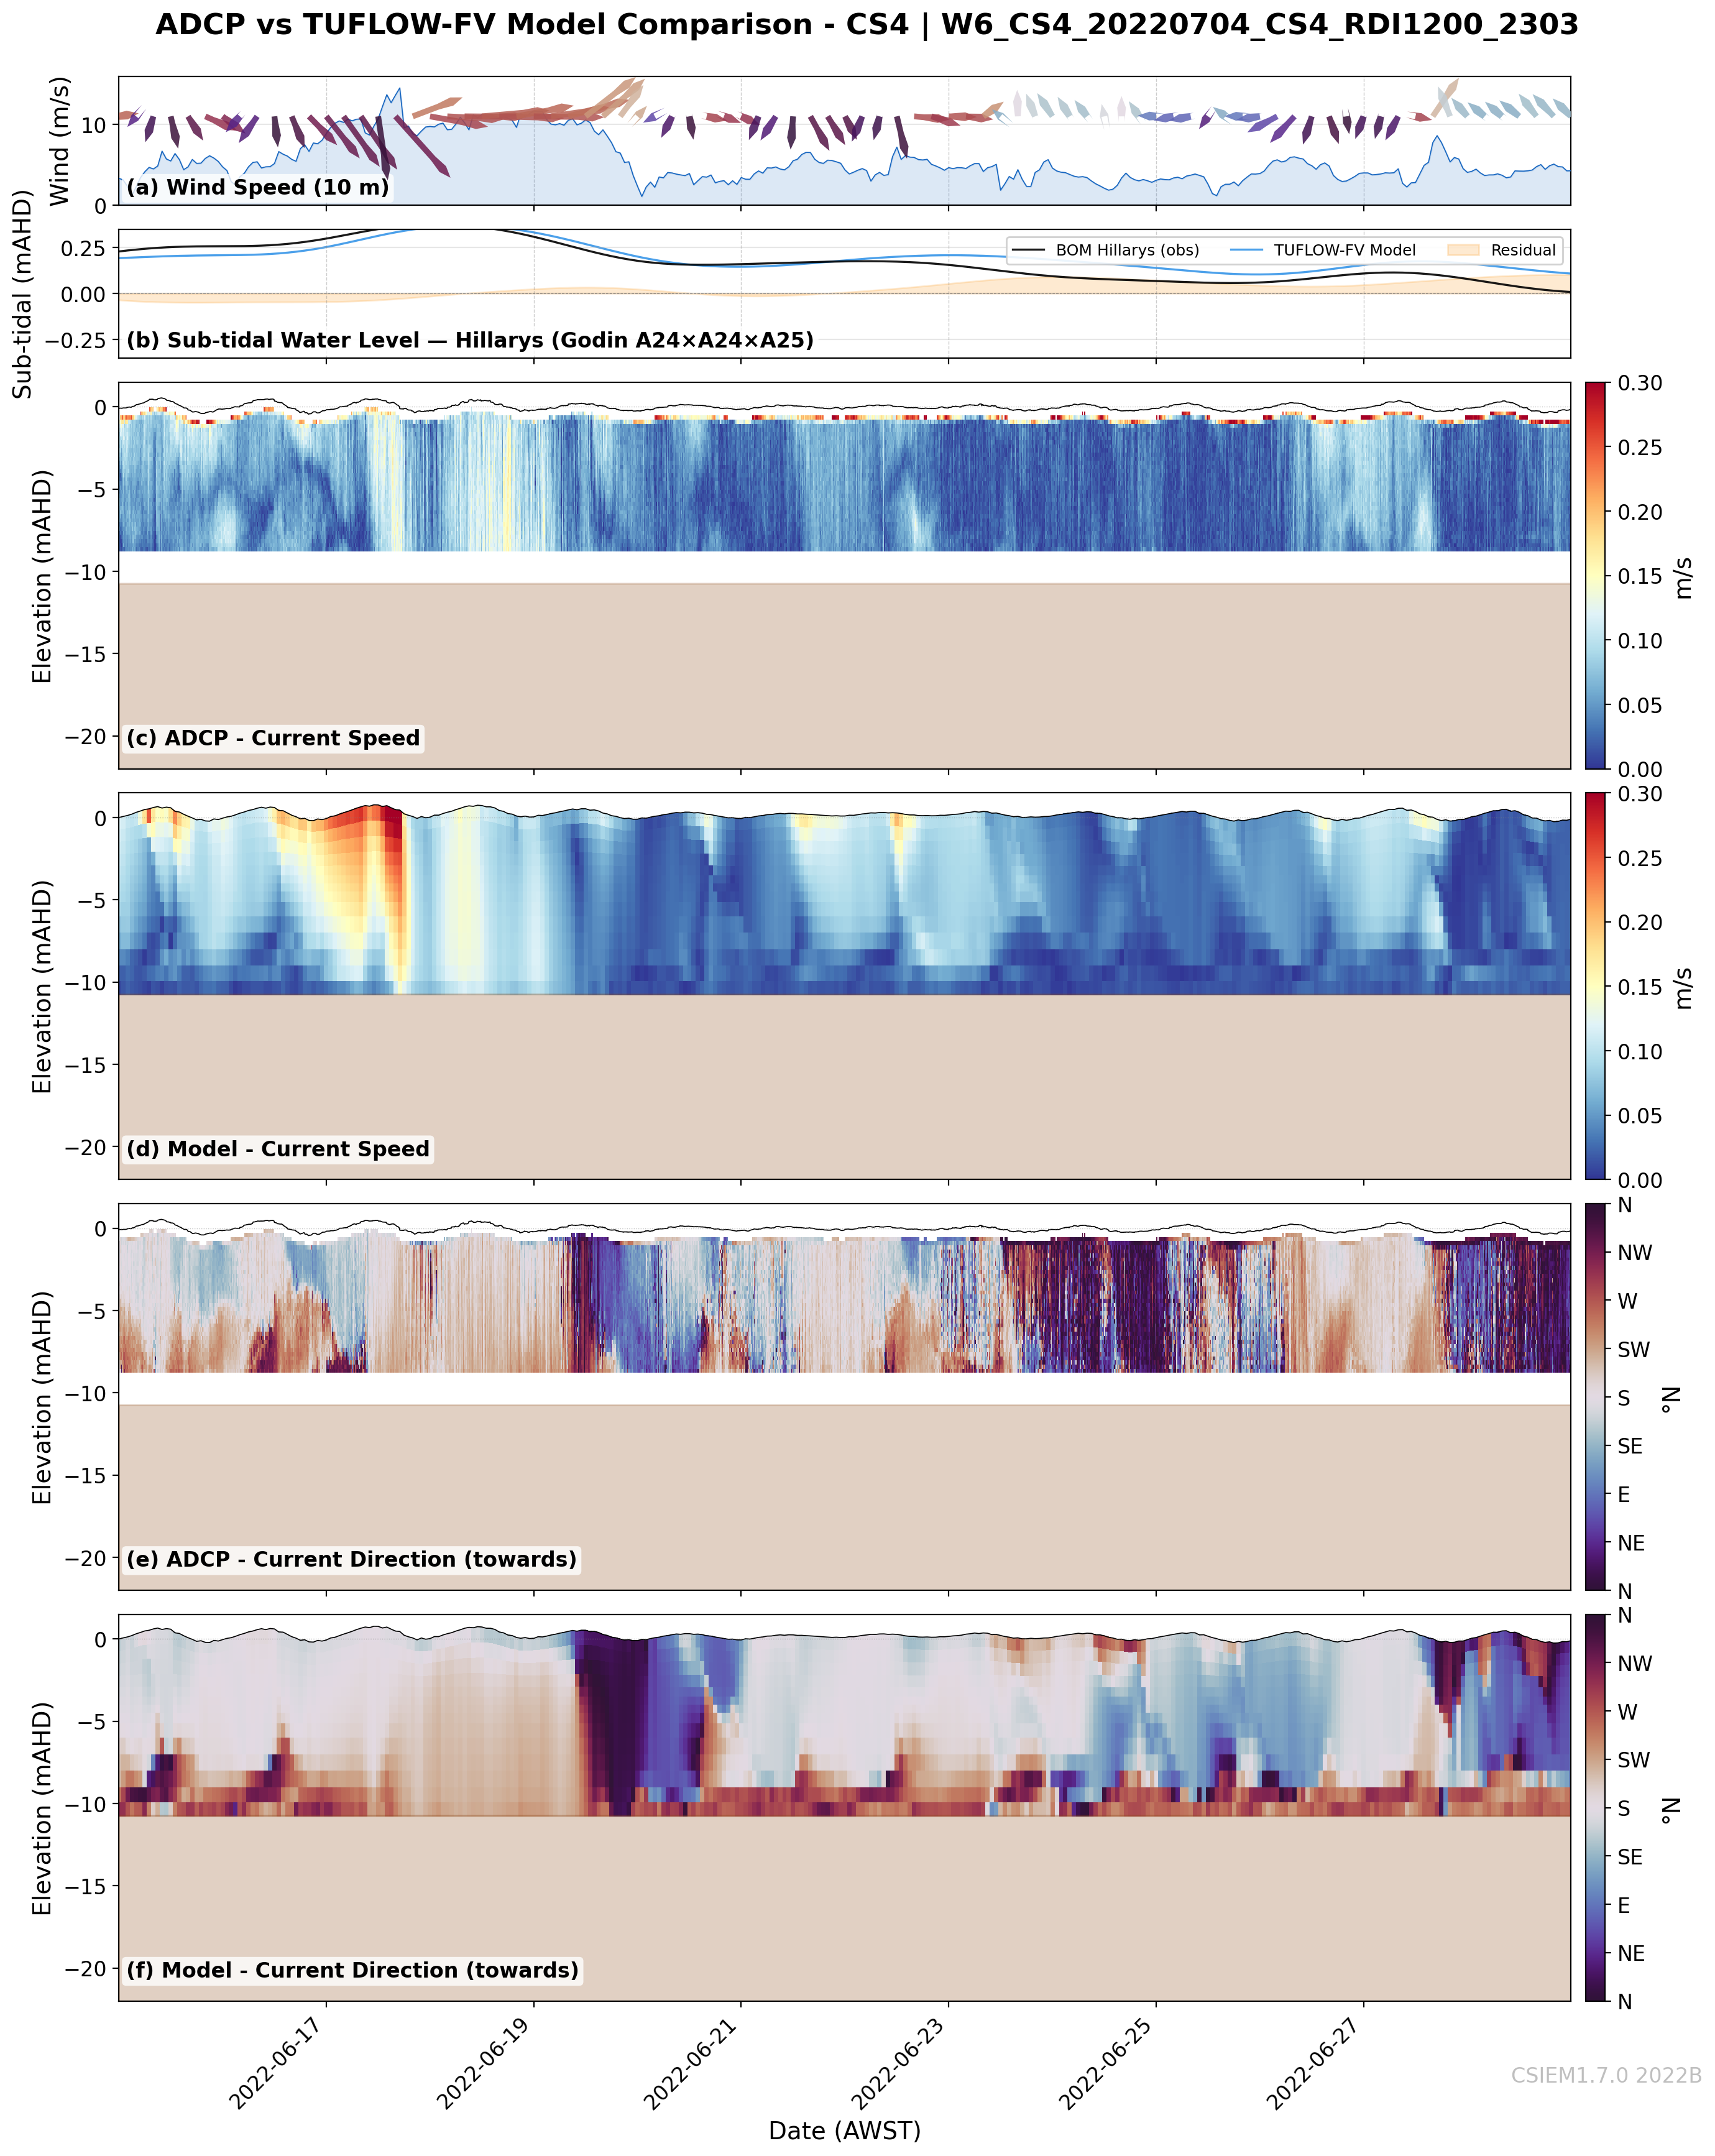
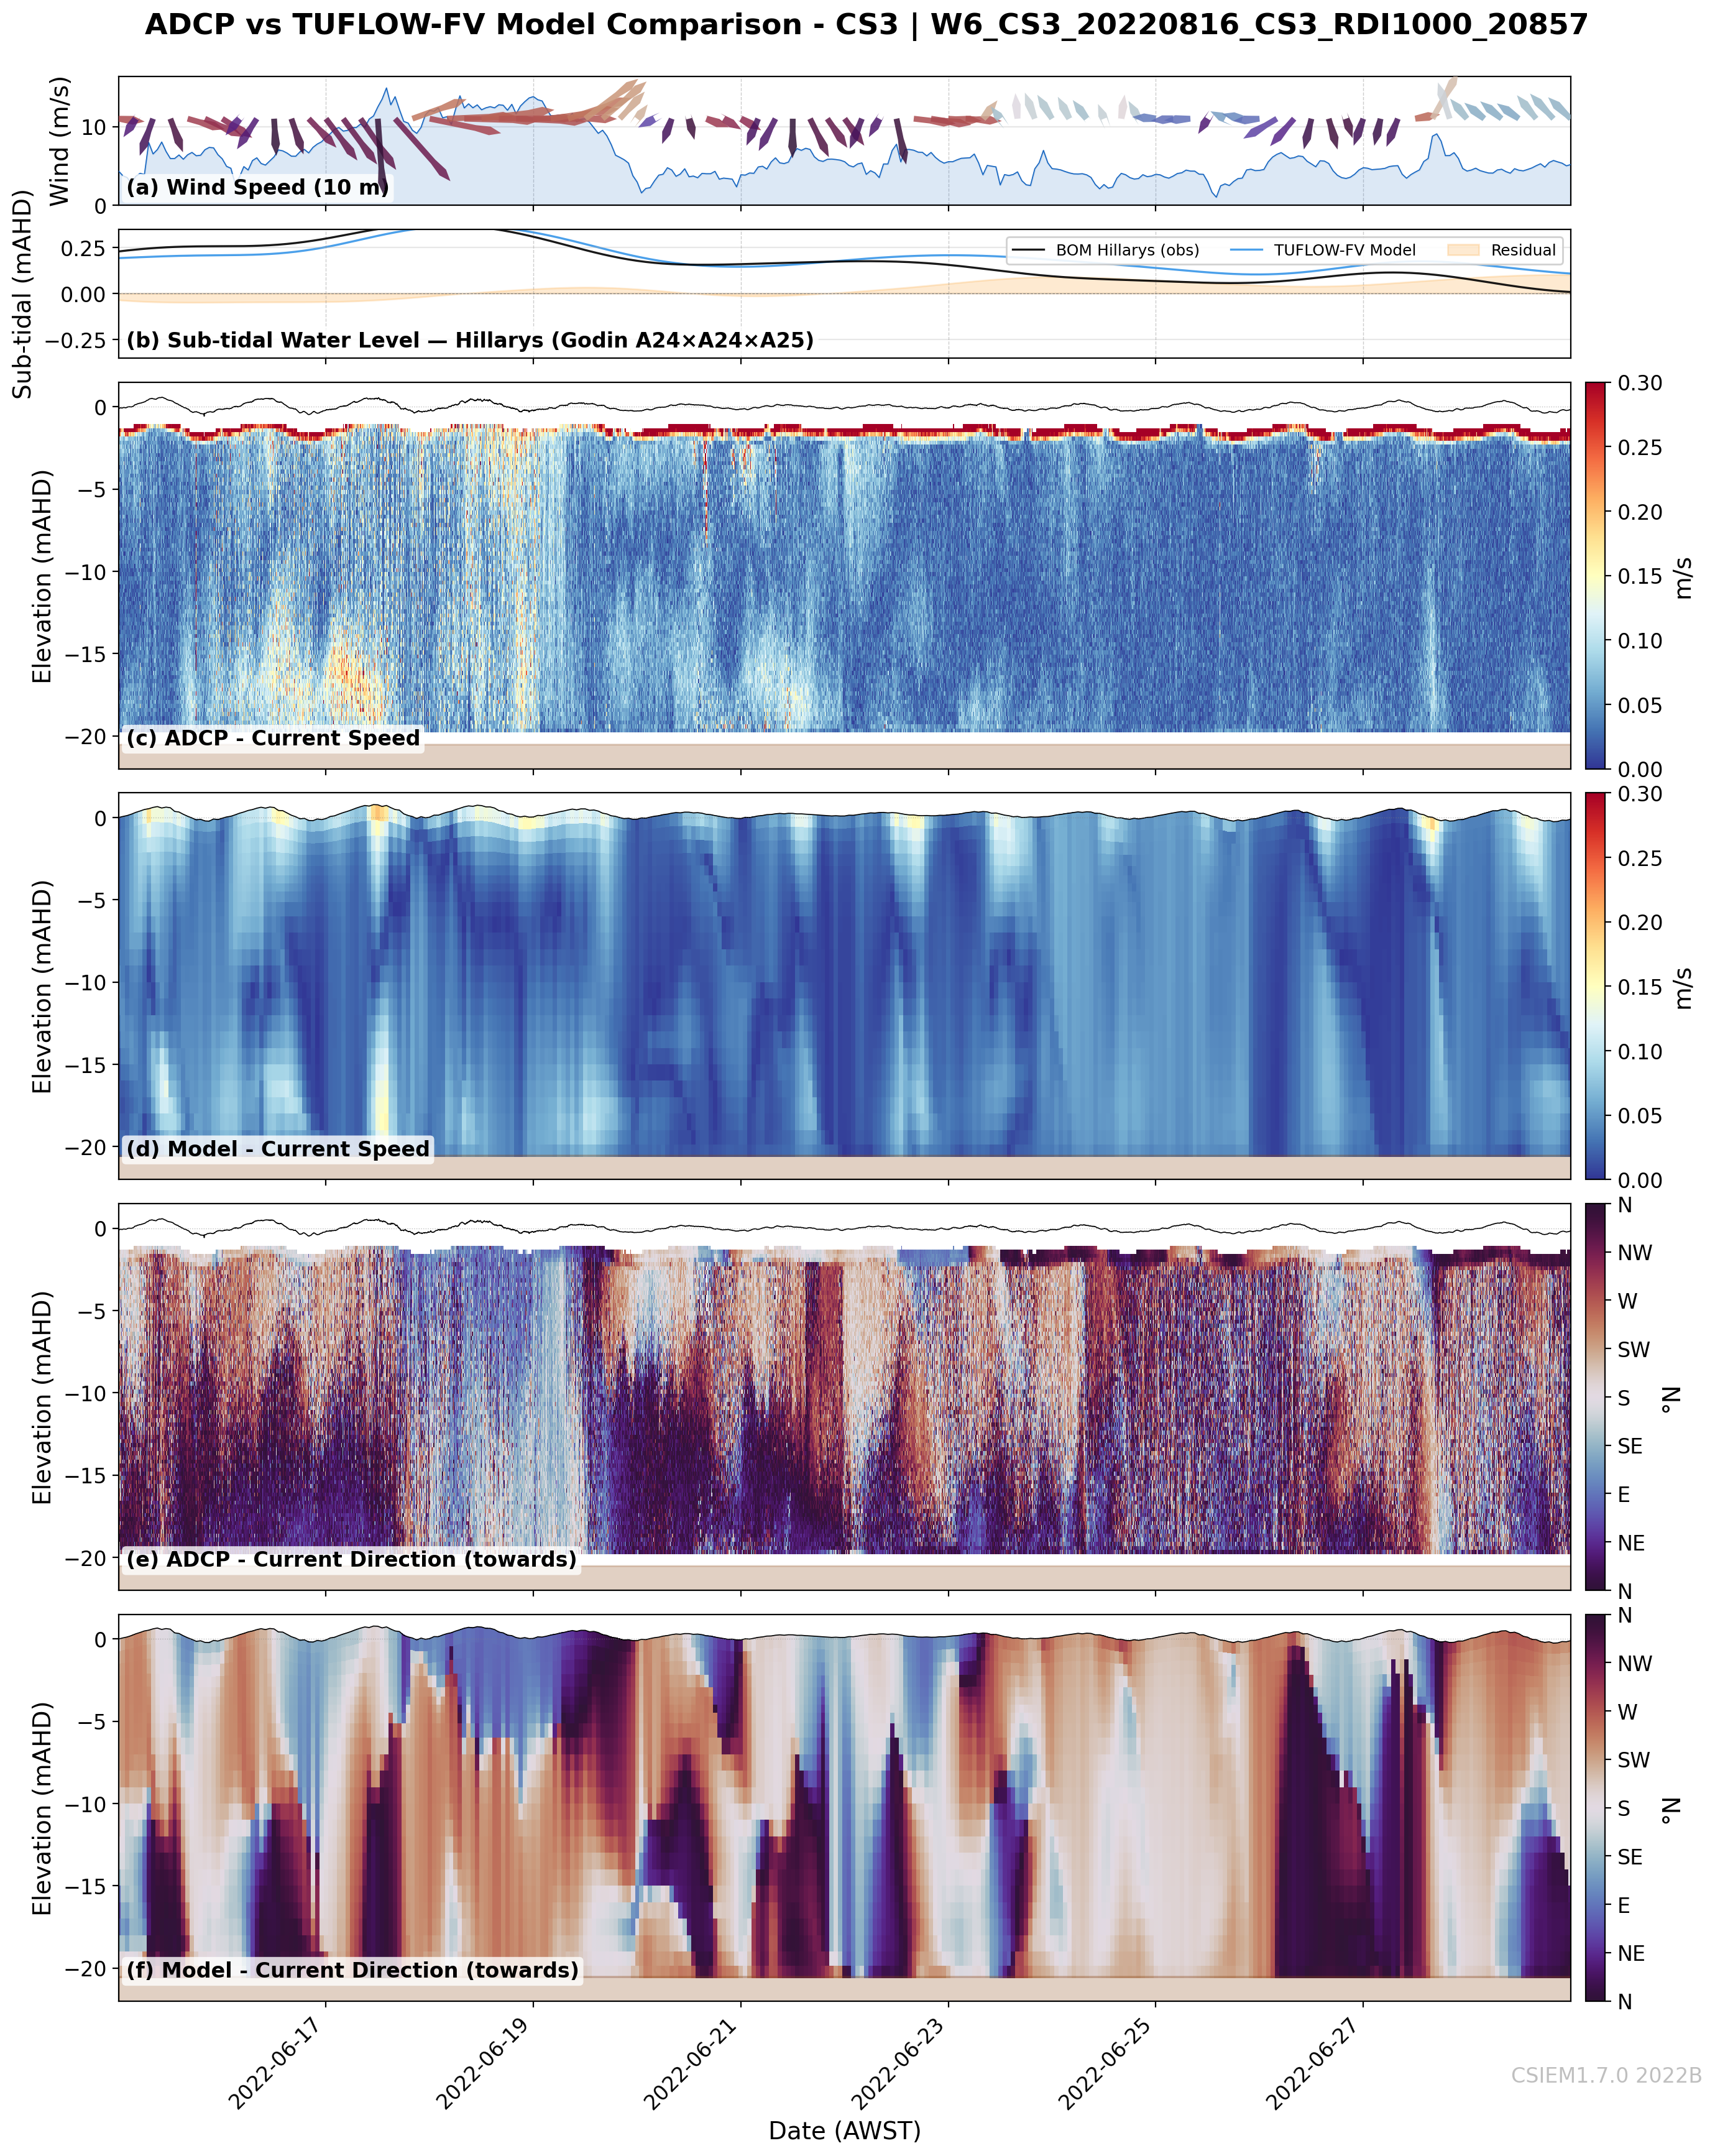
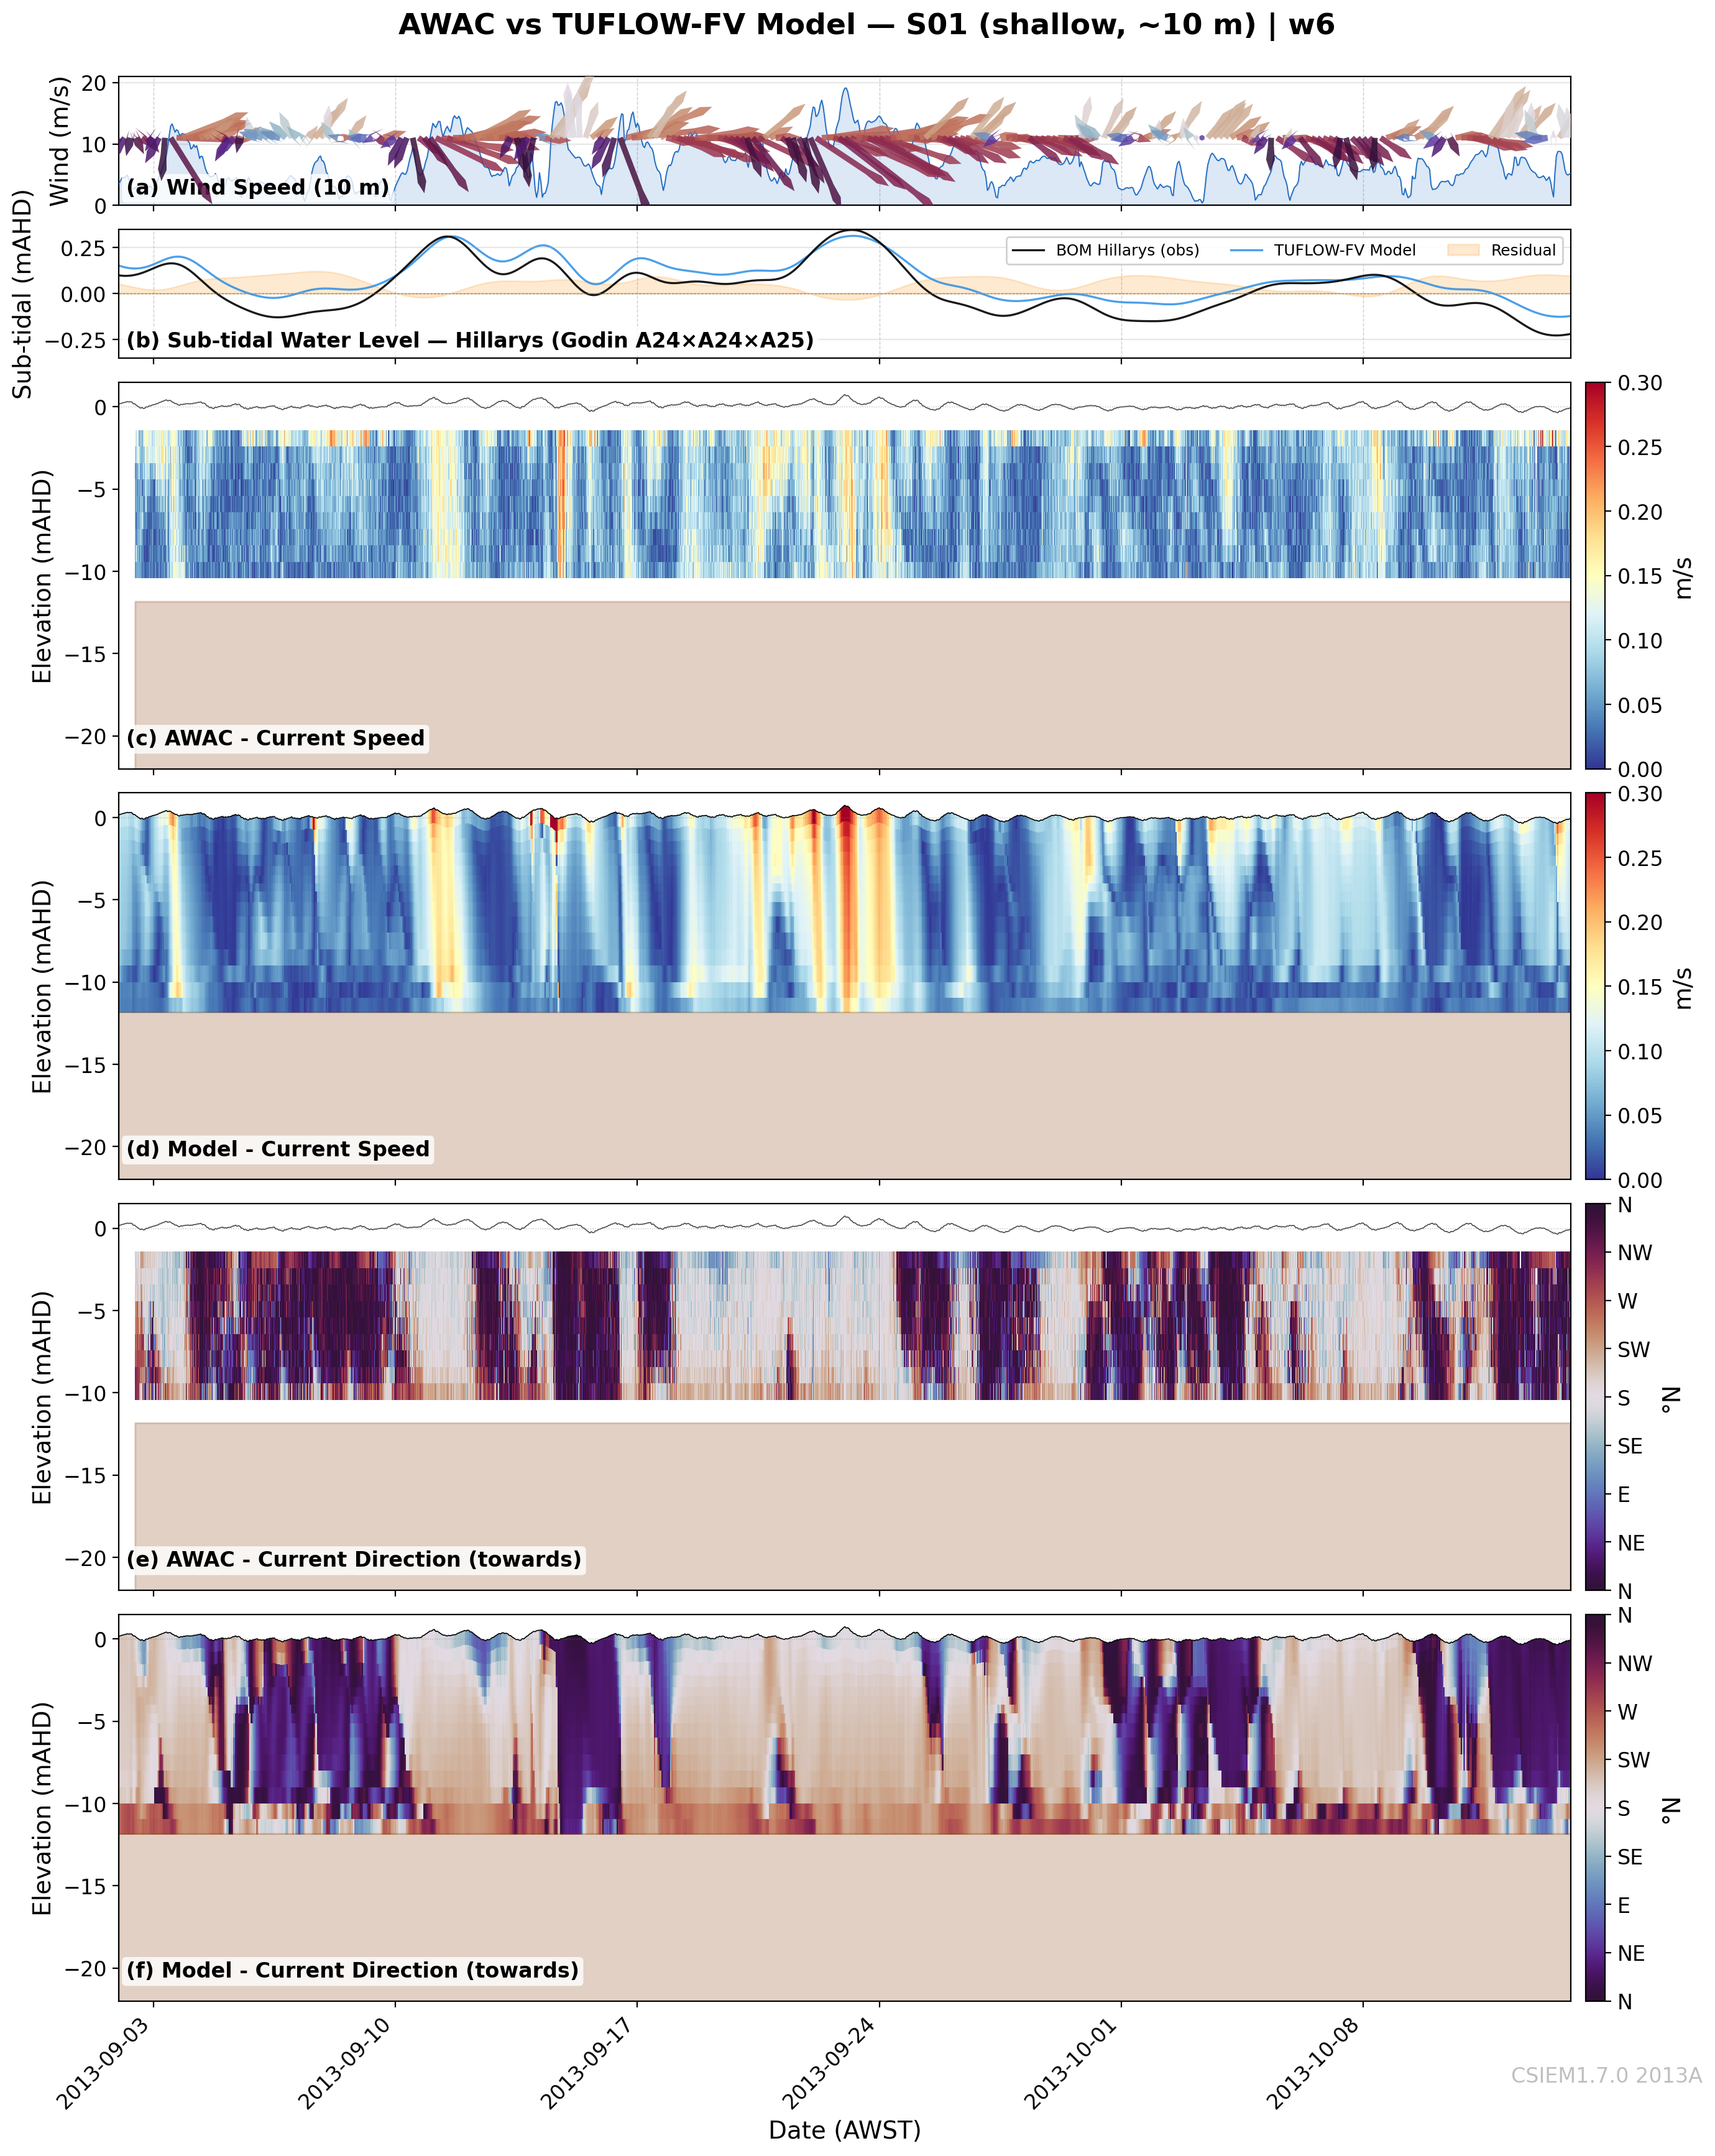
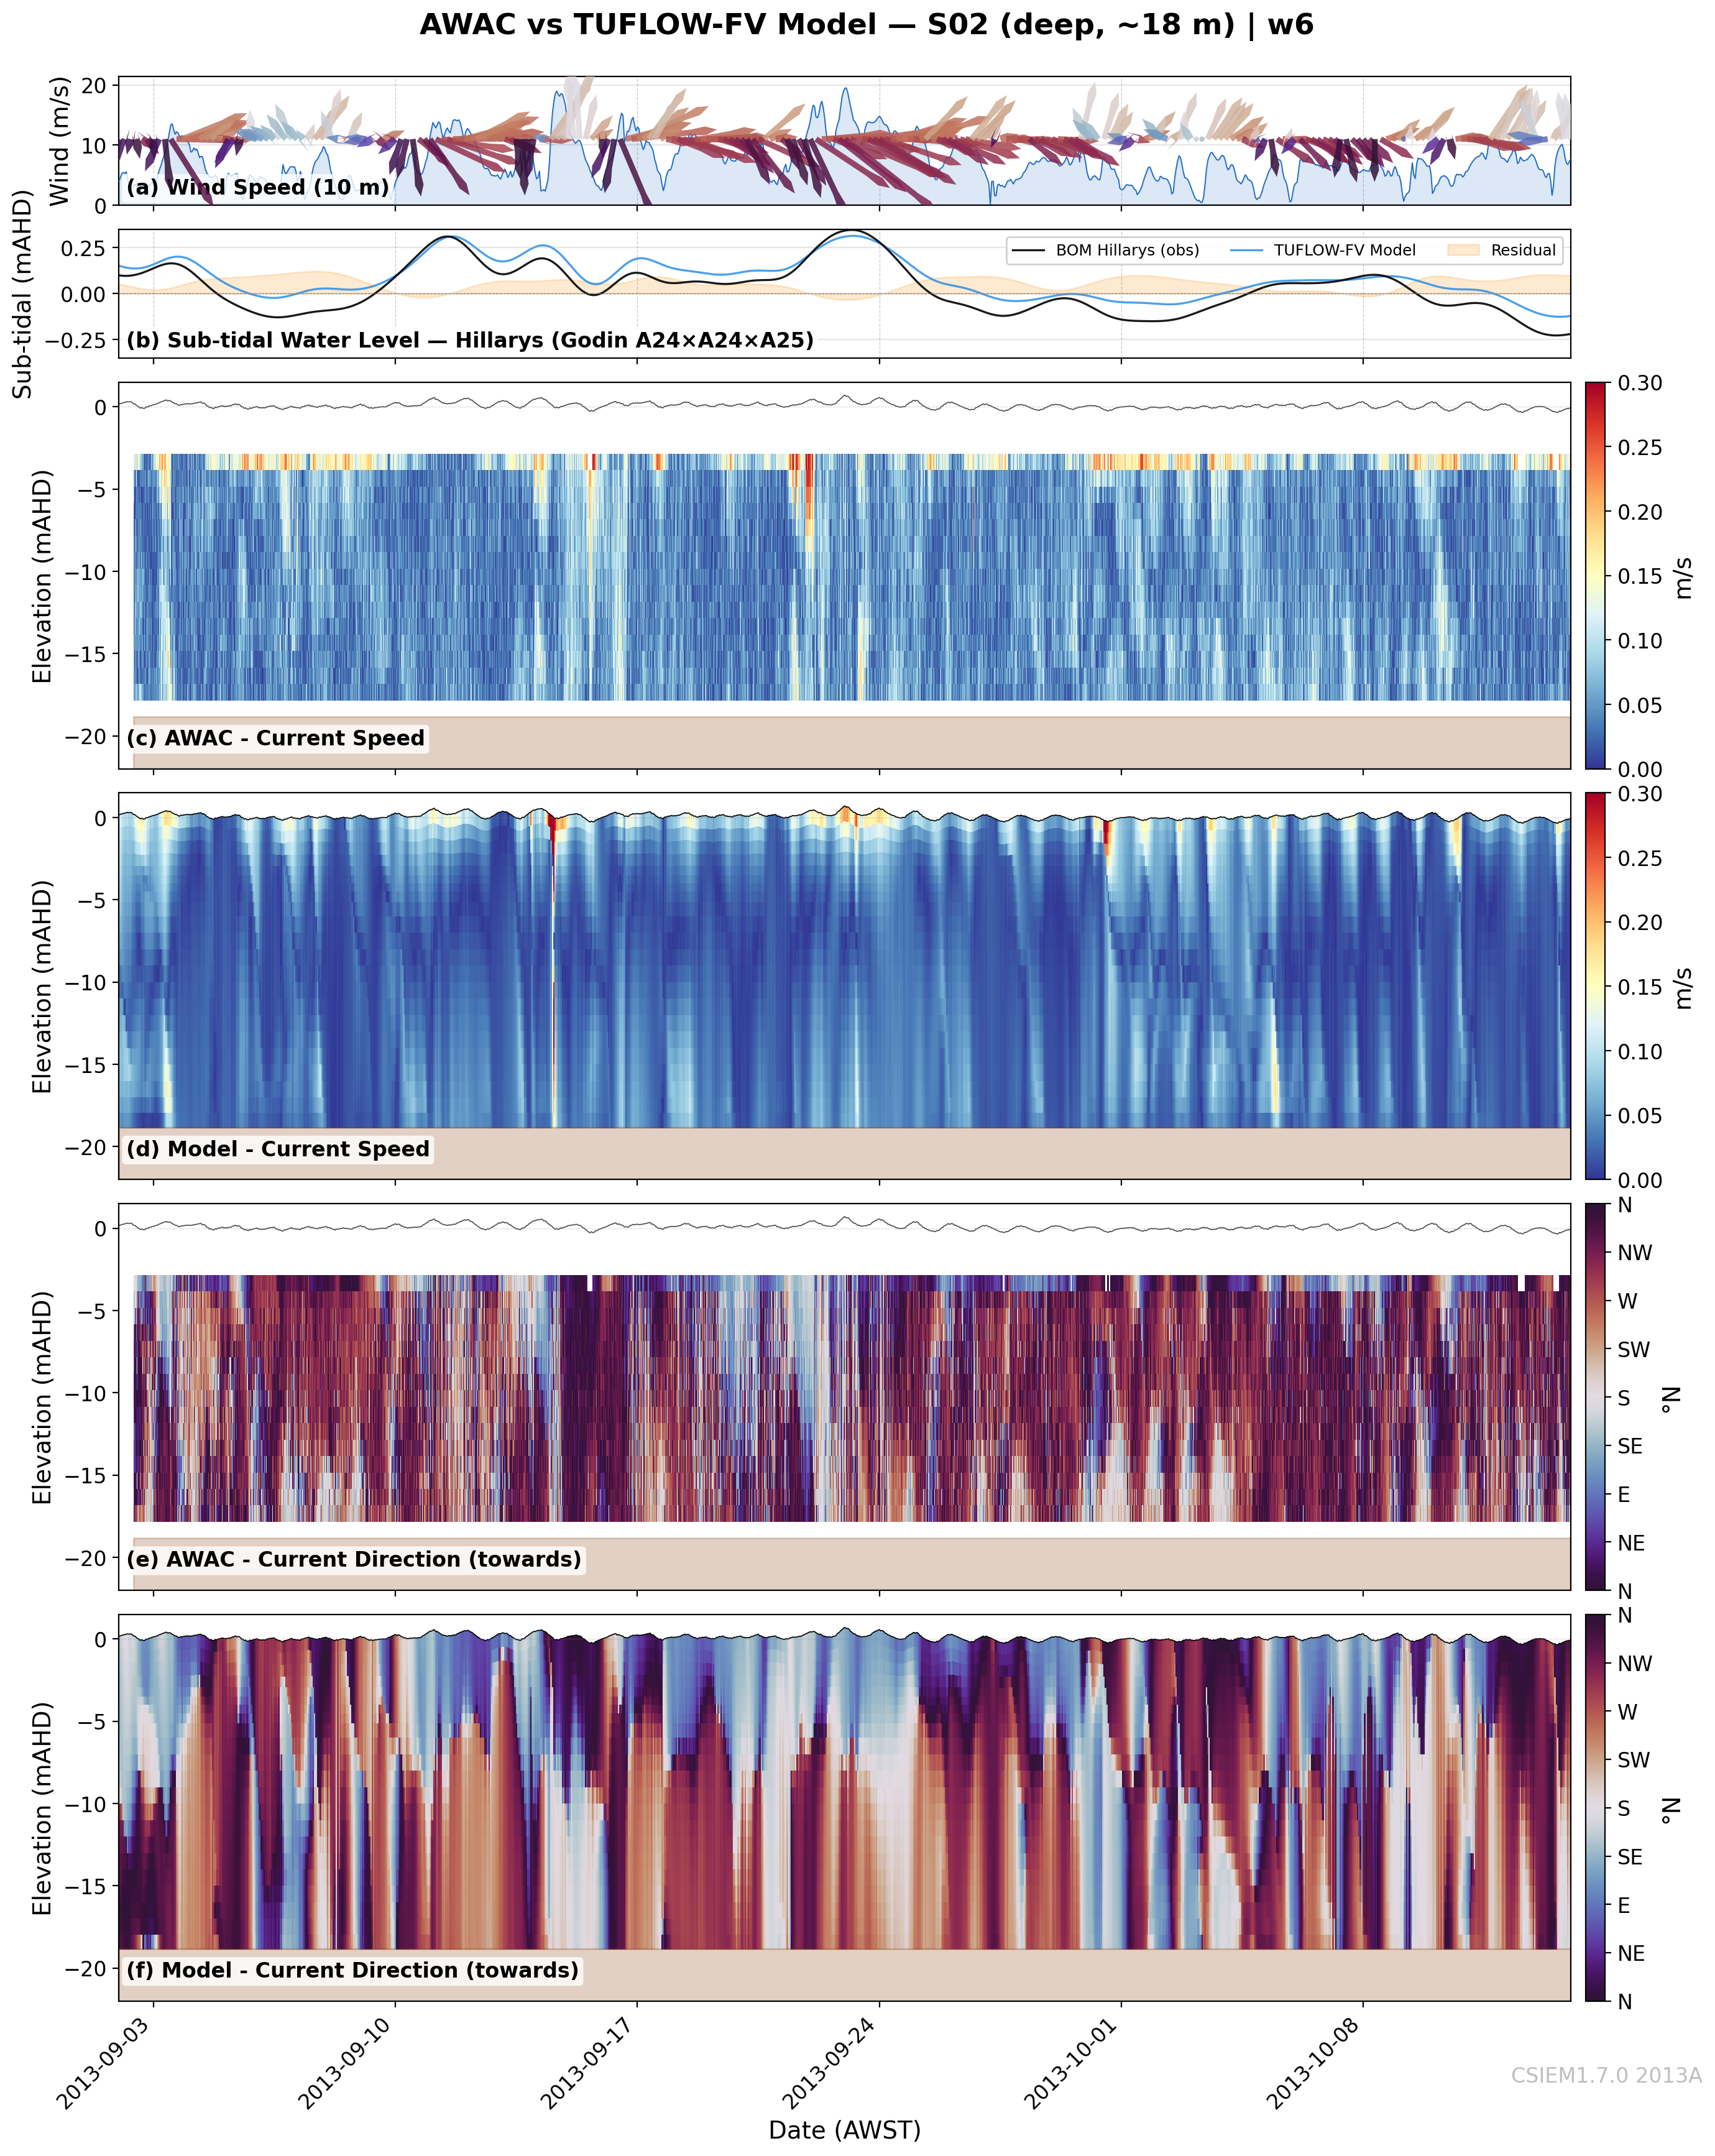
W6: Storm-Driven Renewal
Three sustained northerly episodes (33–47 h, 6–8 m/s); peak storm >15 m/s
Deep-water renewal inflows detected at CS1 (northern opening)
First window to clearly sample D’Adamo winter–spring storm-driven renewal regime
Model notes: Model captures both storm intensification and post-storm recovery of vertical shear. Observed near-bottom speeds during calm aftermath suggest stronger deep renewal inflow than model produces at CS1. CS3 storm-driven bottom-intensified current pulses captured in timing but model vertical structure smoother than observed. CS6 shows different recovery pattern to basin sites — directional variability remains broad, reflecting open exposure to regional shelf processes.
CS6 (11m) — Owen Anchorage
CS1 (20m) — Basin (north)
CS5 (11m) — Shelf (north)
CS2 not available
CS4 (11m) — Shelf (south)
CS7 not available
CS3 (20m) — Basin (south)
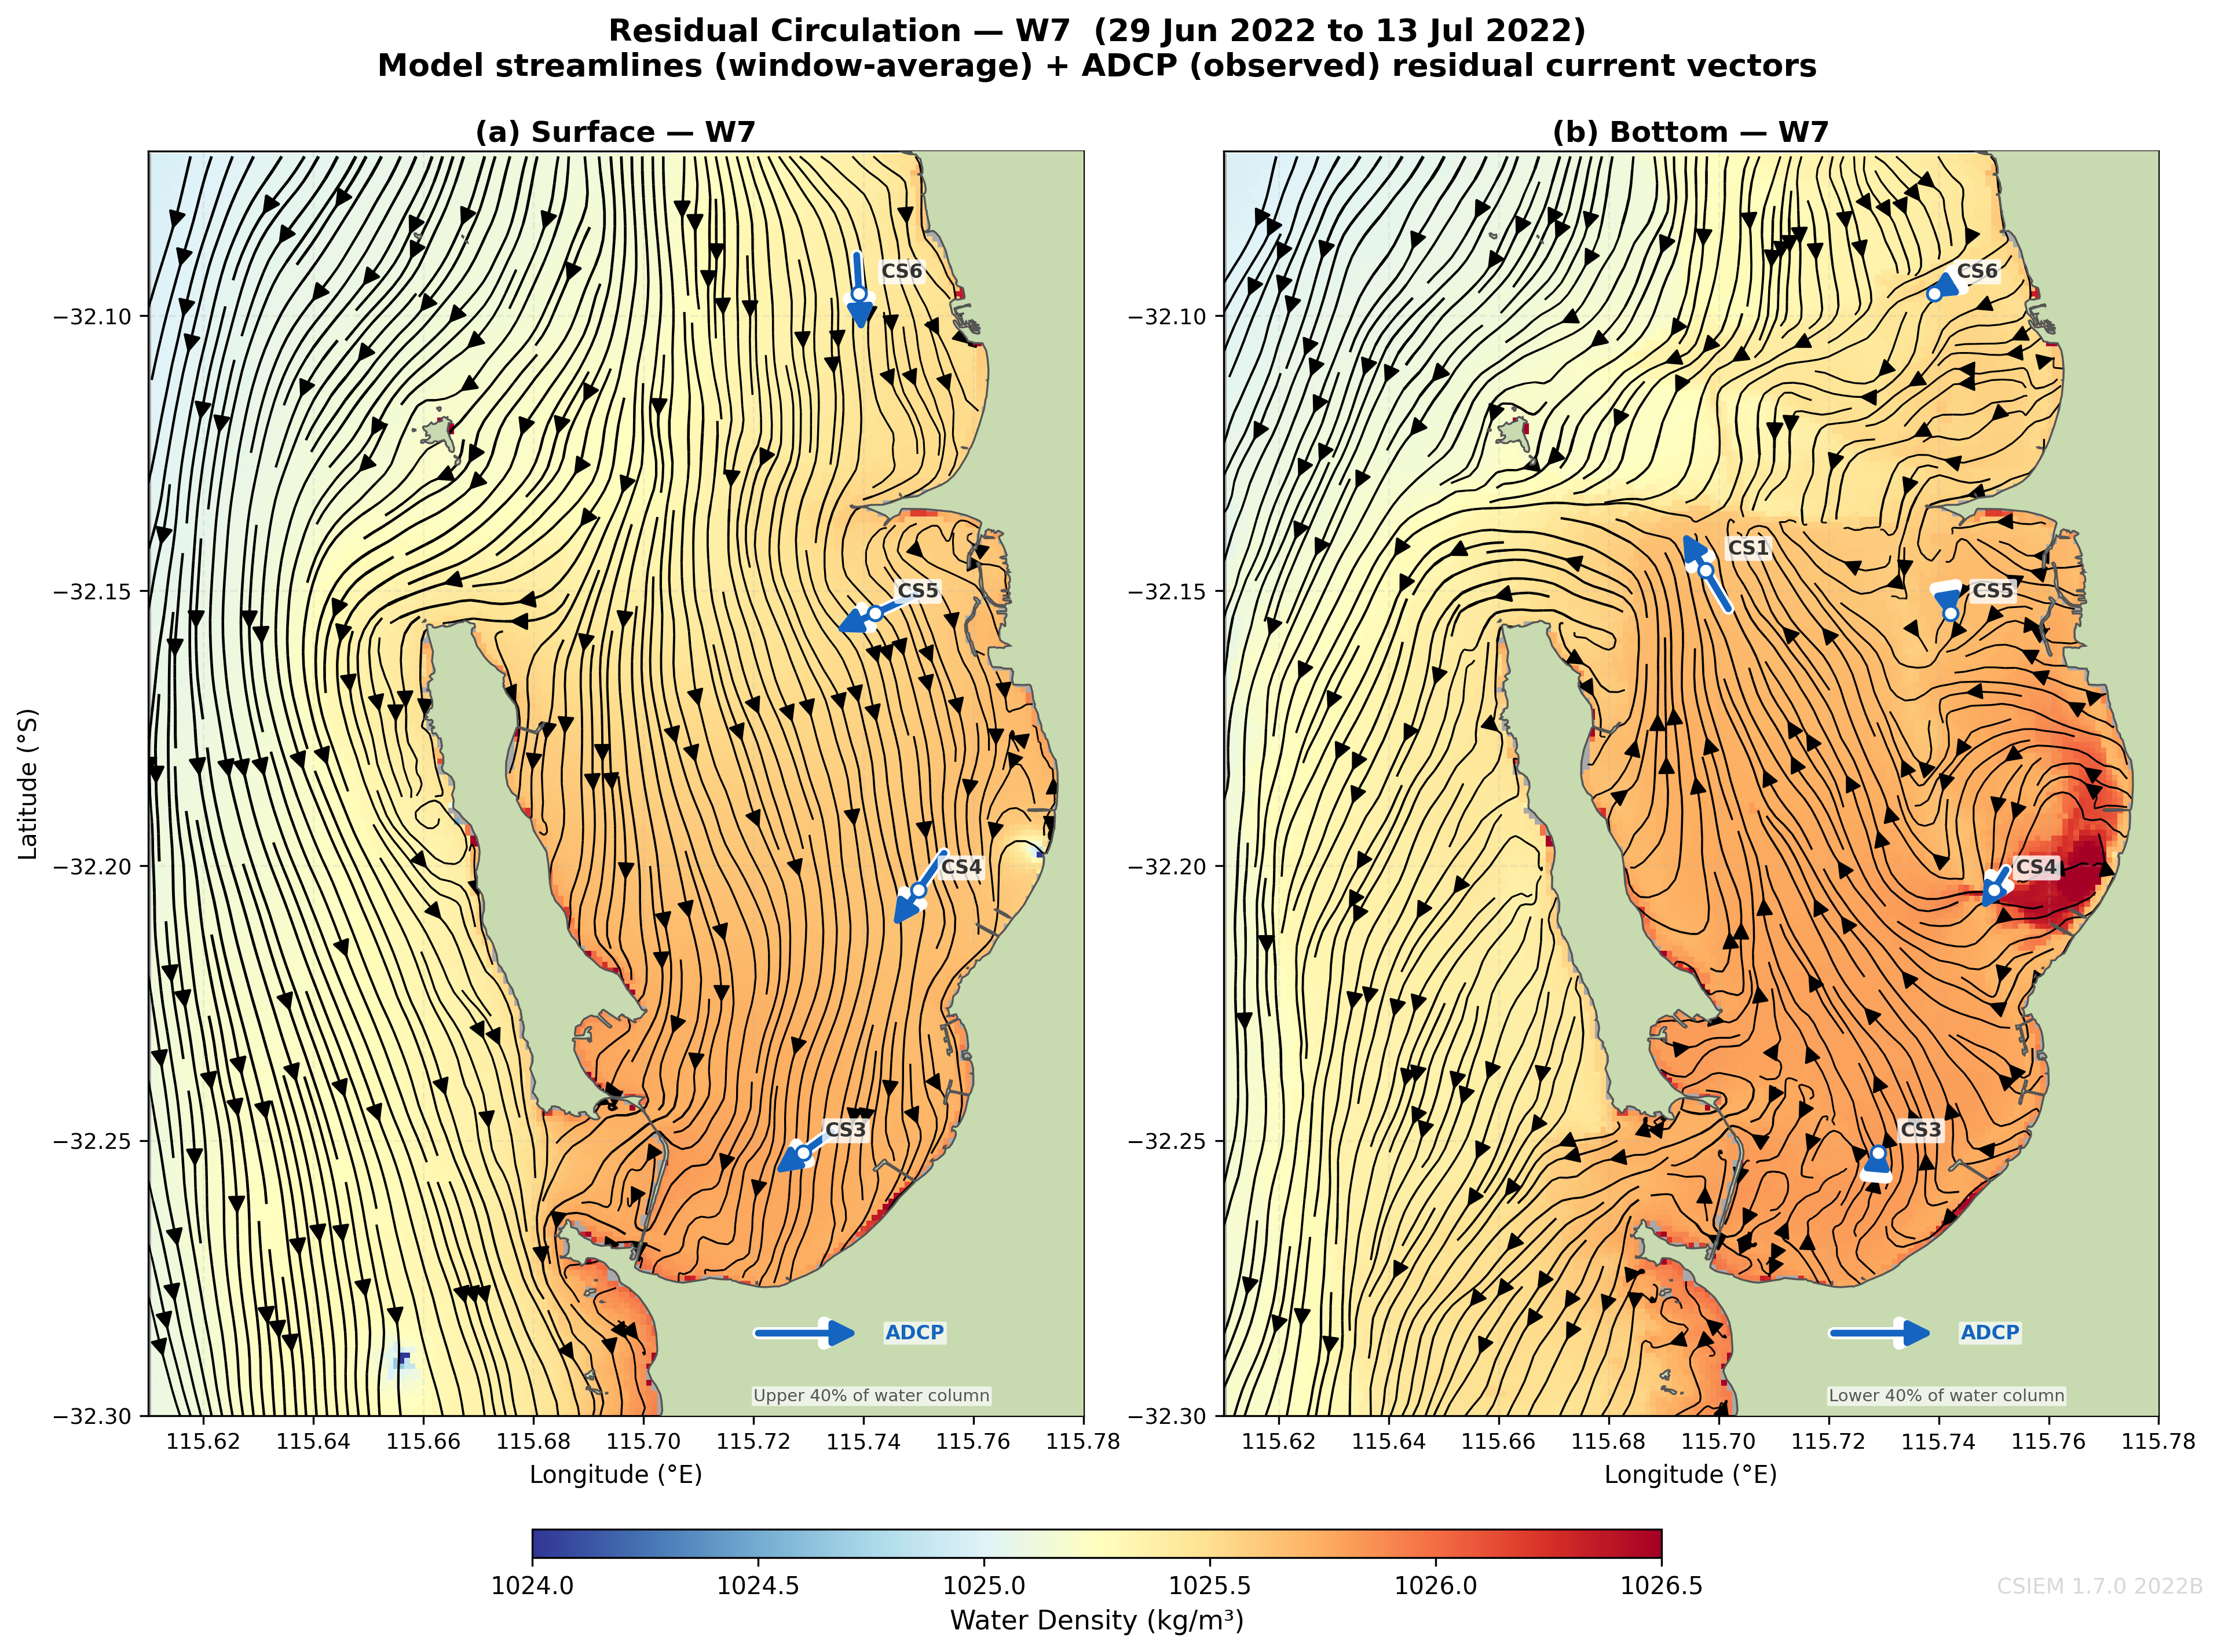
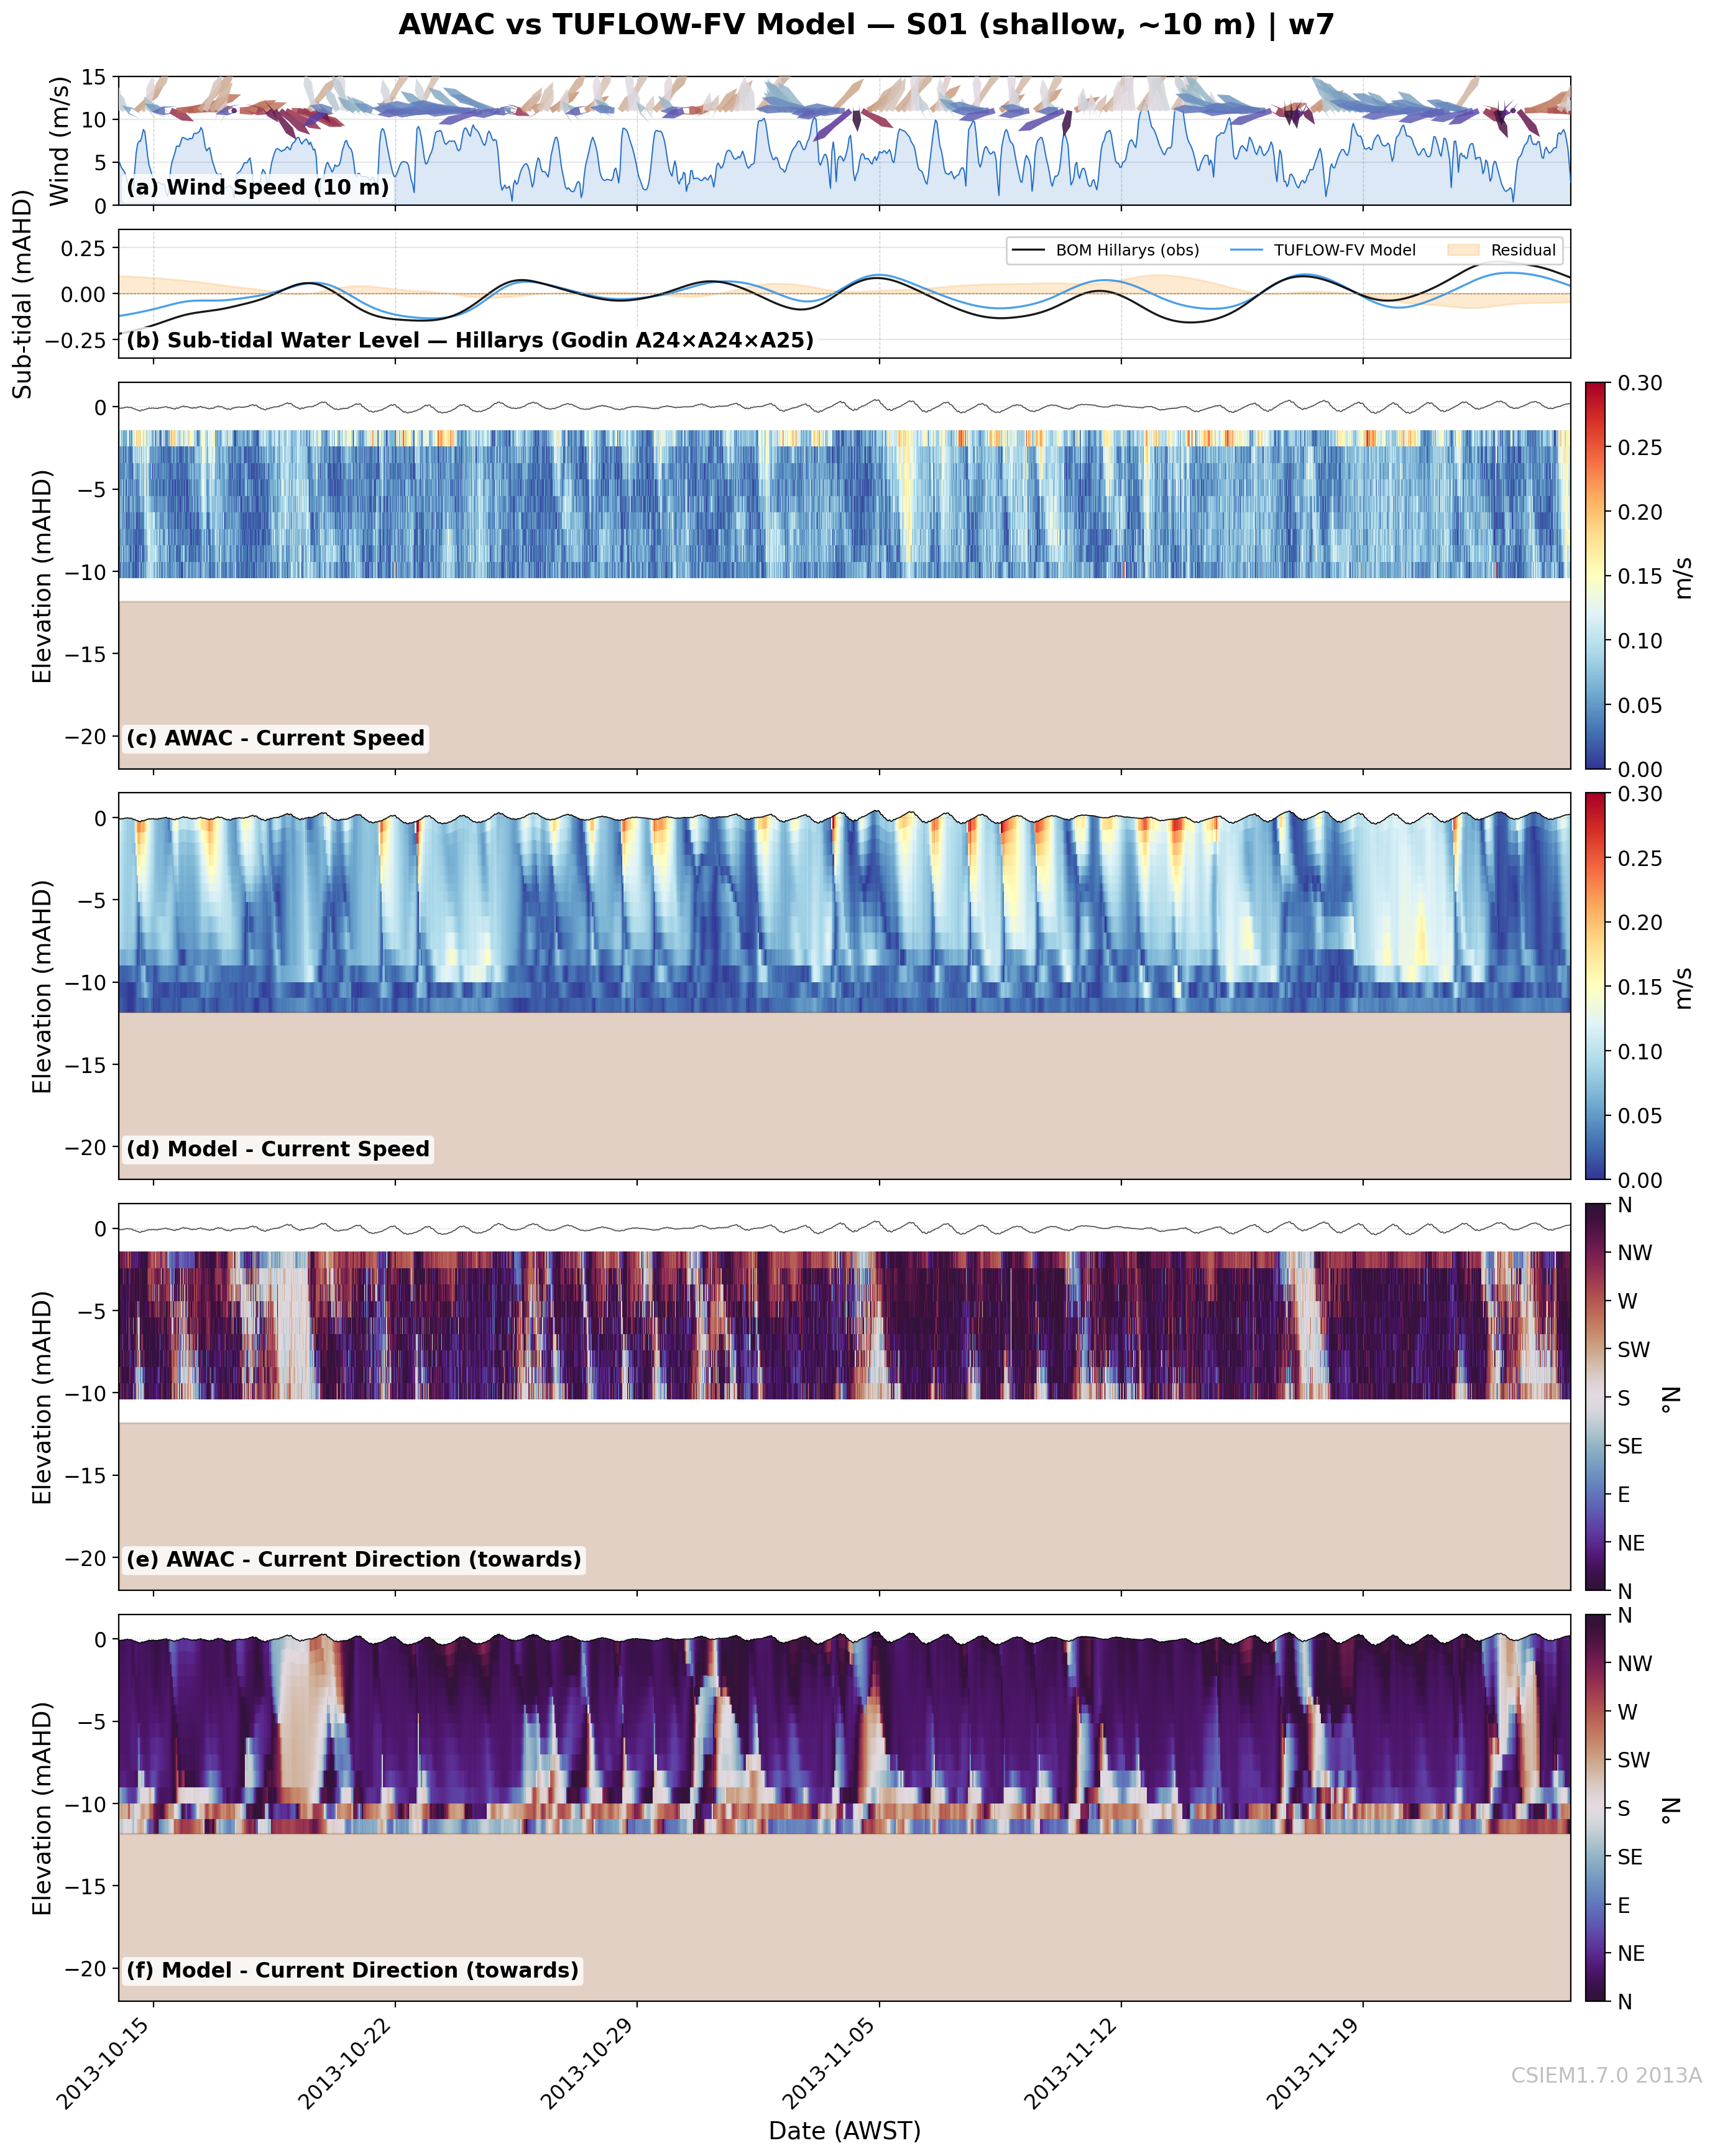
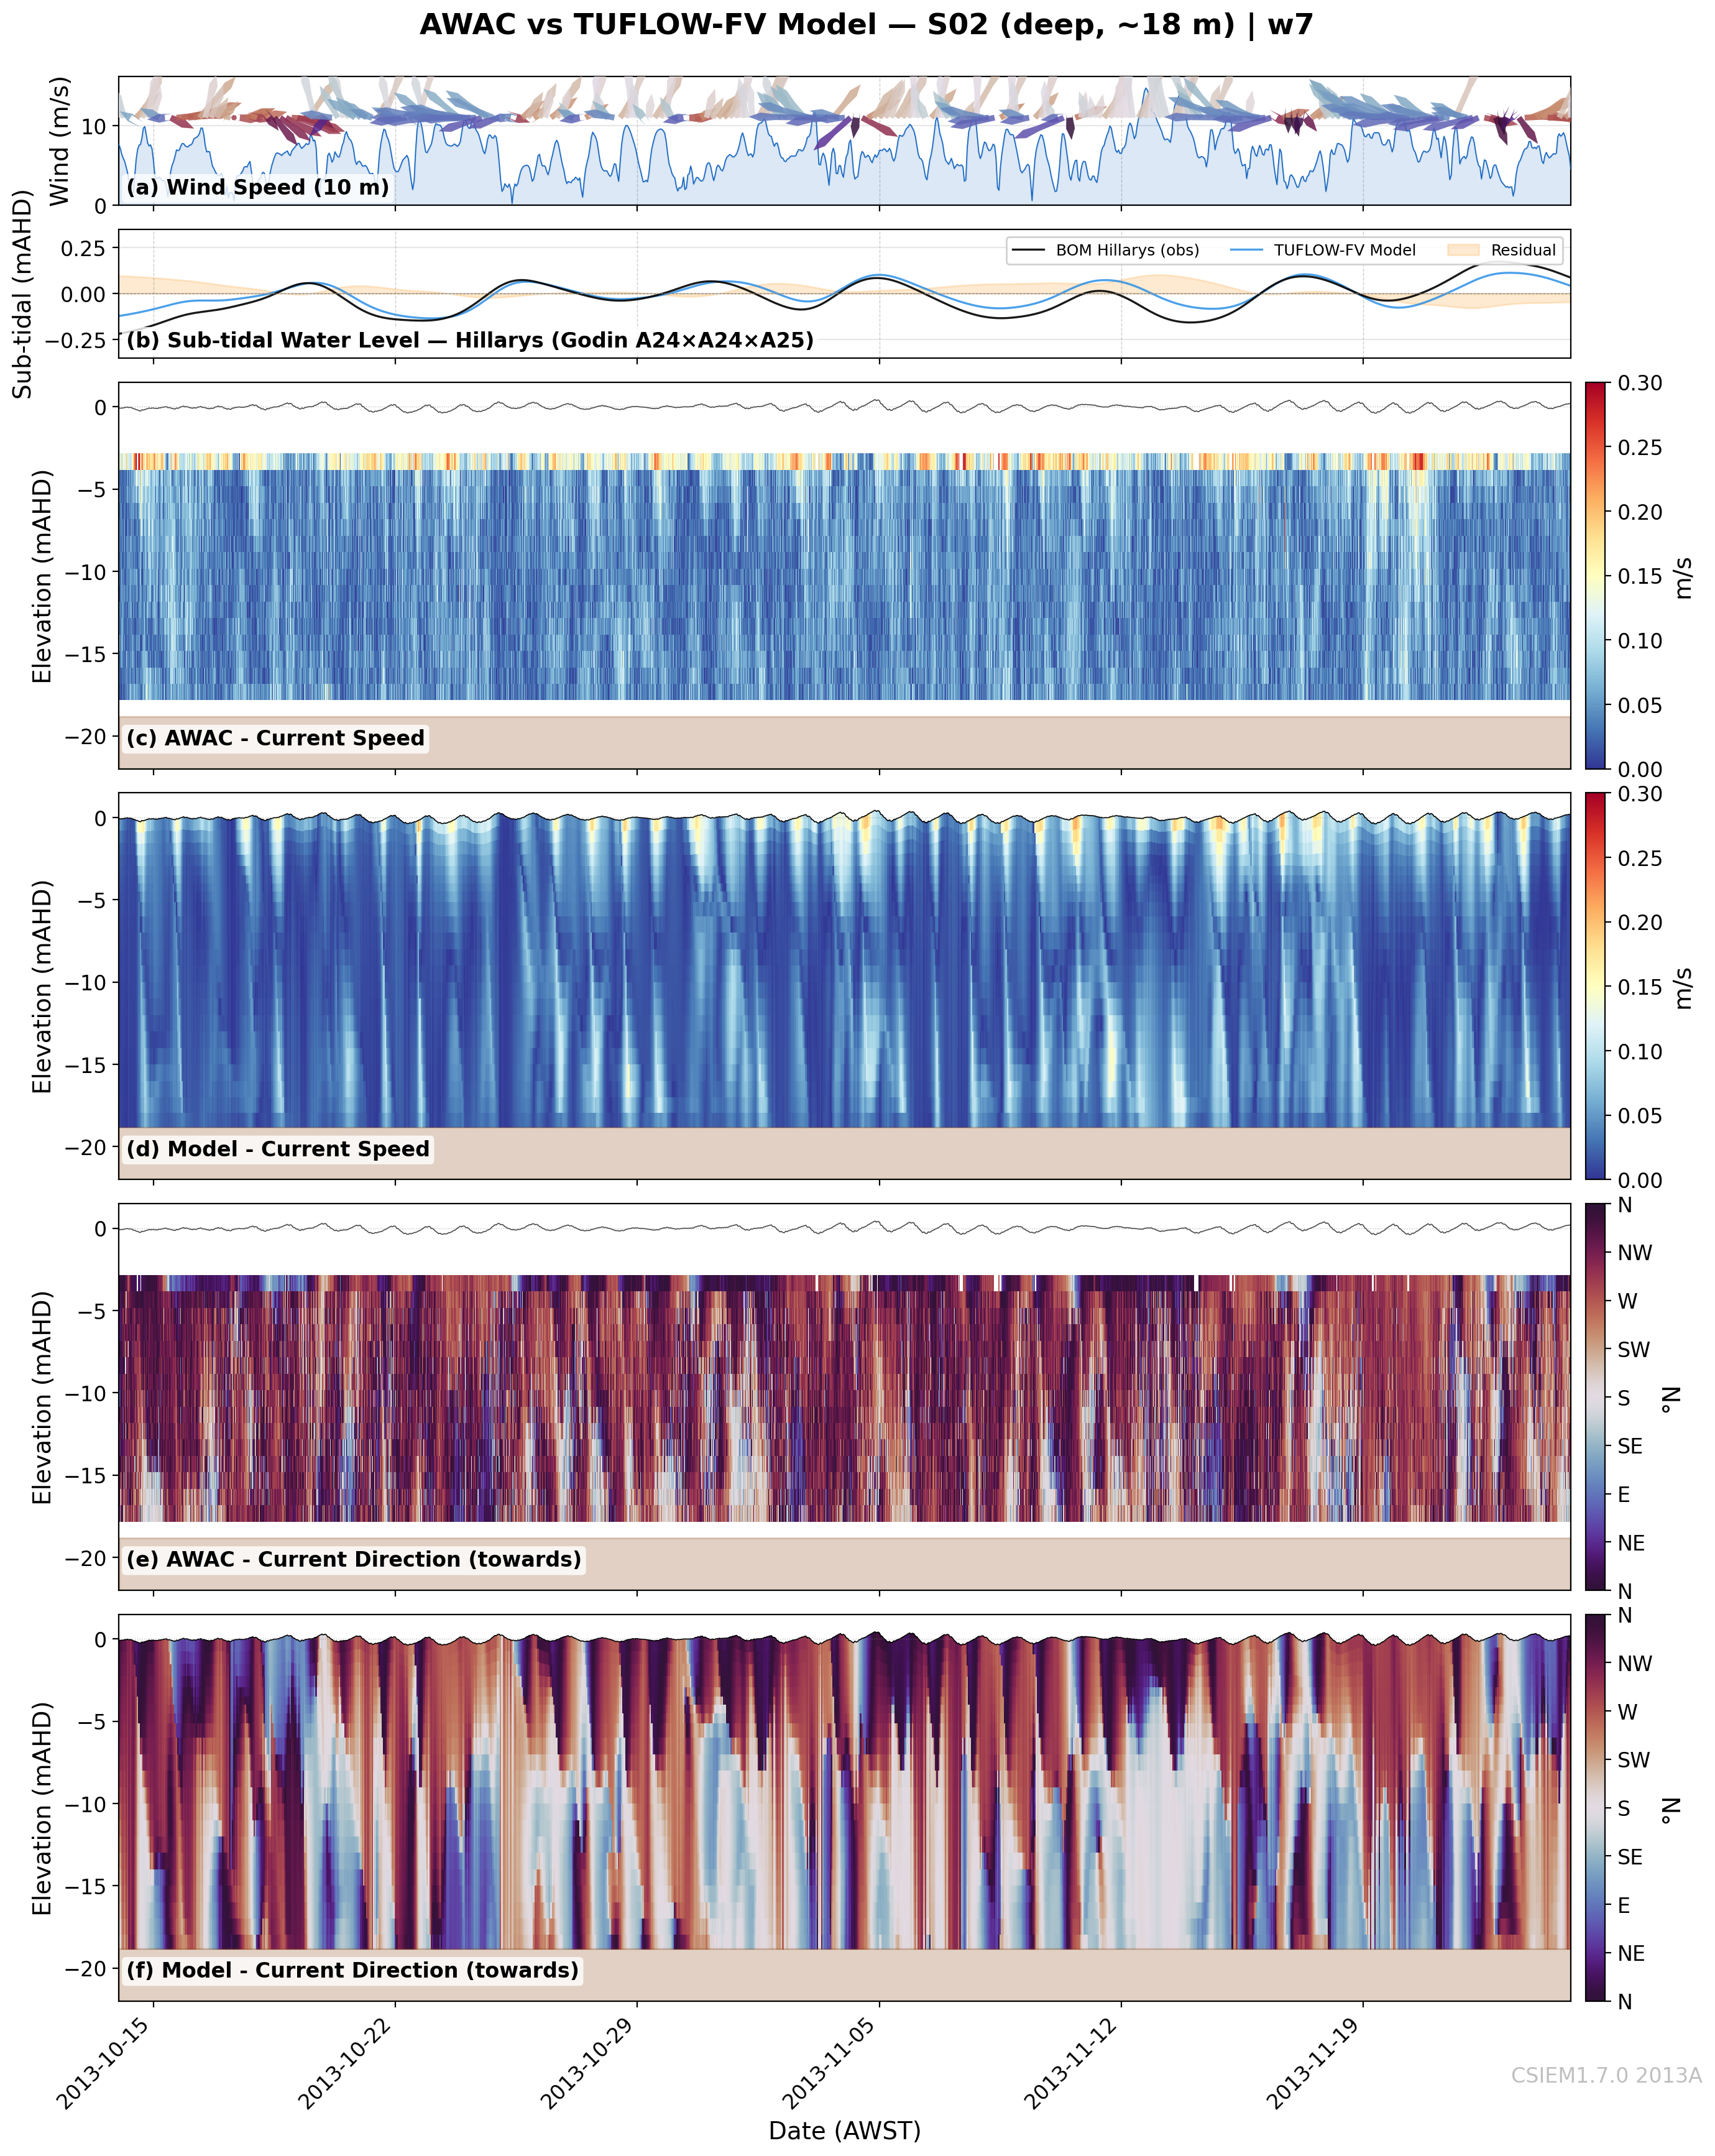
W7: Leeuwin Current
Peak Leeuwin Current influence; sustained elevated regional water levels
Model captures elevated sub-tidal level and baroclinic exchange character
Contrast with W6 tests model’s shift from barotropic to baroclinic forcing
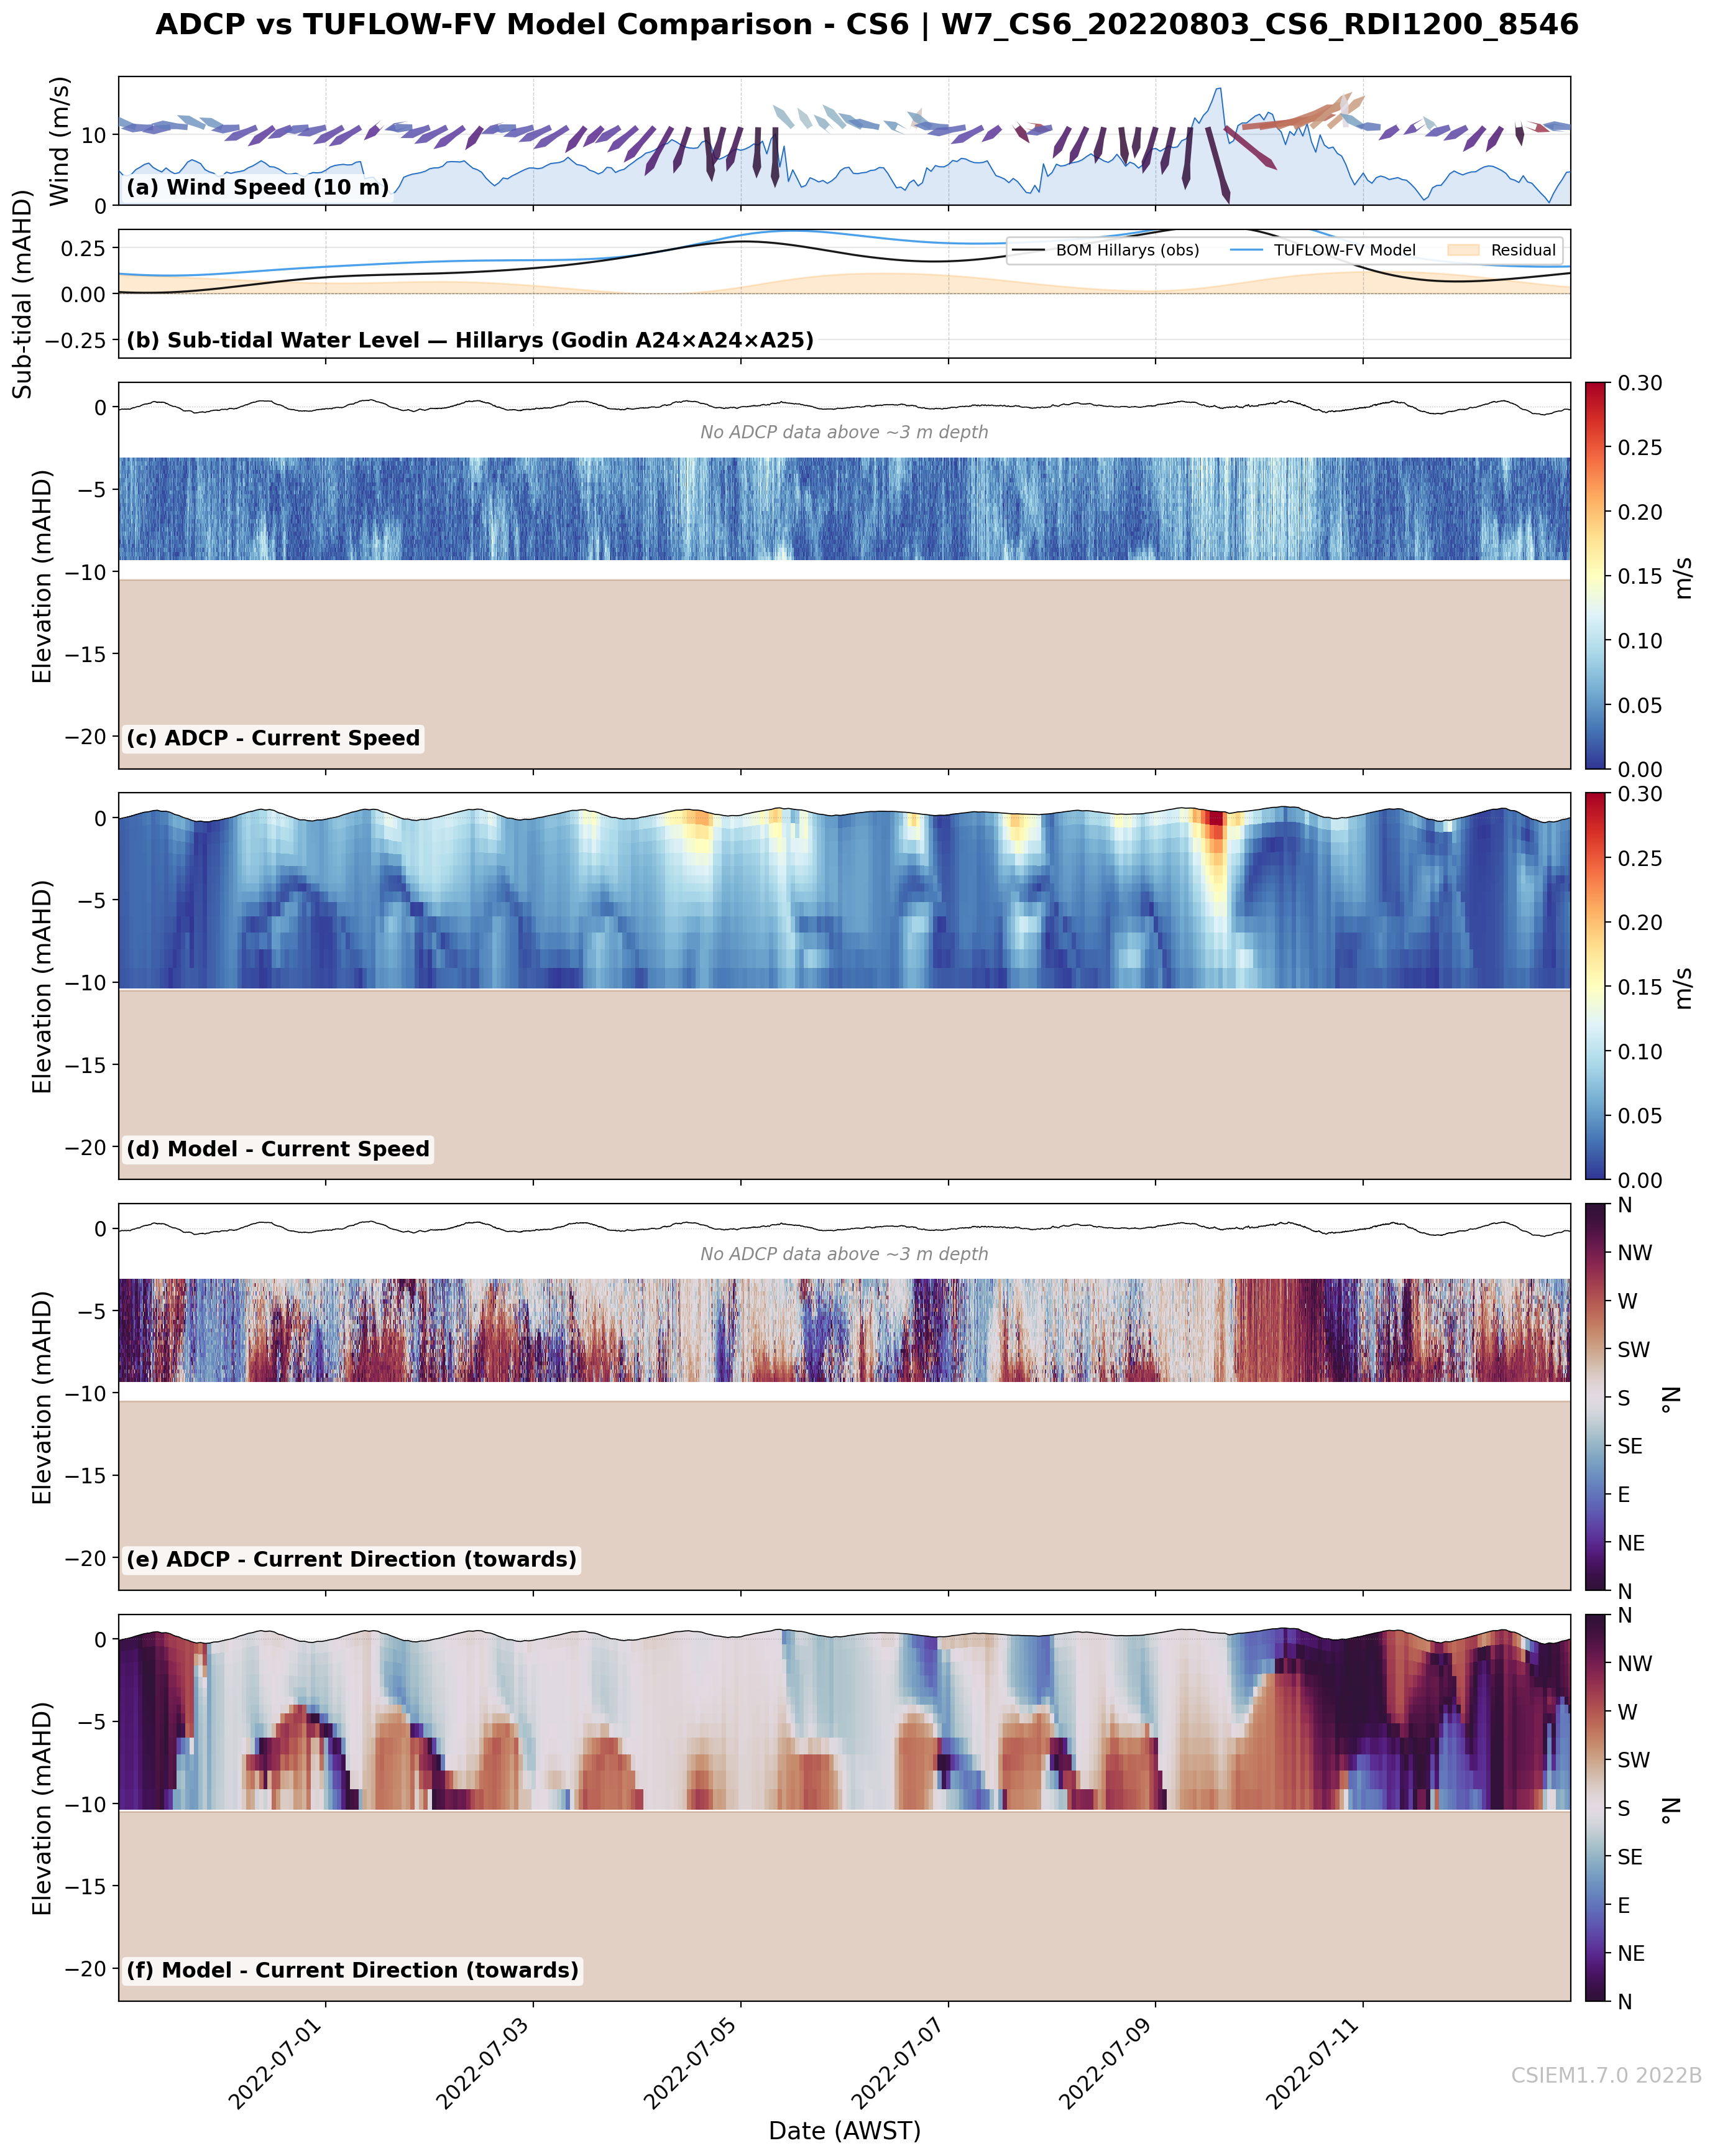
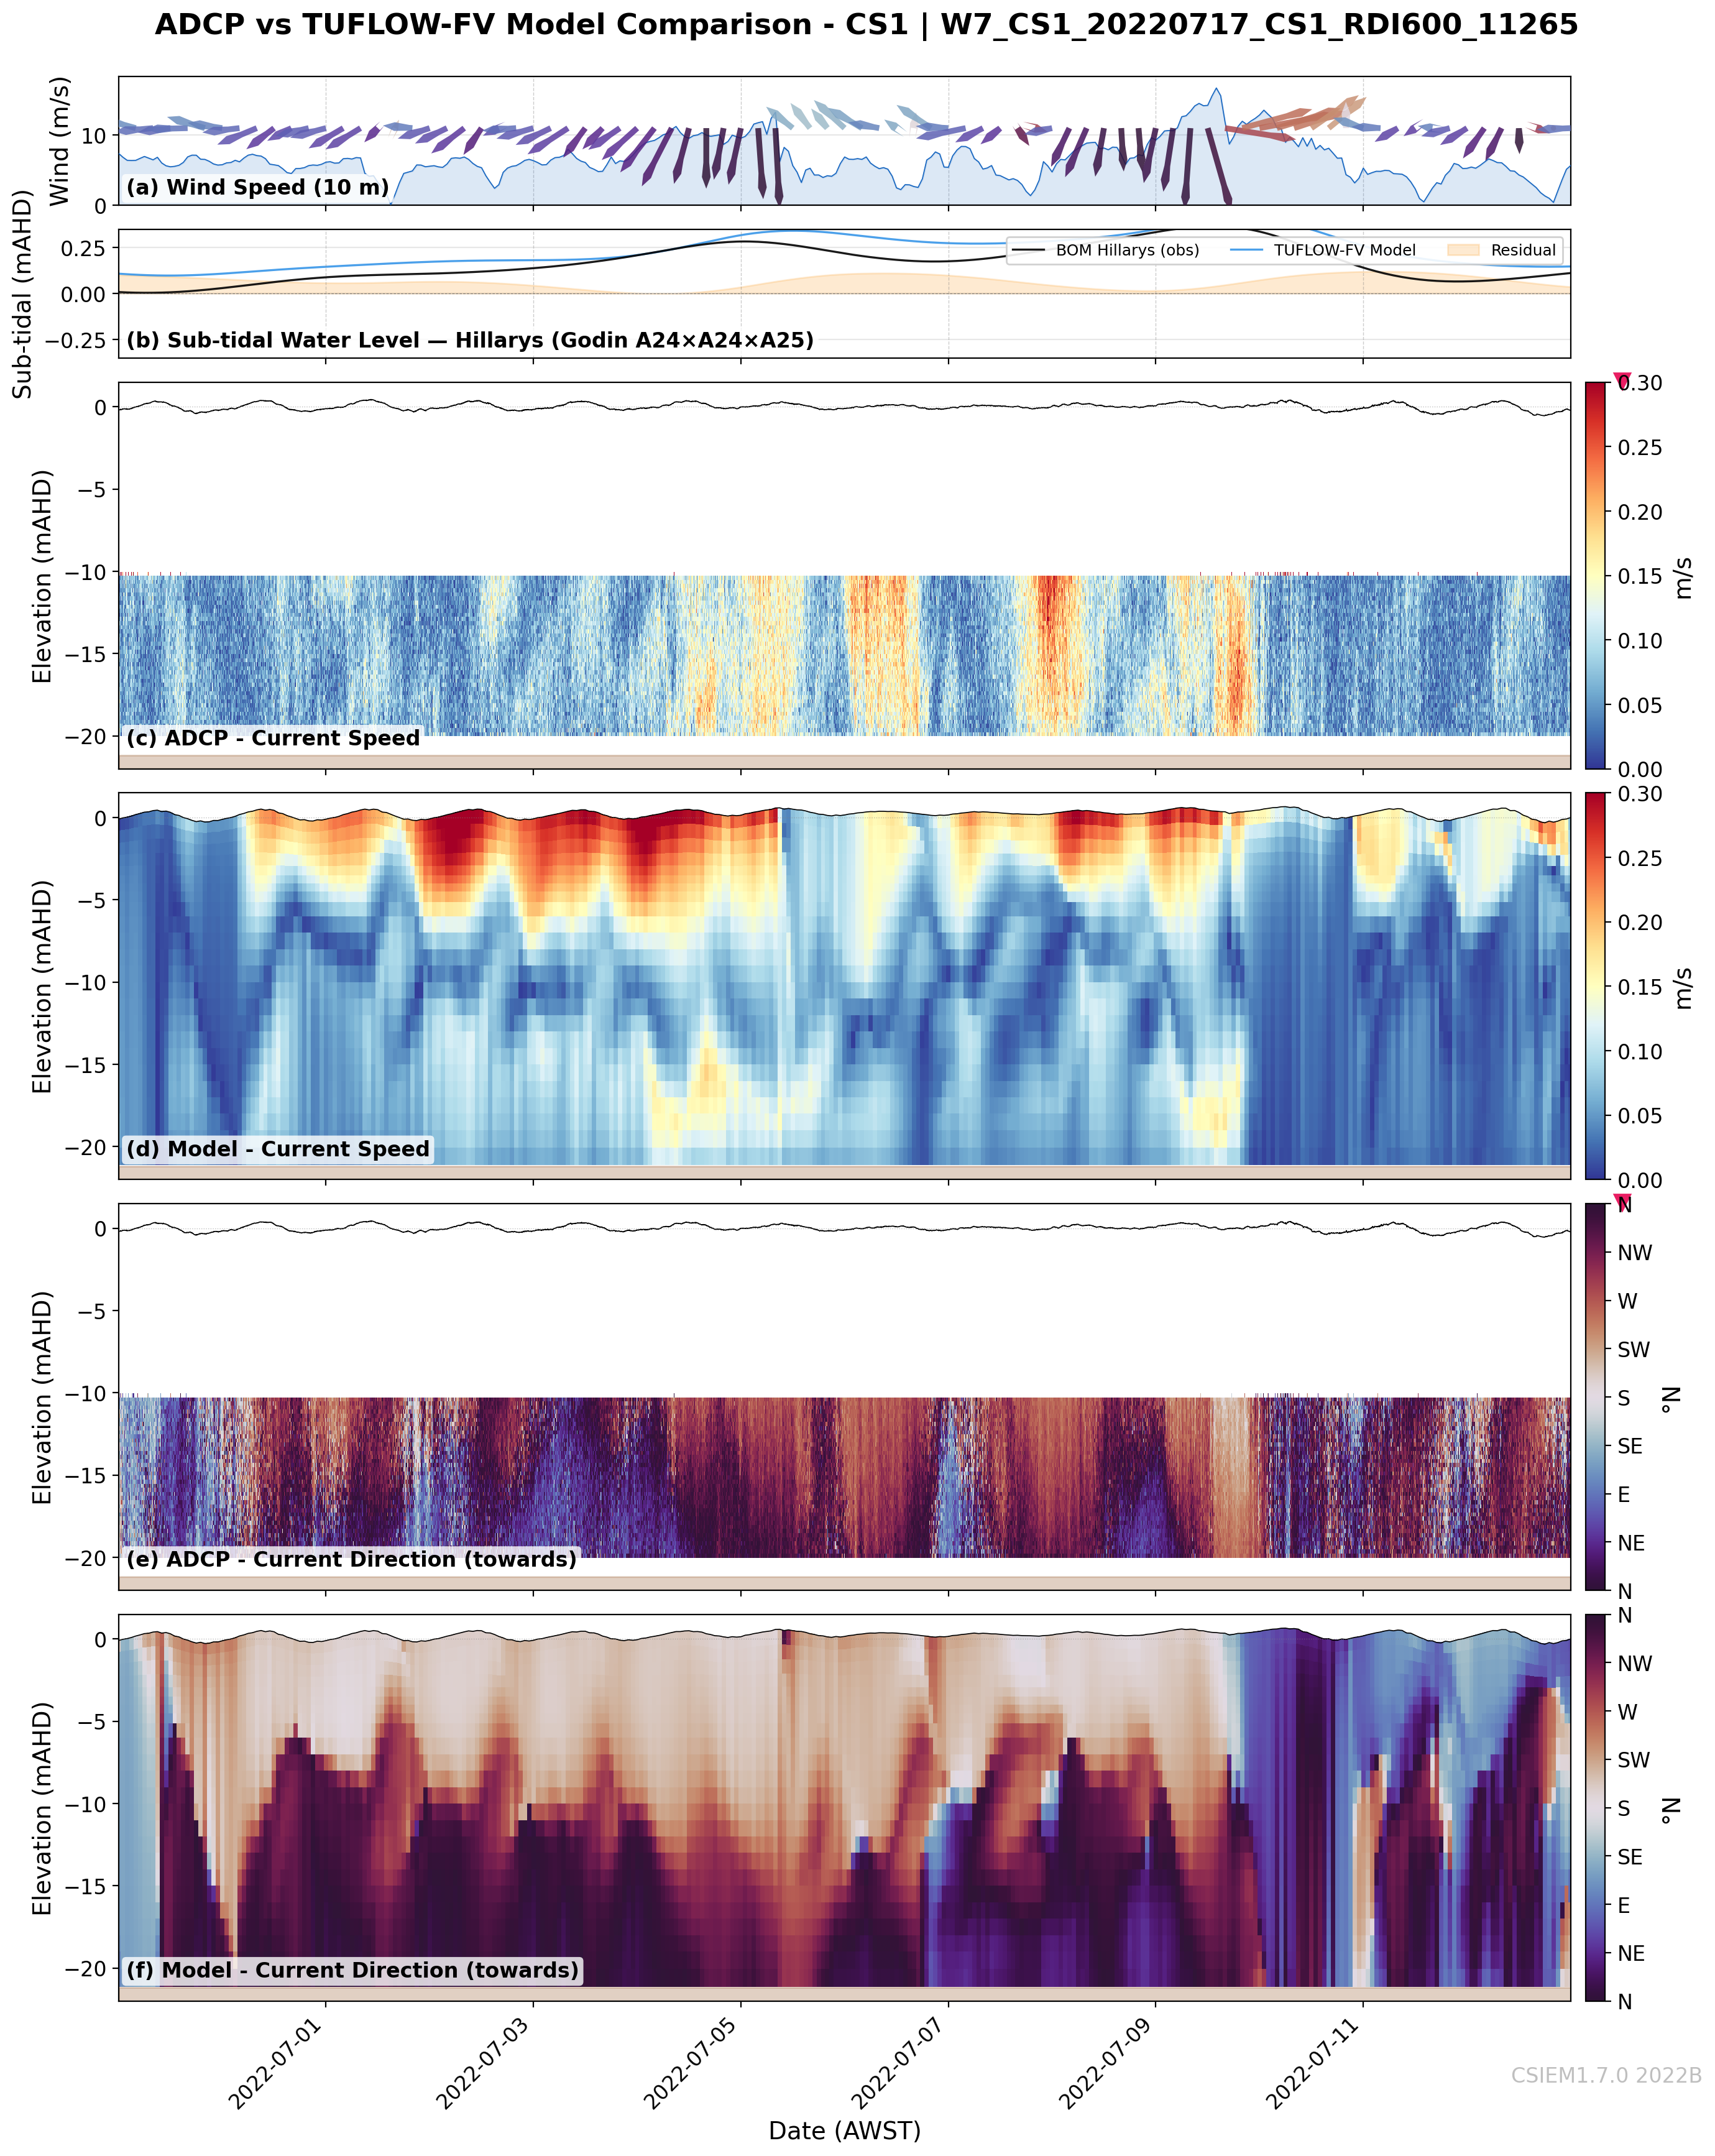
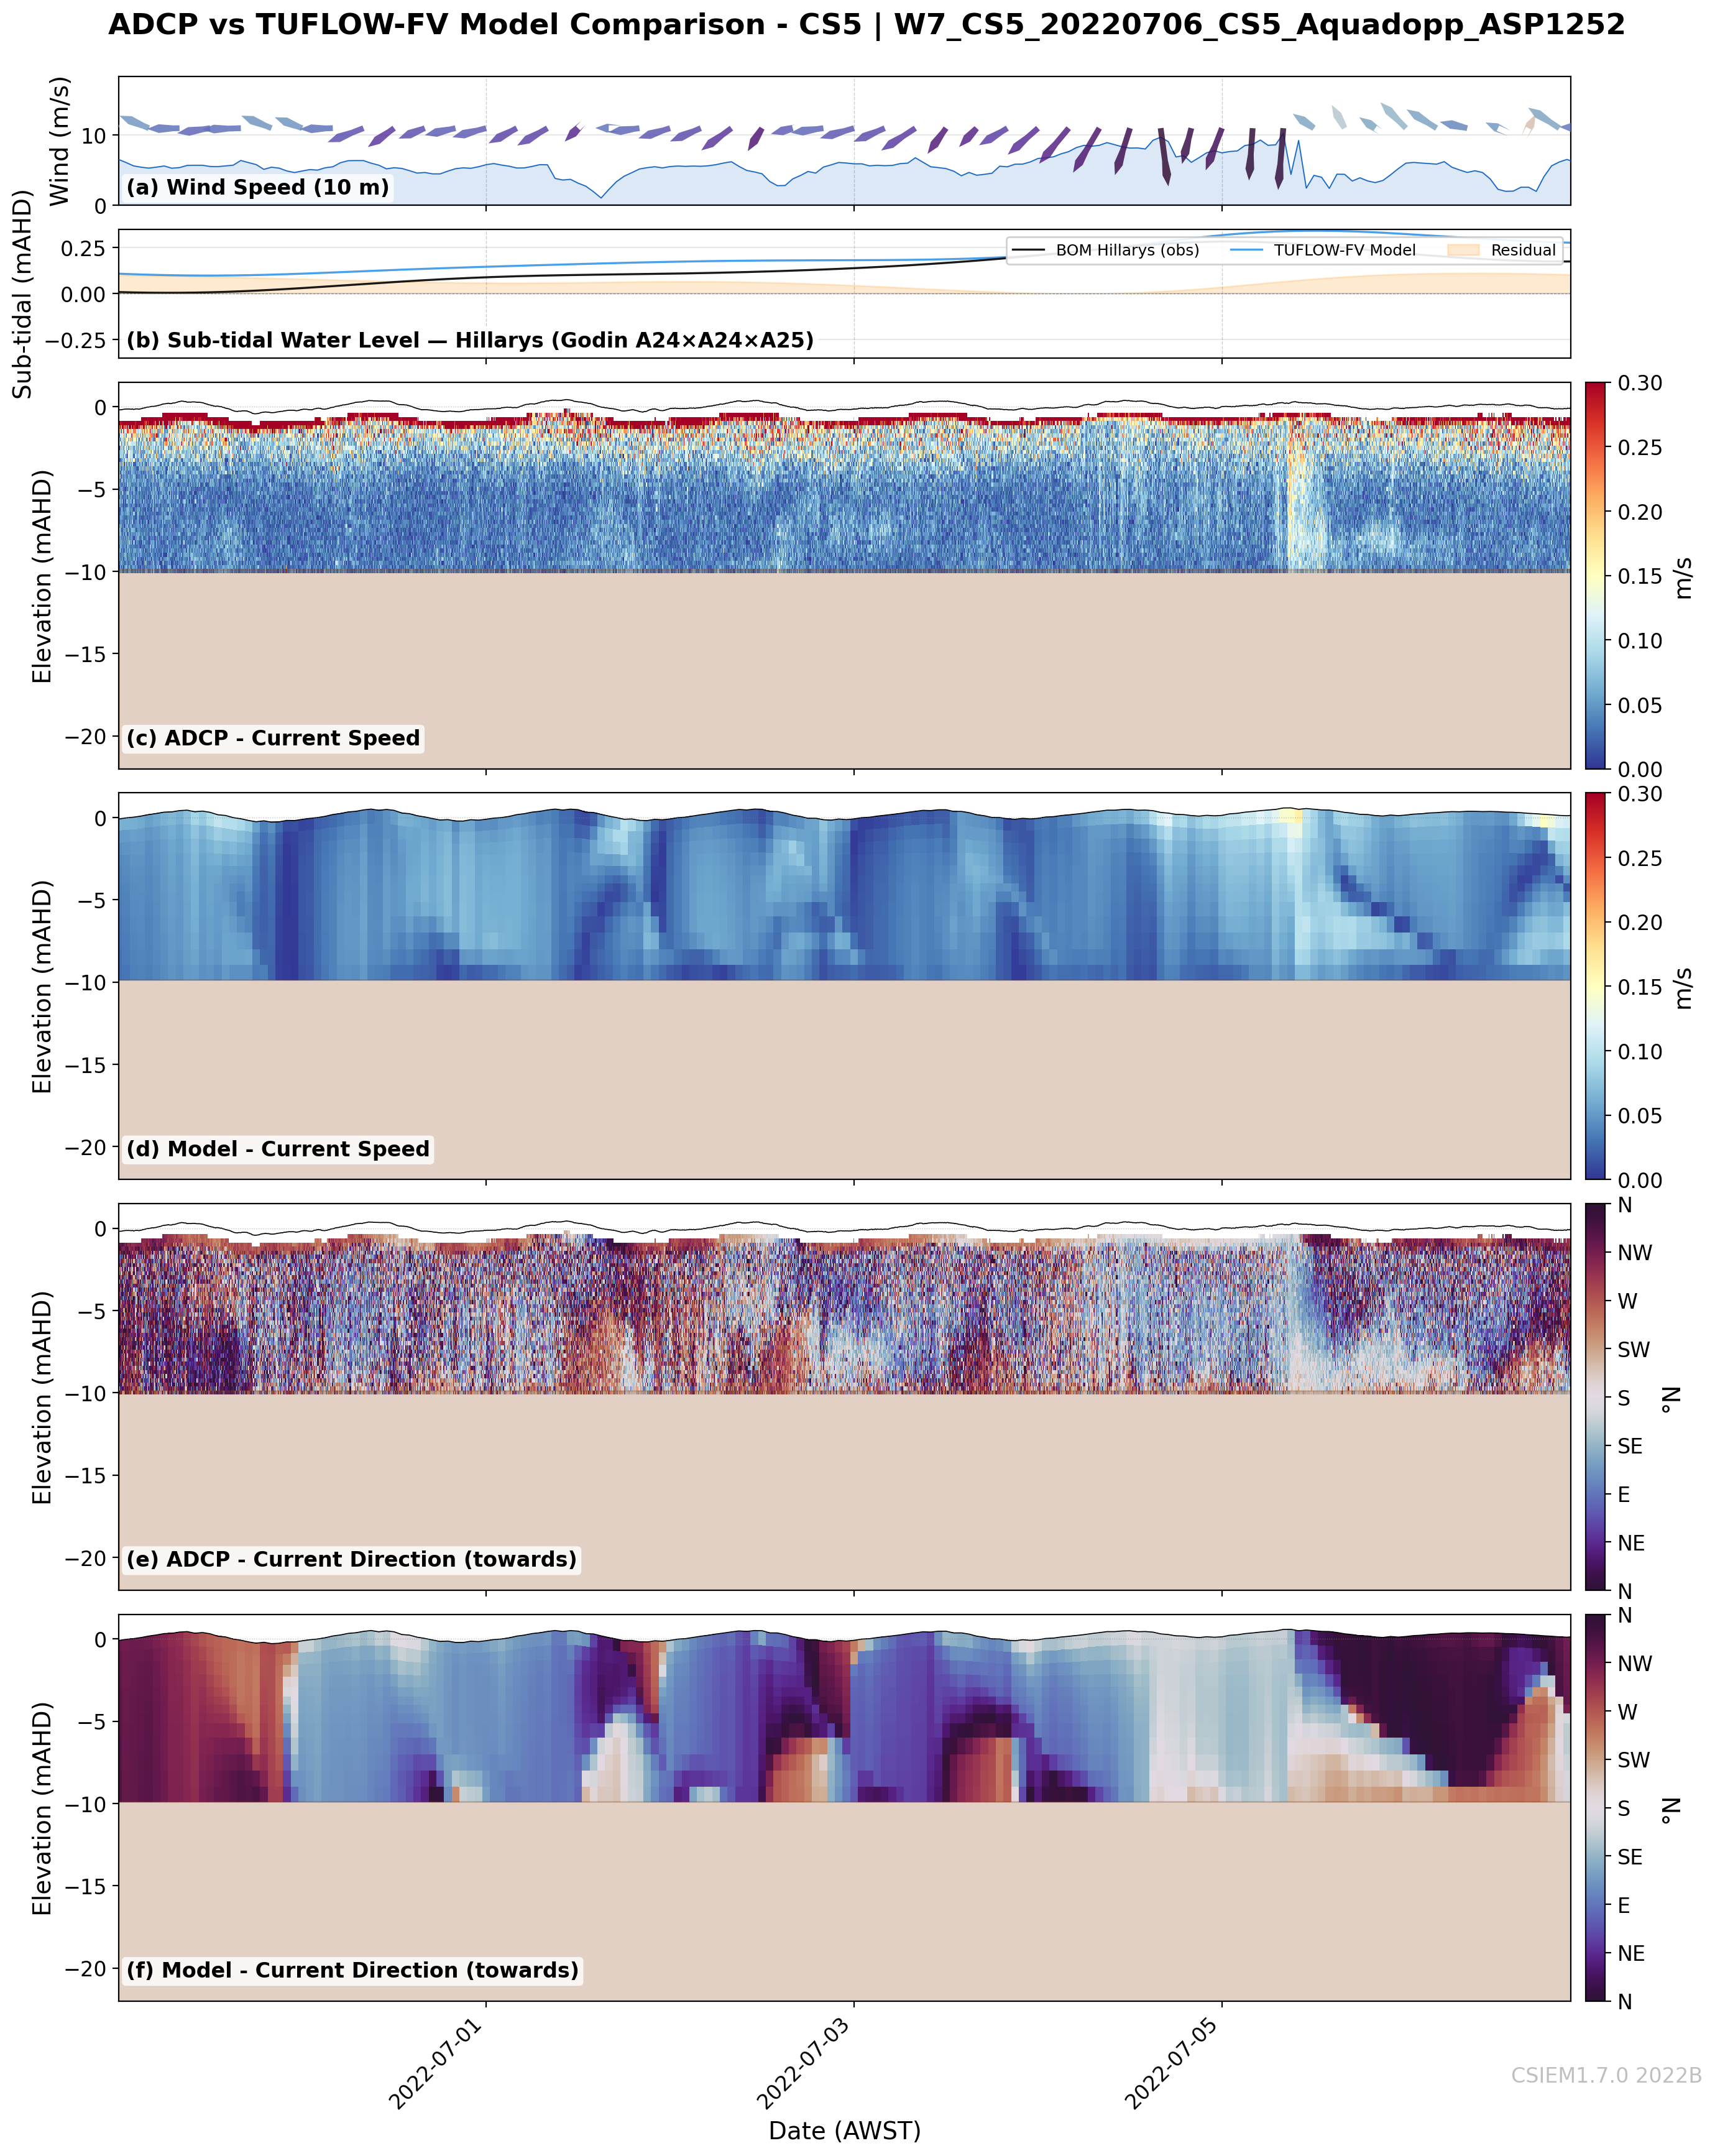
Model notes: Despite weak local wind, observed current field remains energetic — bottom-intensified currents at CS1 (~0.15–0.20 m/s) exceed modelled values during several multi-day episodes, suggesting model underestimates density-driven inflow under peak LC conditions. CS6 shows persistent southward flow consistent with regional LC influence; model captures general speed level but some directional timing differences. Shift from W6 (barotropic) to W7 (baroclinic) residual pattern provides stringent test of model forcing-mode transition.
CS6 (11m) — Owen Anchorage
CS1 (20m) — Basin (north)
CS5 (11m) — Shelf (north)
CS2 not available
CS4 (11m) — Shelf (south)
CS7 not available
CS3 (20m) — Basin (south)
Data Source & Notes
The ADCP current profile observations were collected as part of
WAMSI Westport Marine Science Program, Project 5.1
(Multi-decadal ocean boundary conditions and field measurements),
led by Prof Charitha Pattiaratchi and data curated by Tanziha Mahjabin,
from the University of Western Australia (UWA).
Seven bottom-mounted, upward-looking ADCPs were deployed across Cockburn Sound
between April 2021 and August 2022, providing vertical current profiles
at 0.15–0.50 m vertical resolution and 2–20 minute sampling intervals.
Out-of-water filtering — timesteps where pressure sensor depth < 1 m are masked.
Sidelobe contamination masking — cells above PSD × cos(beam_angle) set to NaN.
Speed threshold — current speeds exceeding 2.0 m/s are masked as physically implausible.
Timezone alignment — ADCP timestamps (UTC) shifted +8 h to AWST.
Vertical datum — metres relative to Australian Height Datum (mAHD).
CS7 Eco ADCP direction correction (+96°) — systematic compass offset applied to both Eco ADCP deployments.
CS7 Aquadopp HR excluded — June 2022 deployment has different offset and limited coverage.
Model: CSIEM1.7.0 — 2021B (W0) and 2022B (W1–W7) TUFLOW-FV runs.
Speed colourmap fixed at 0–0.3 m/s. Direction uses the twilight_shifted cyclic colourmap (towards convention, °N).
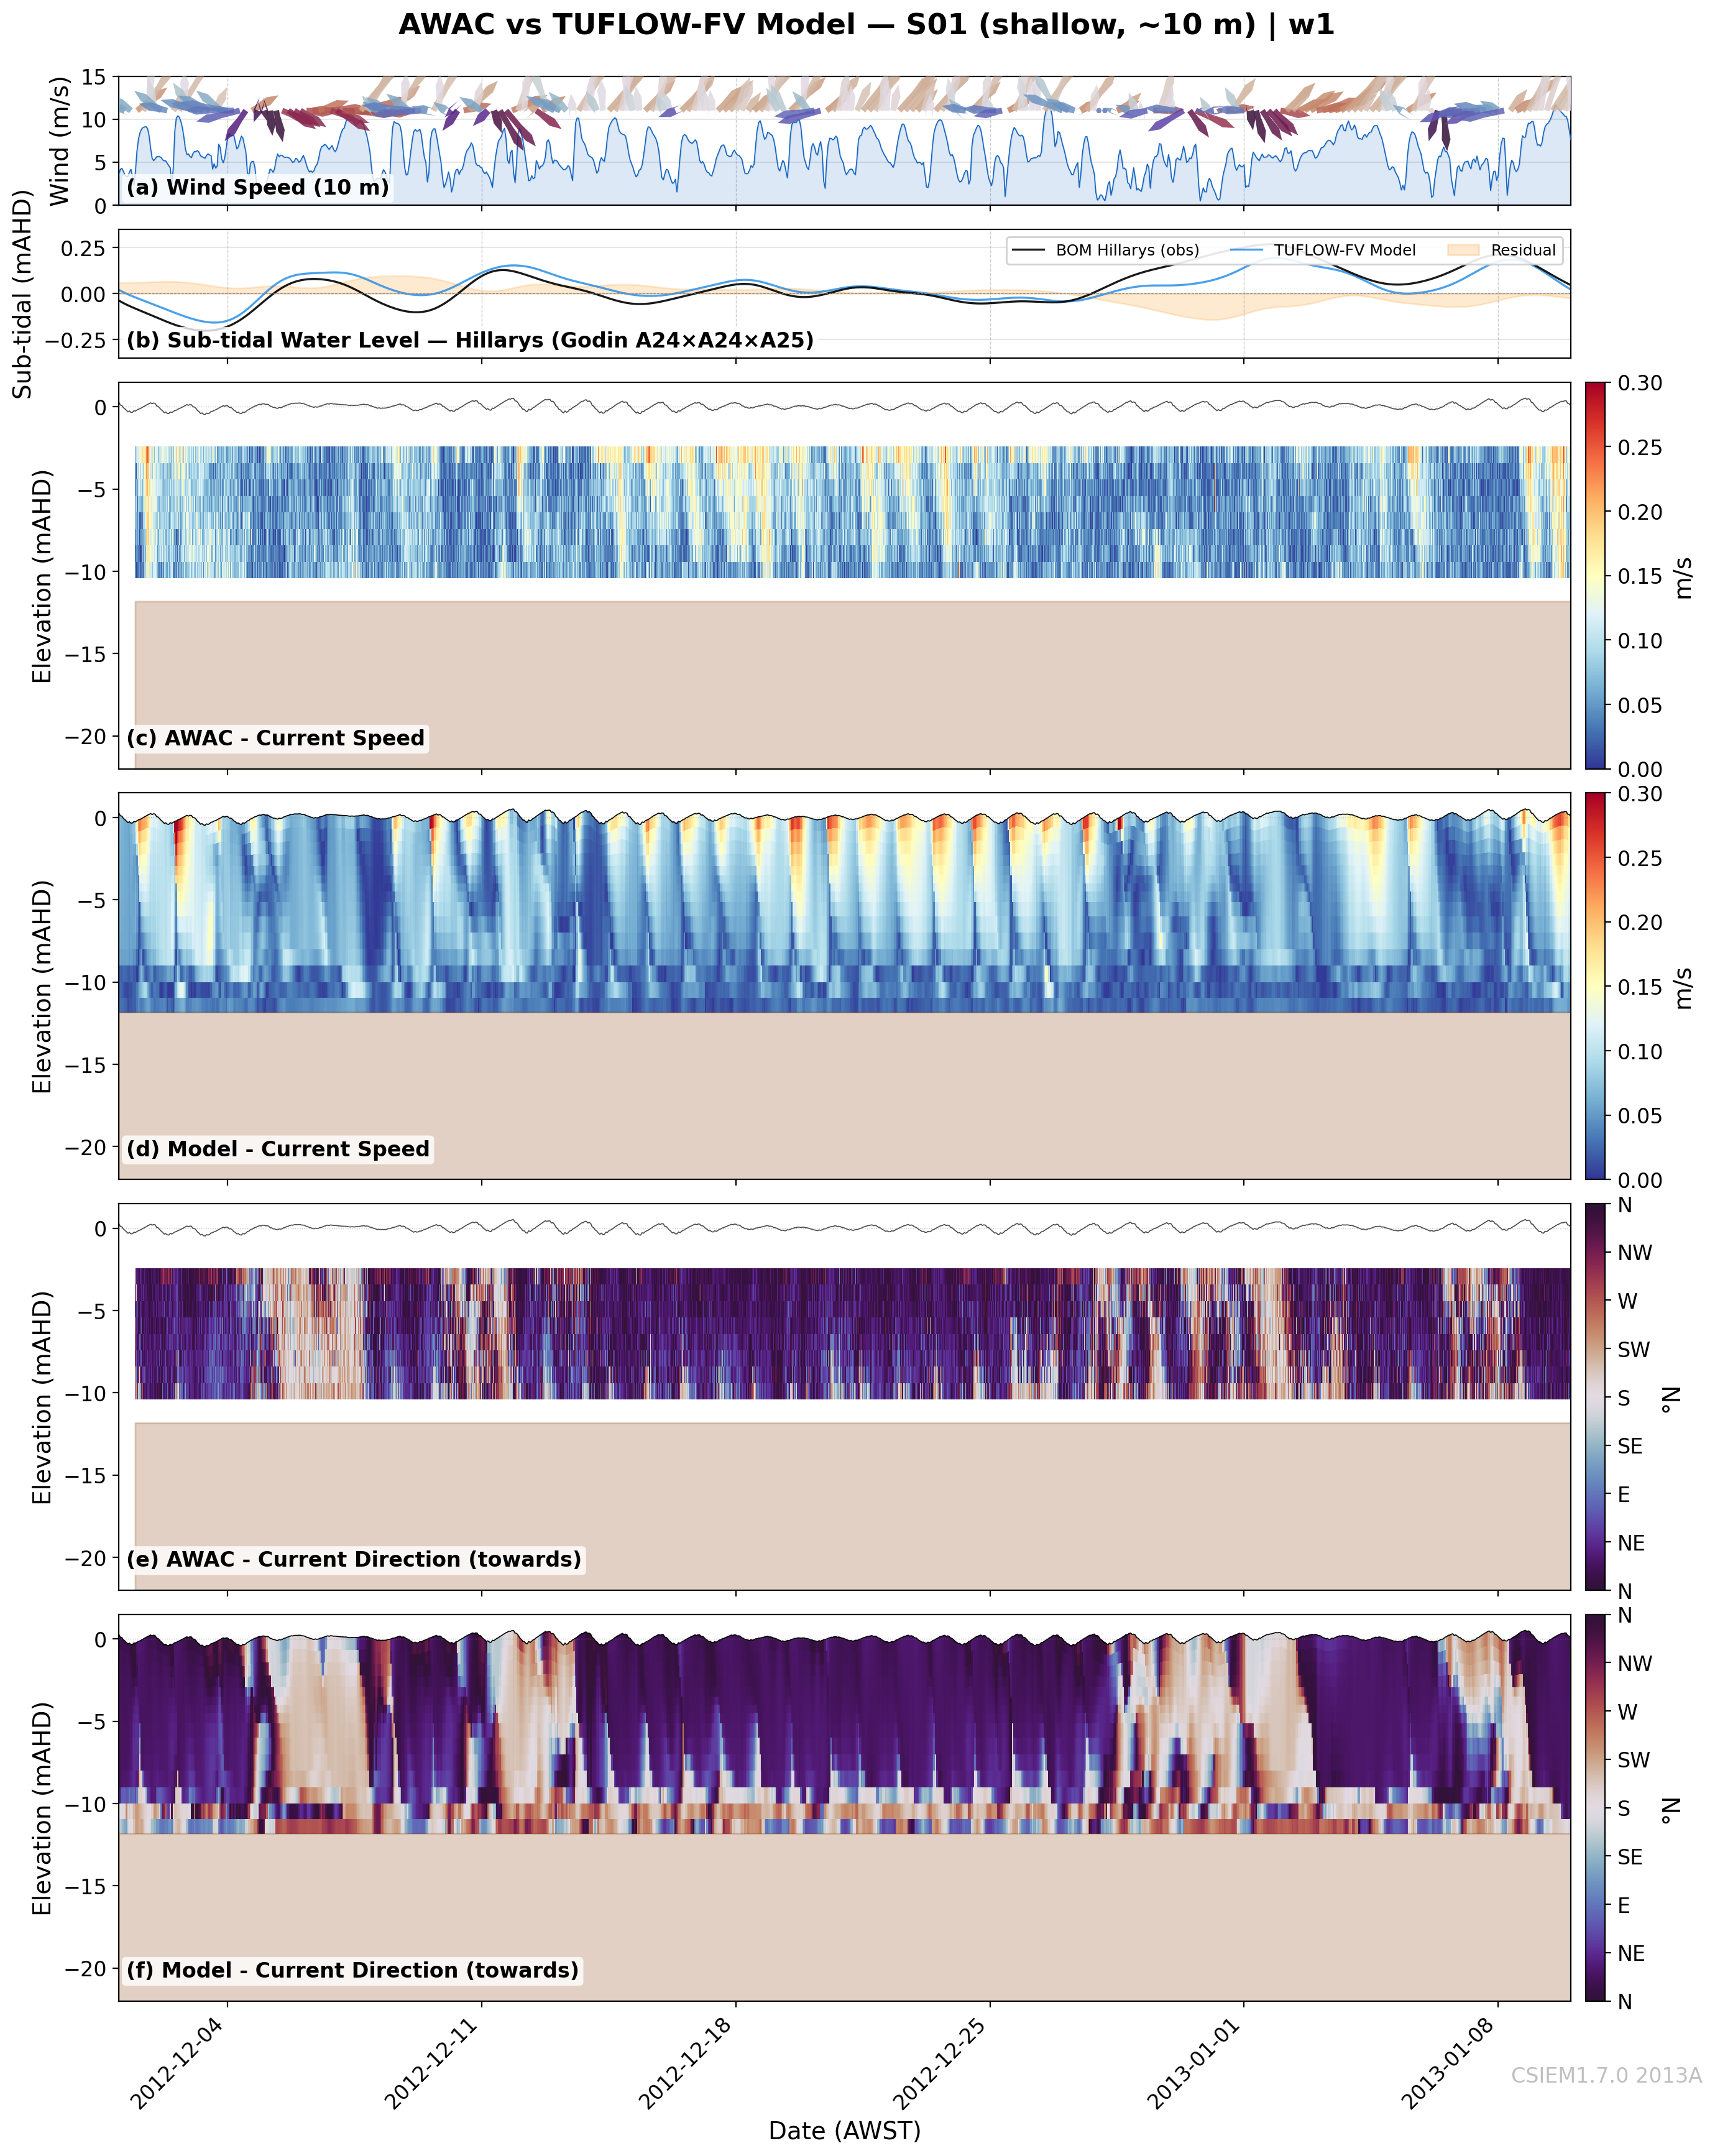
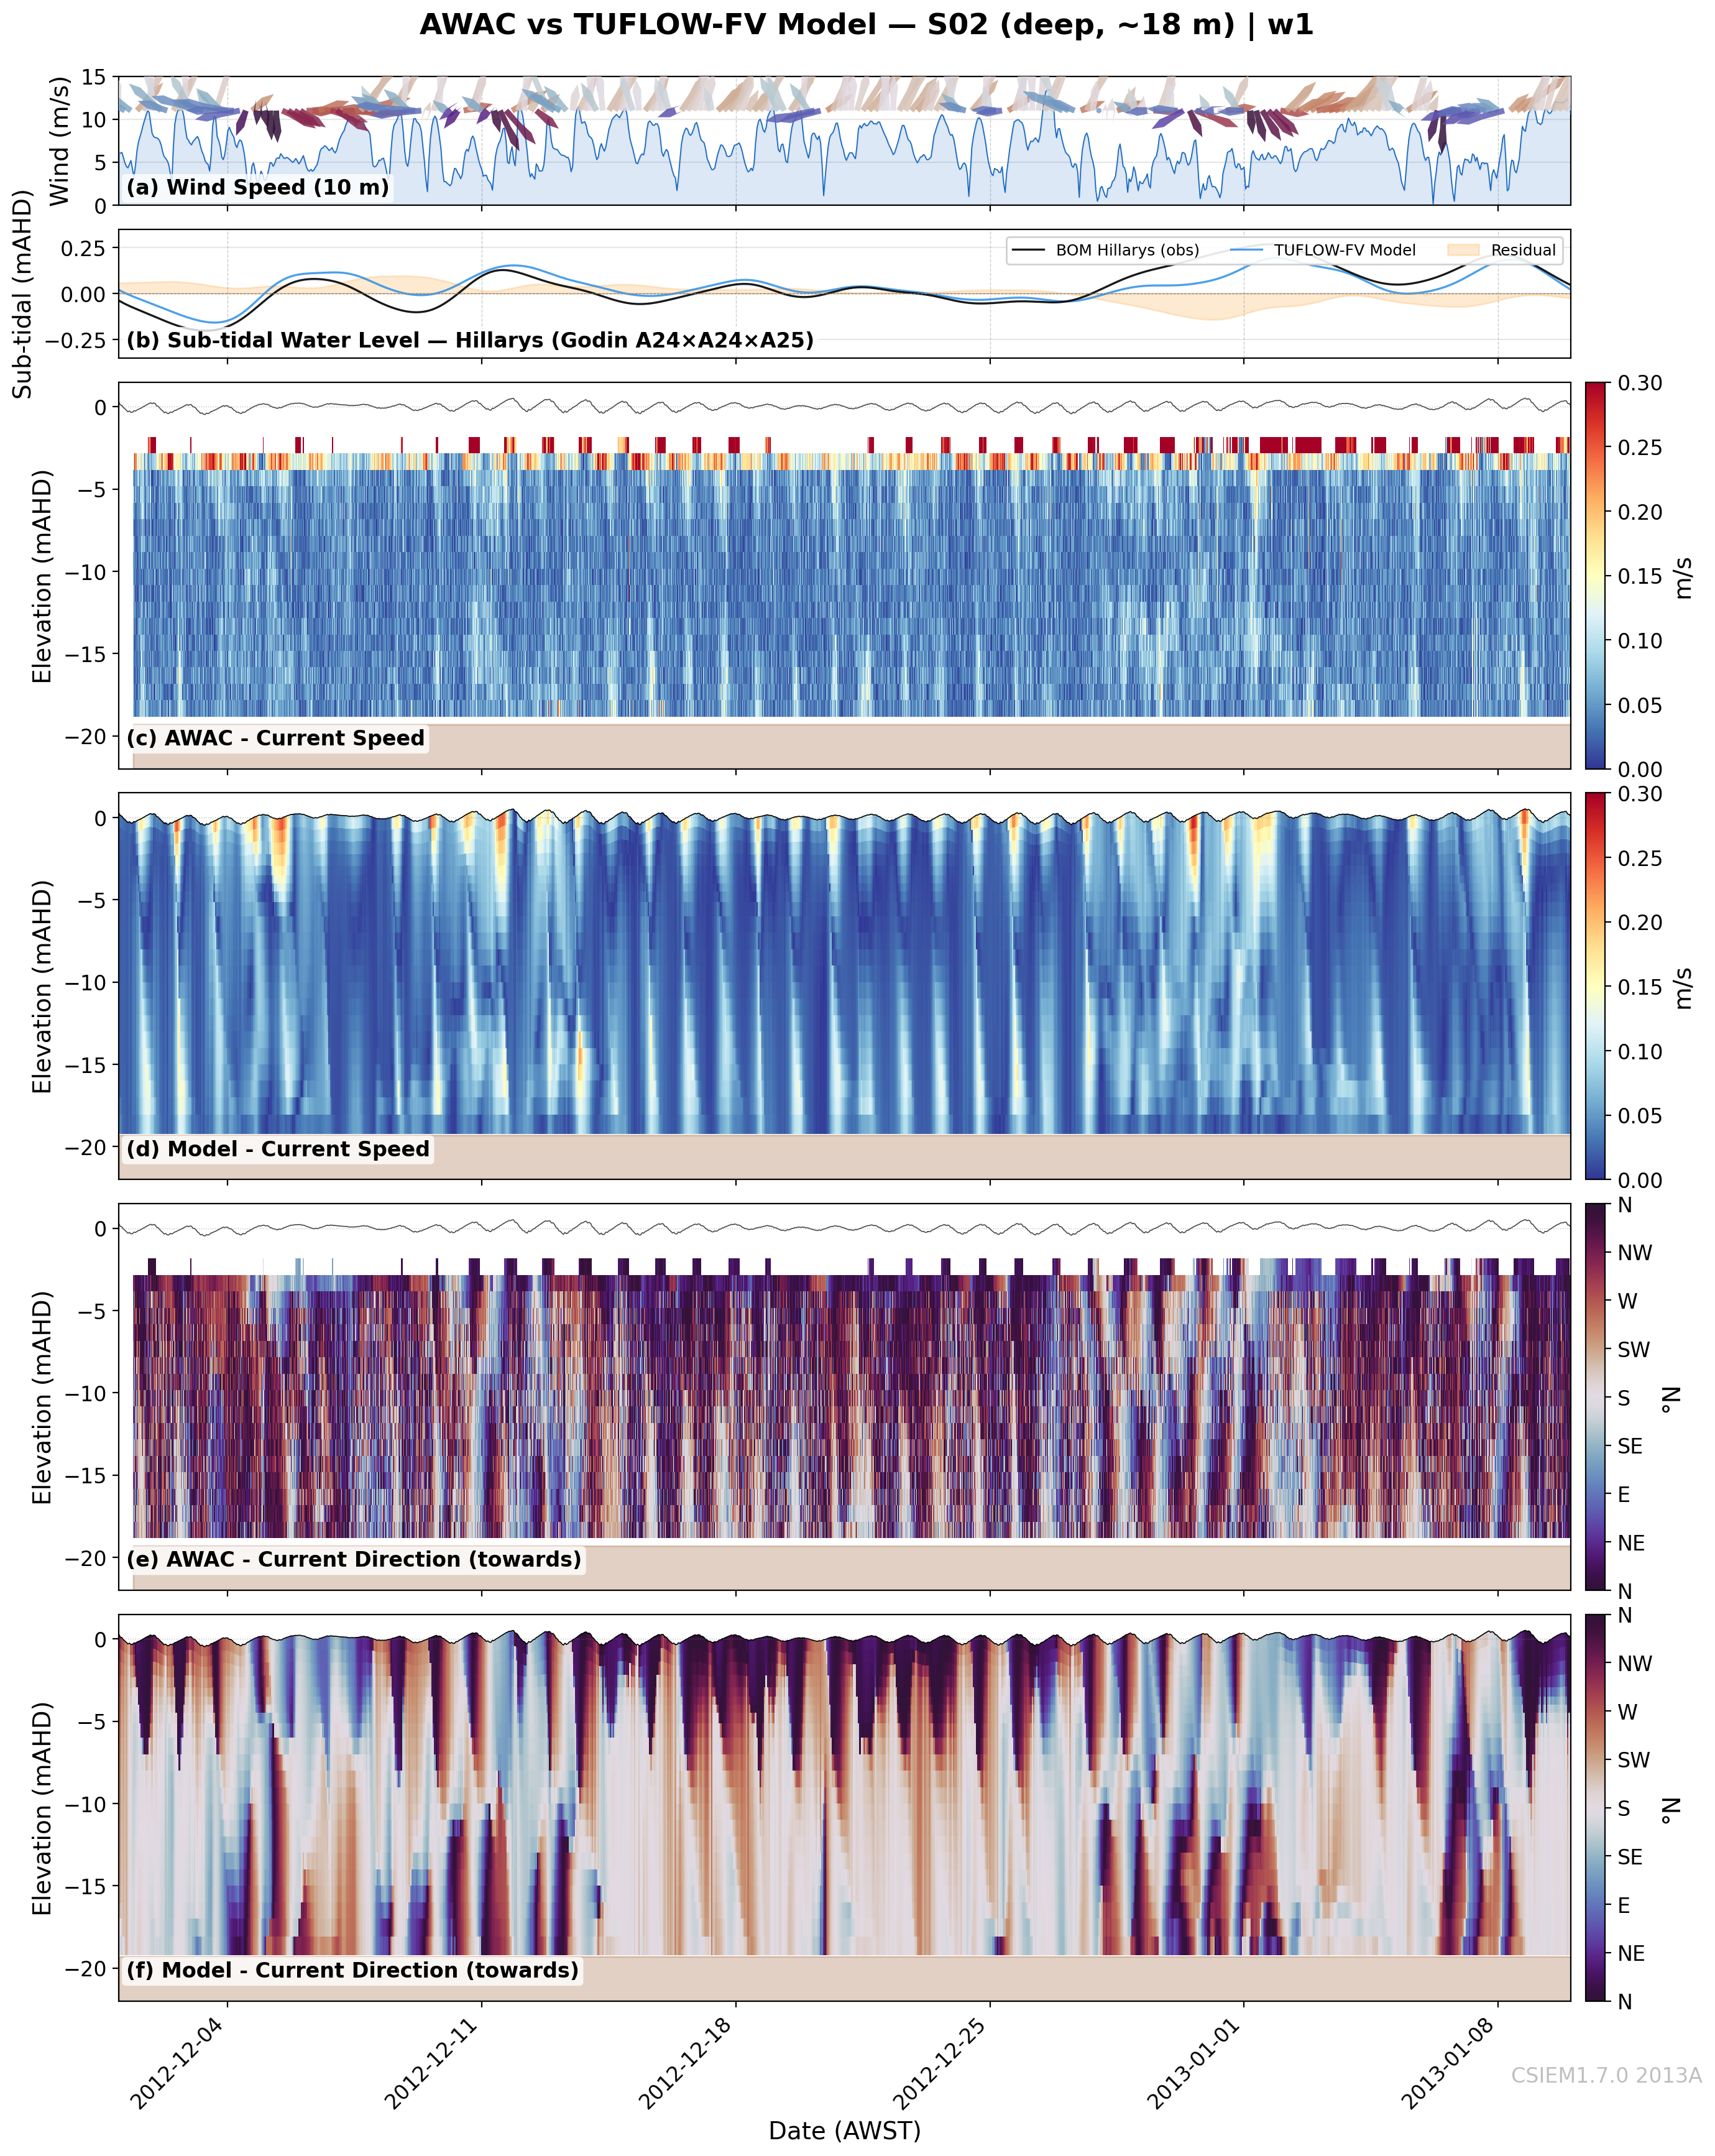
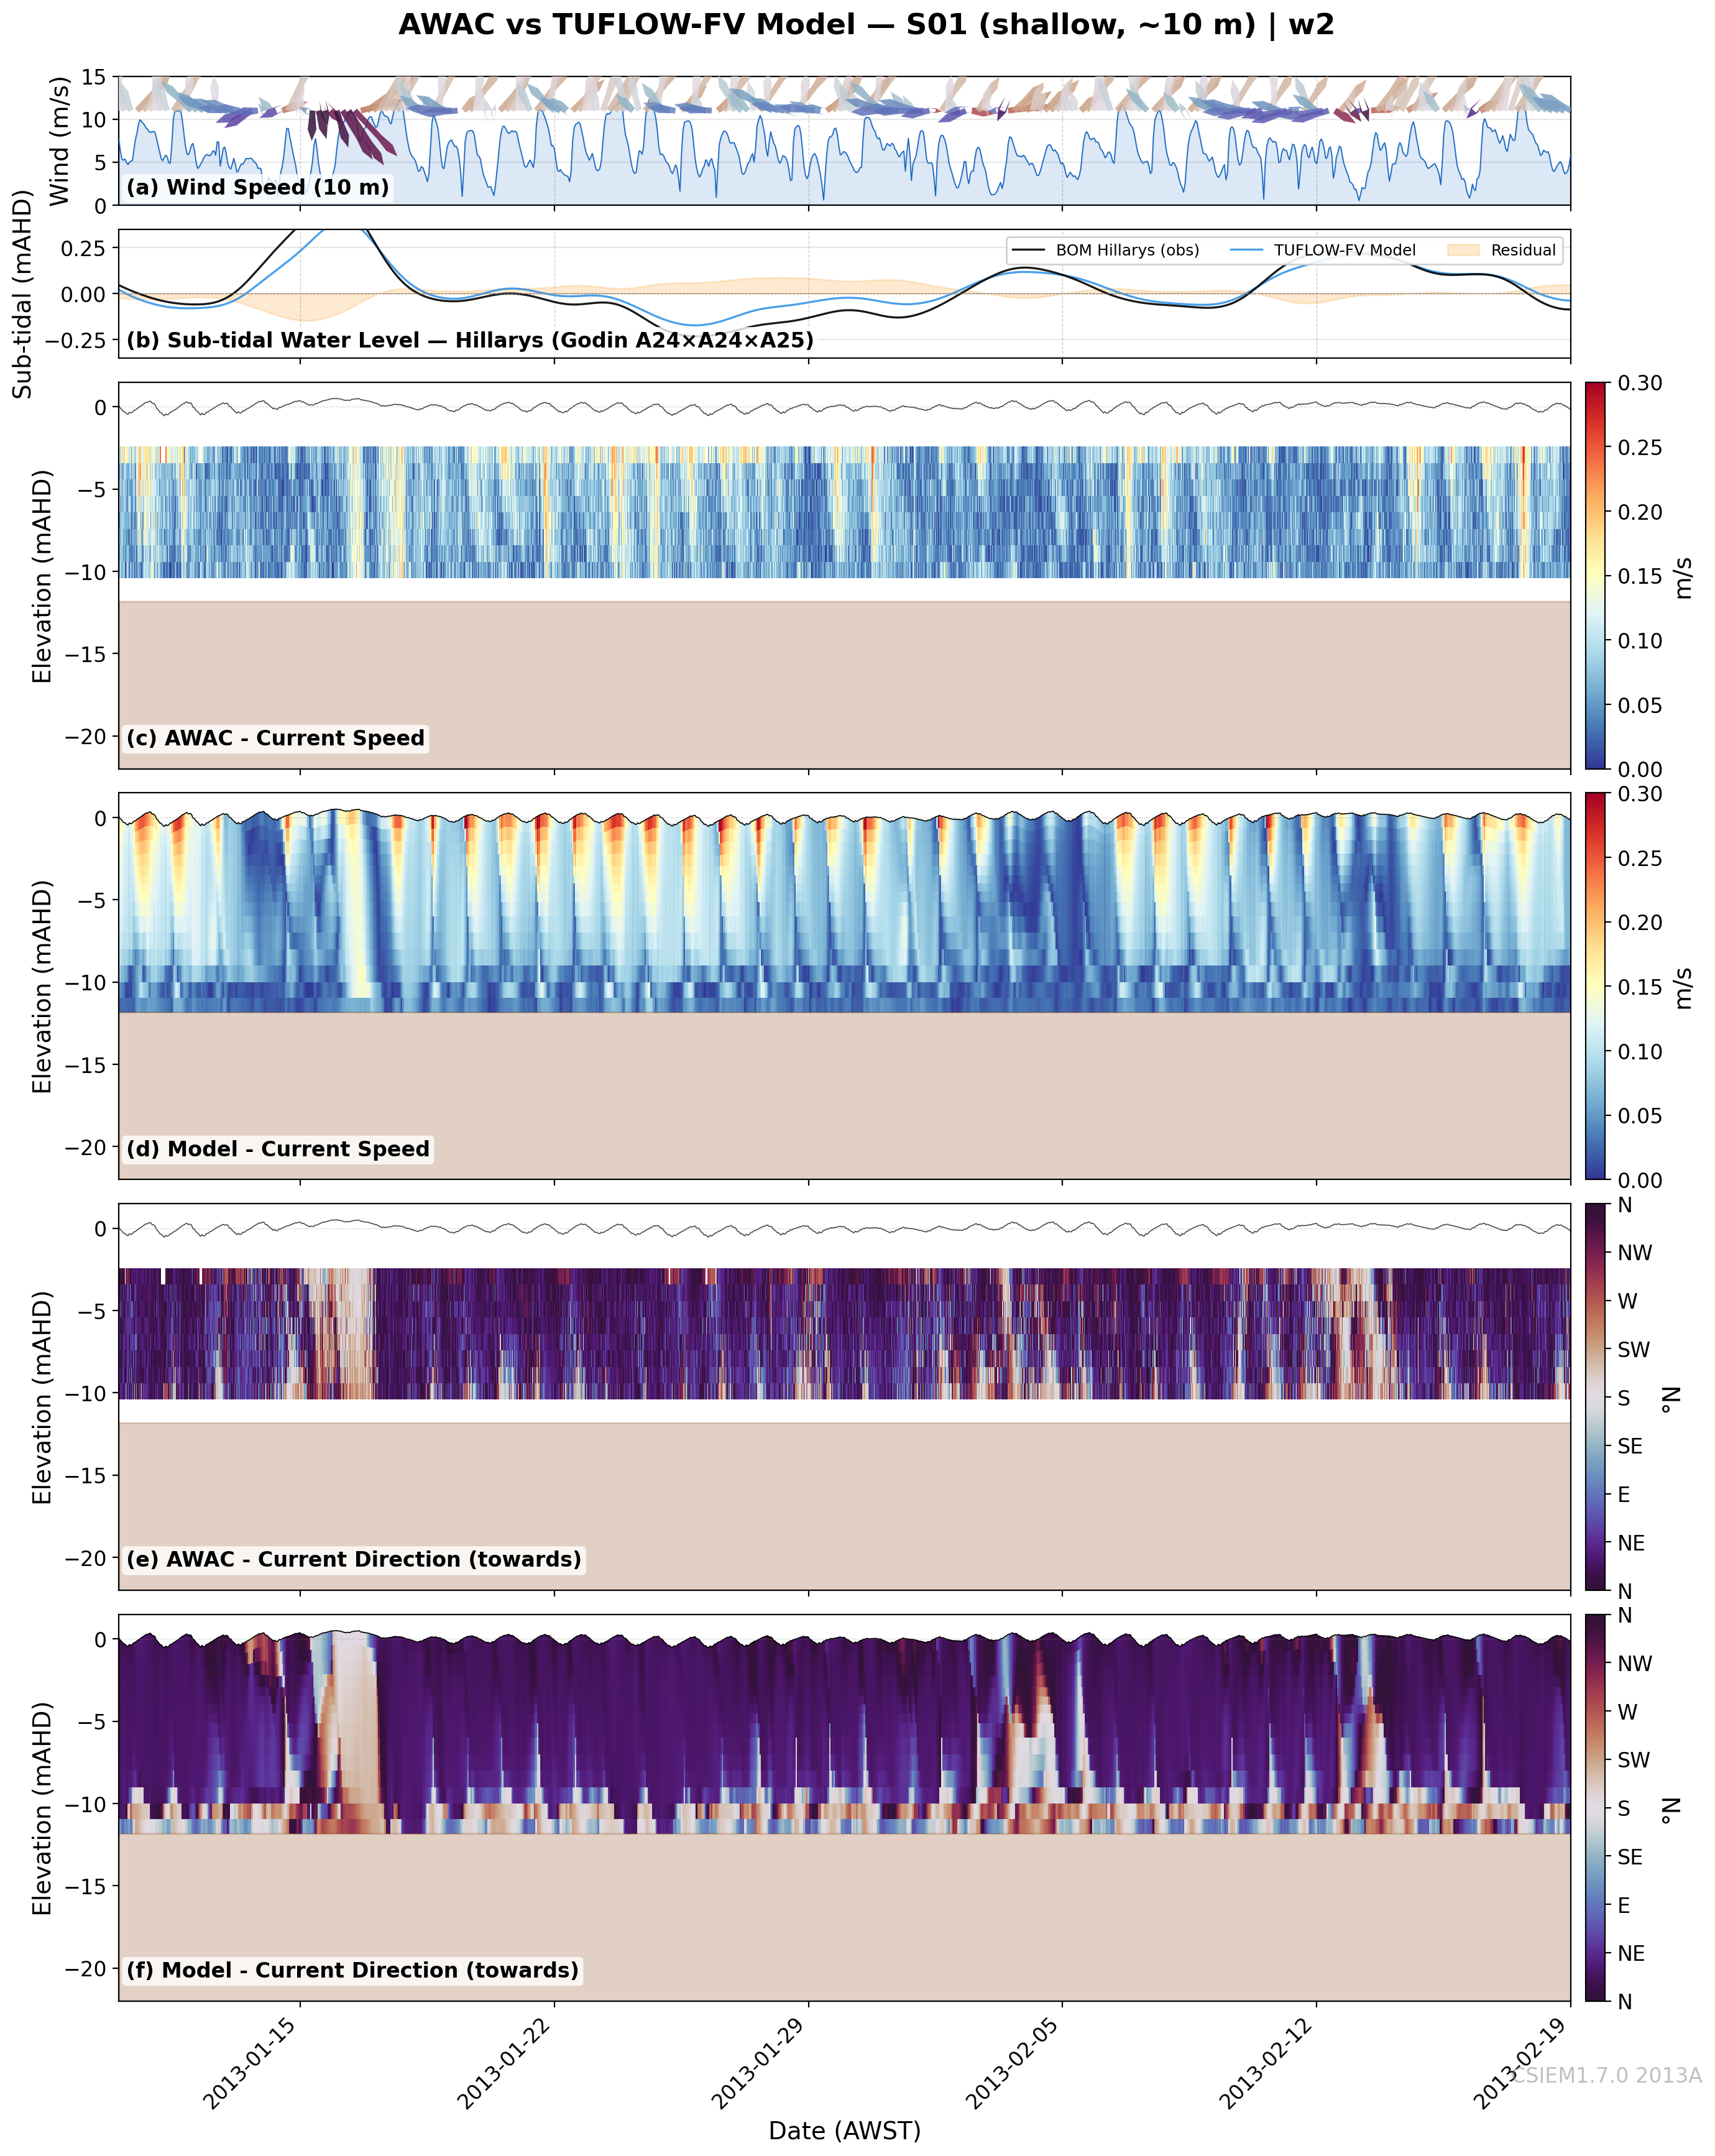
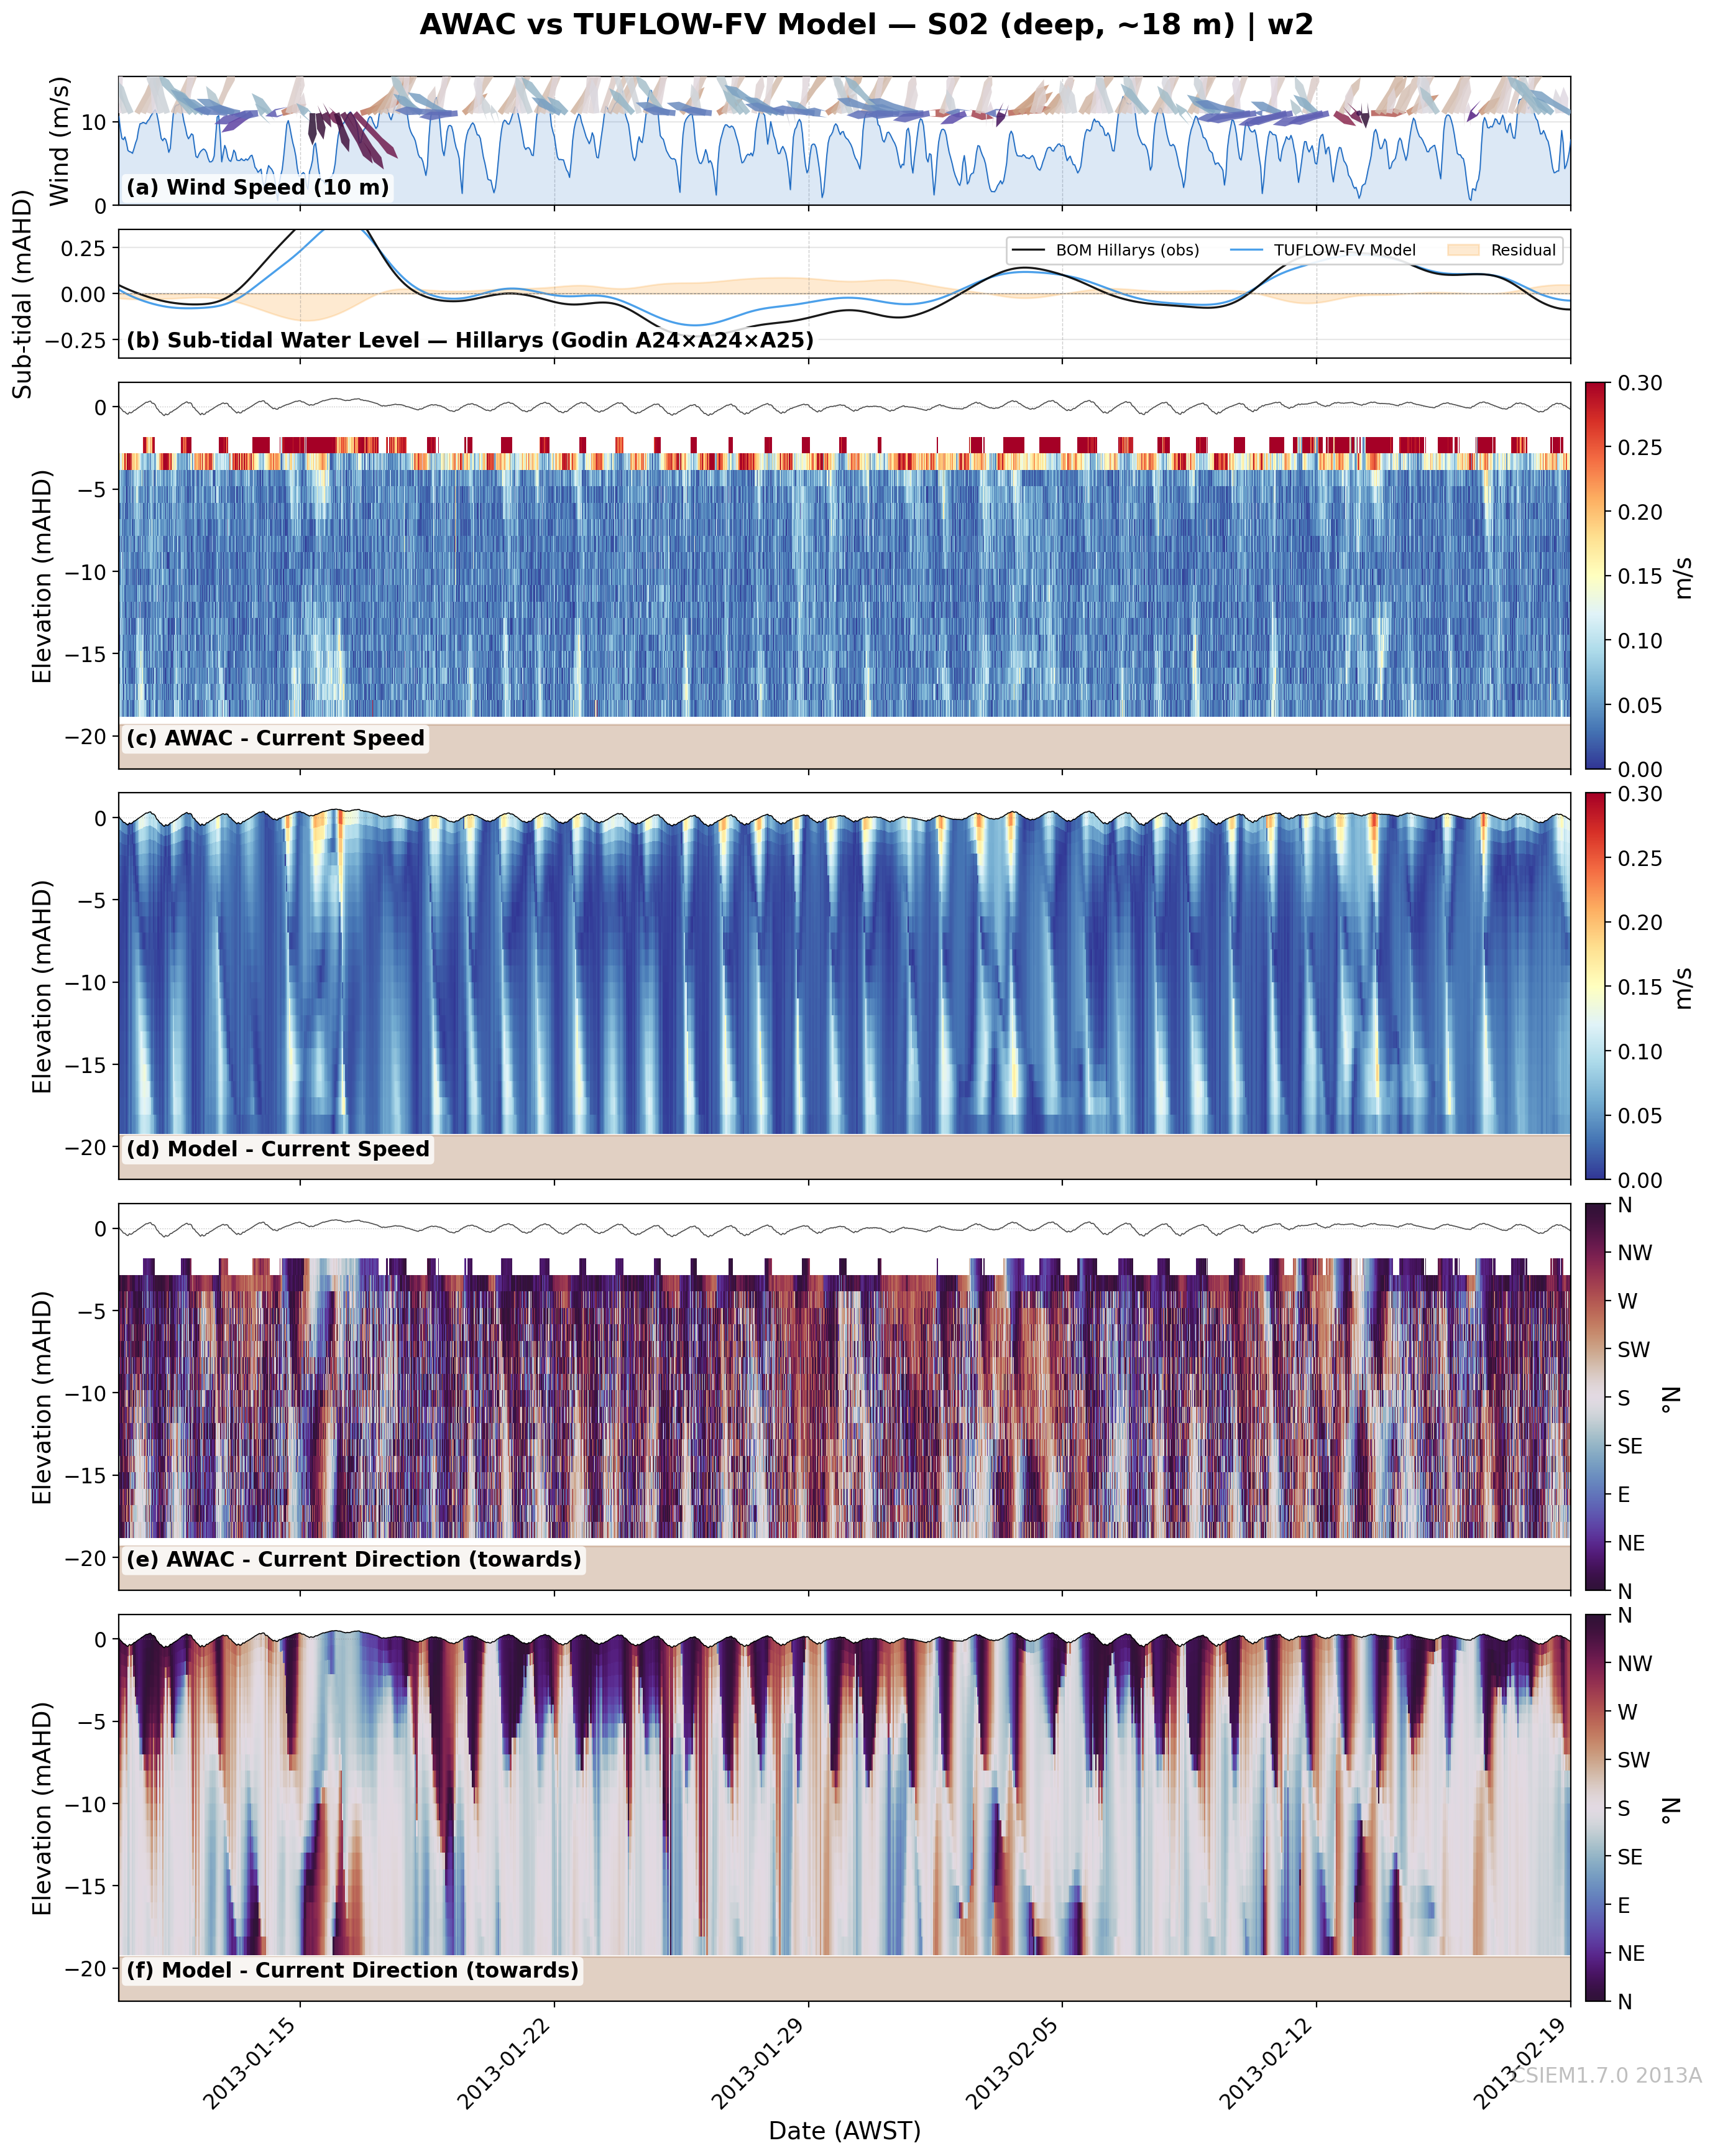
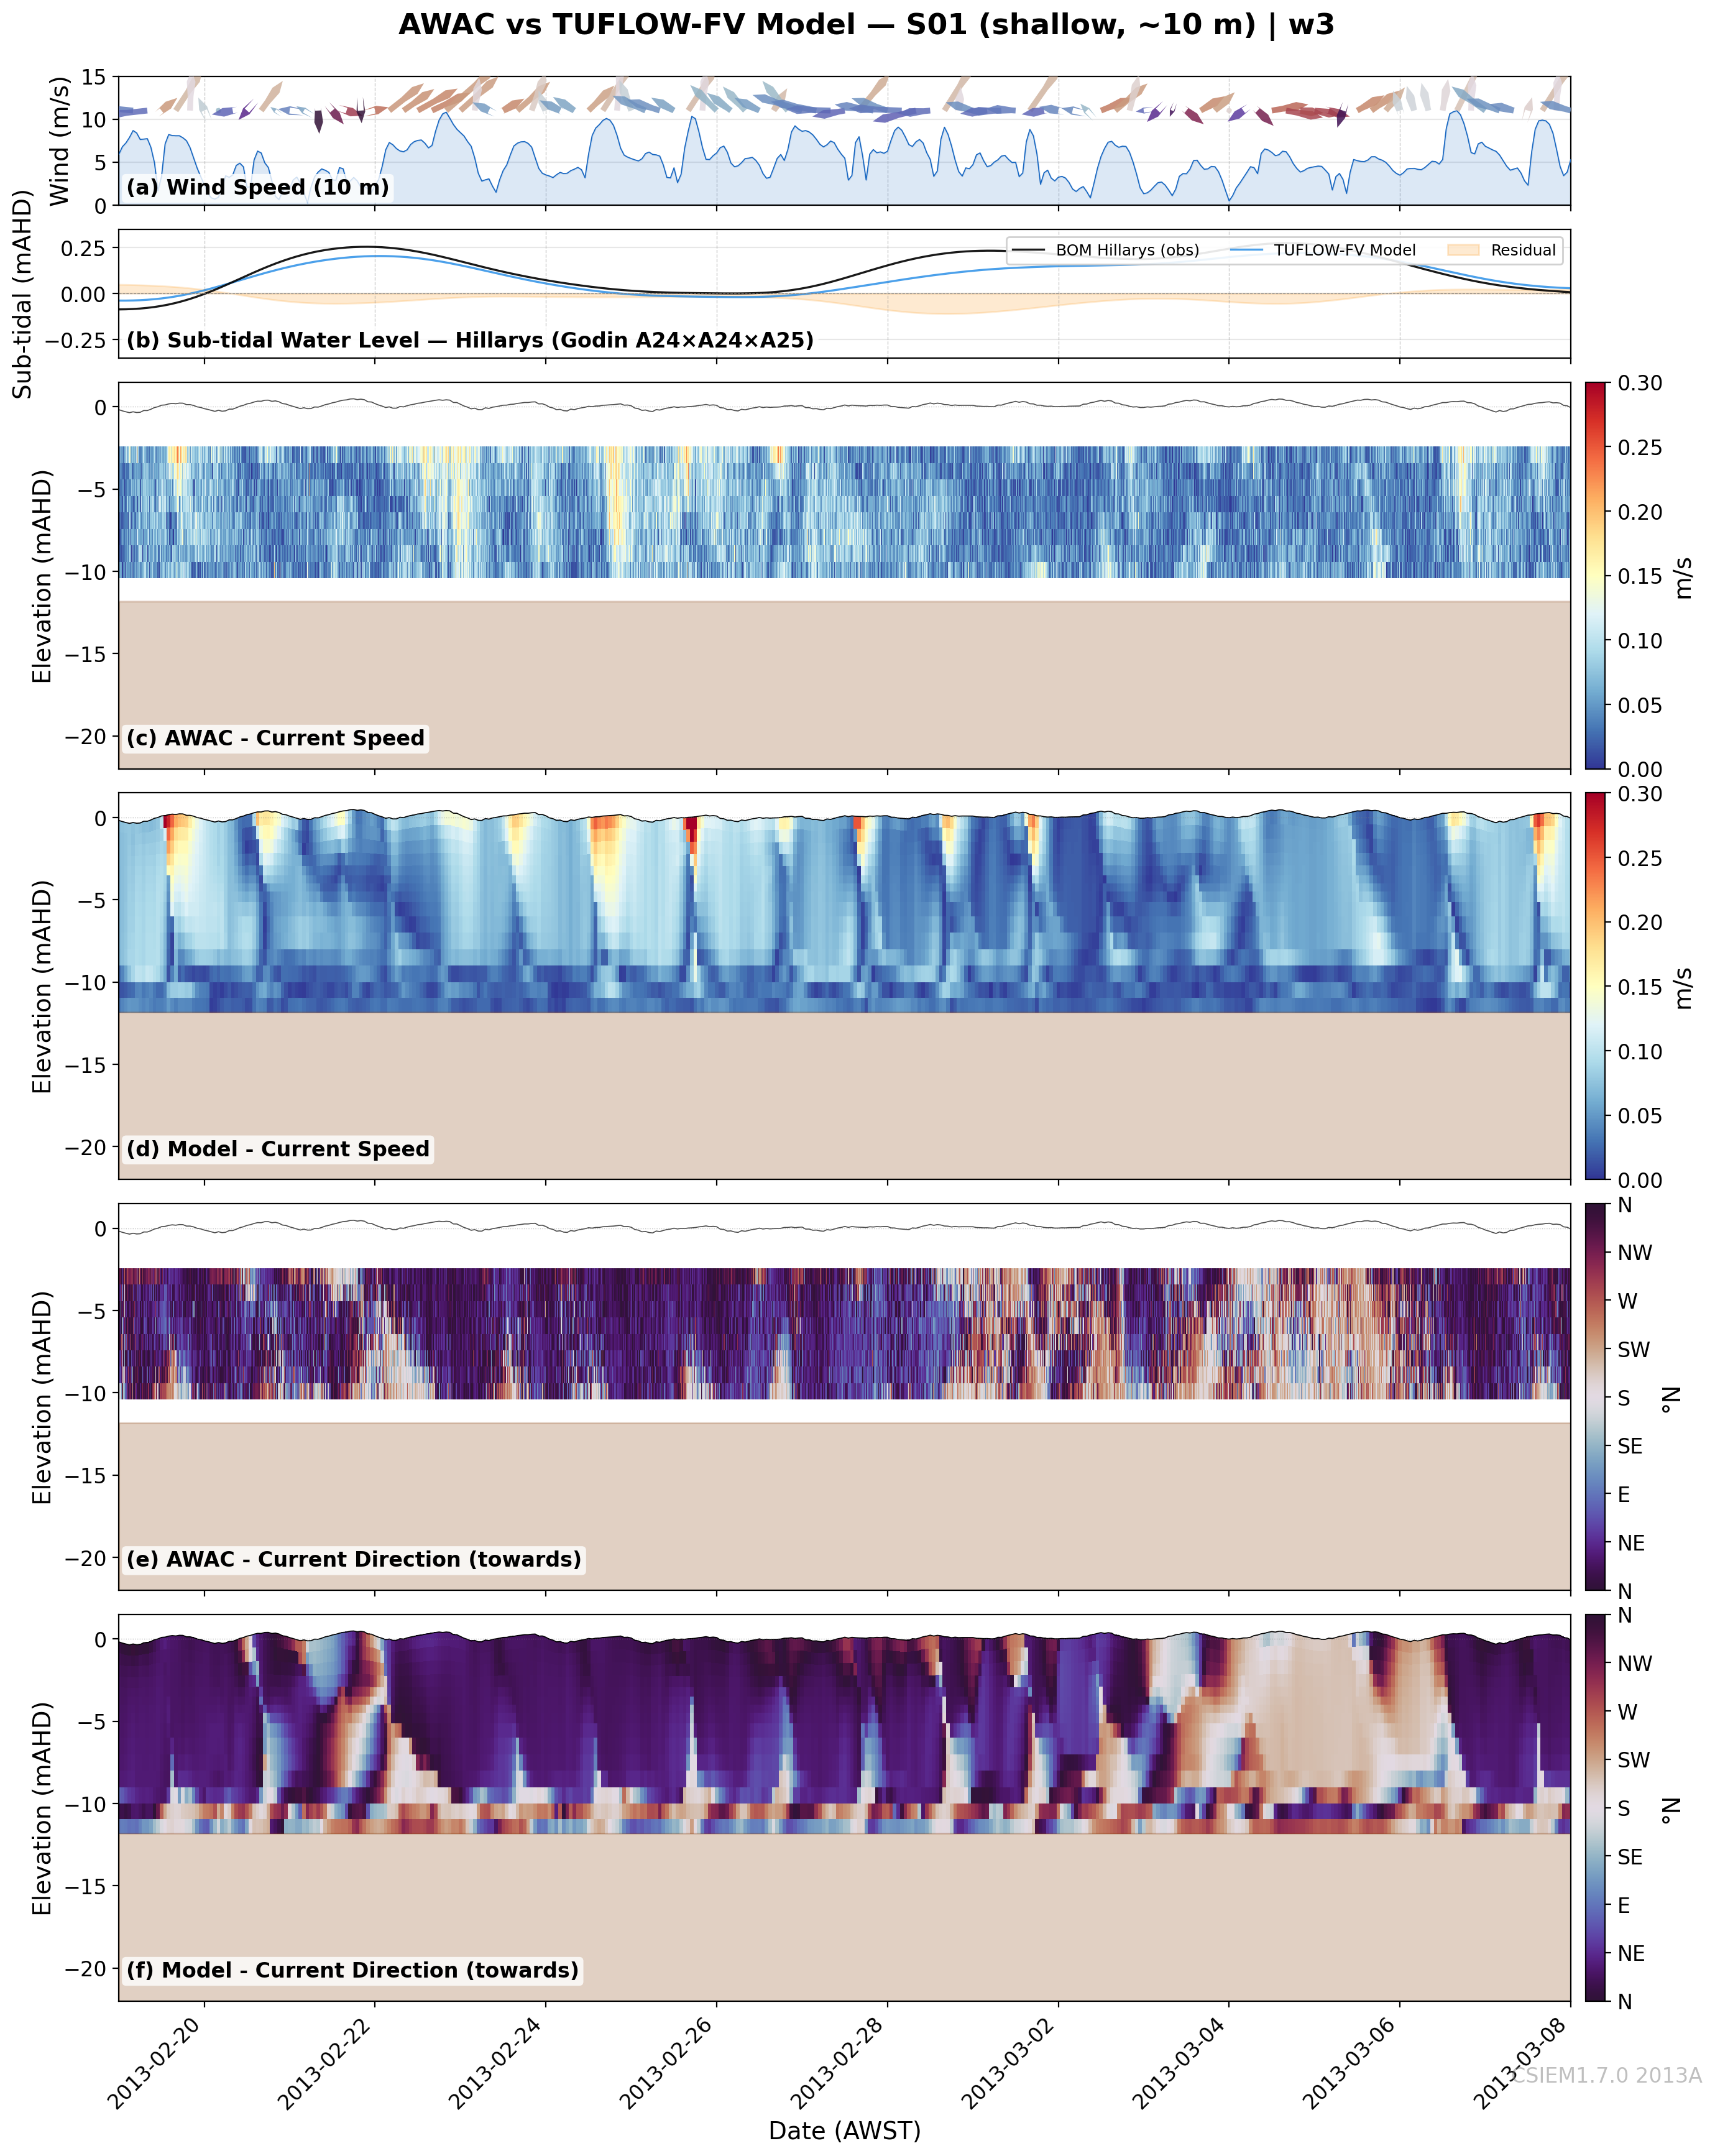
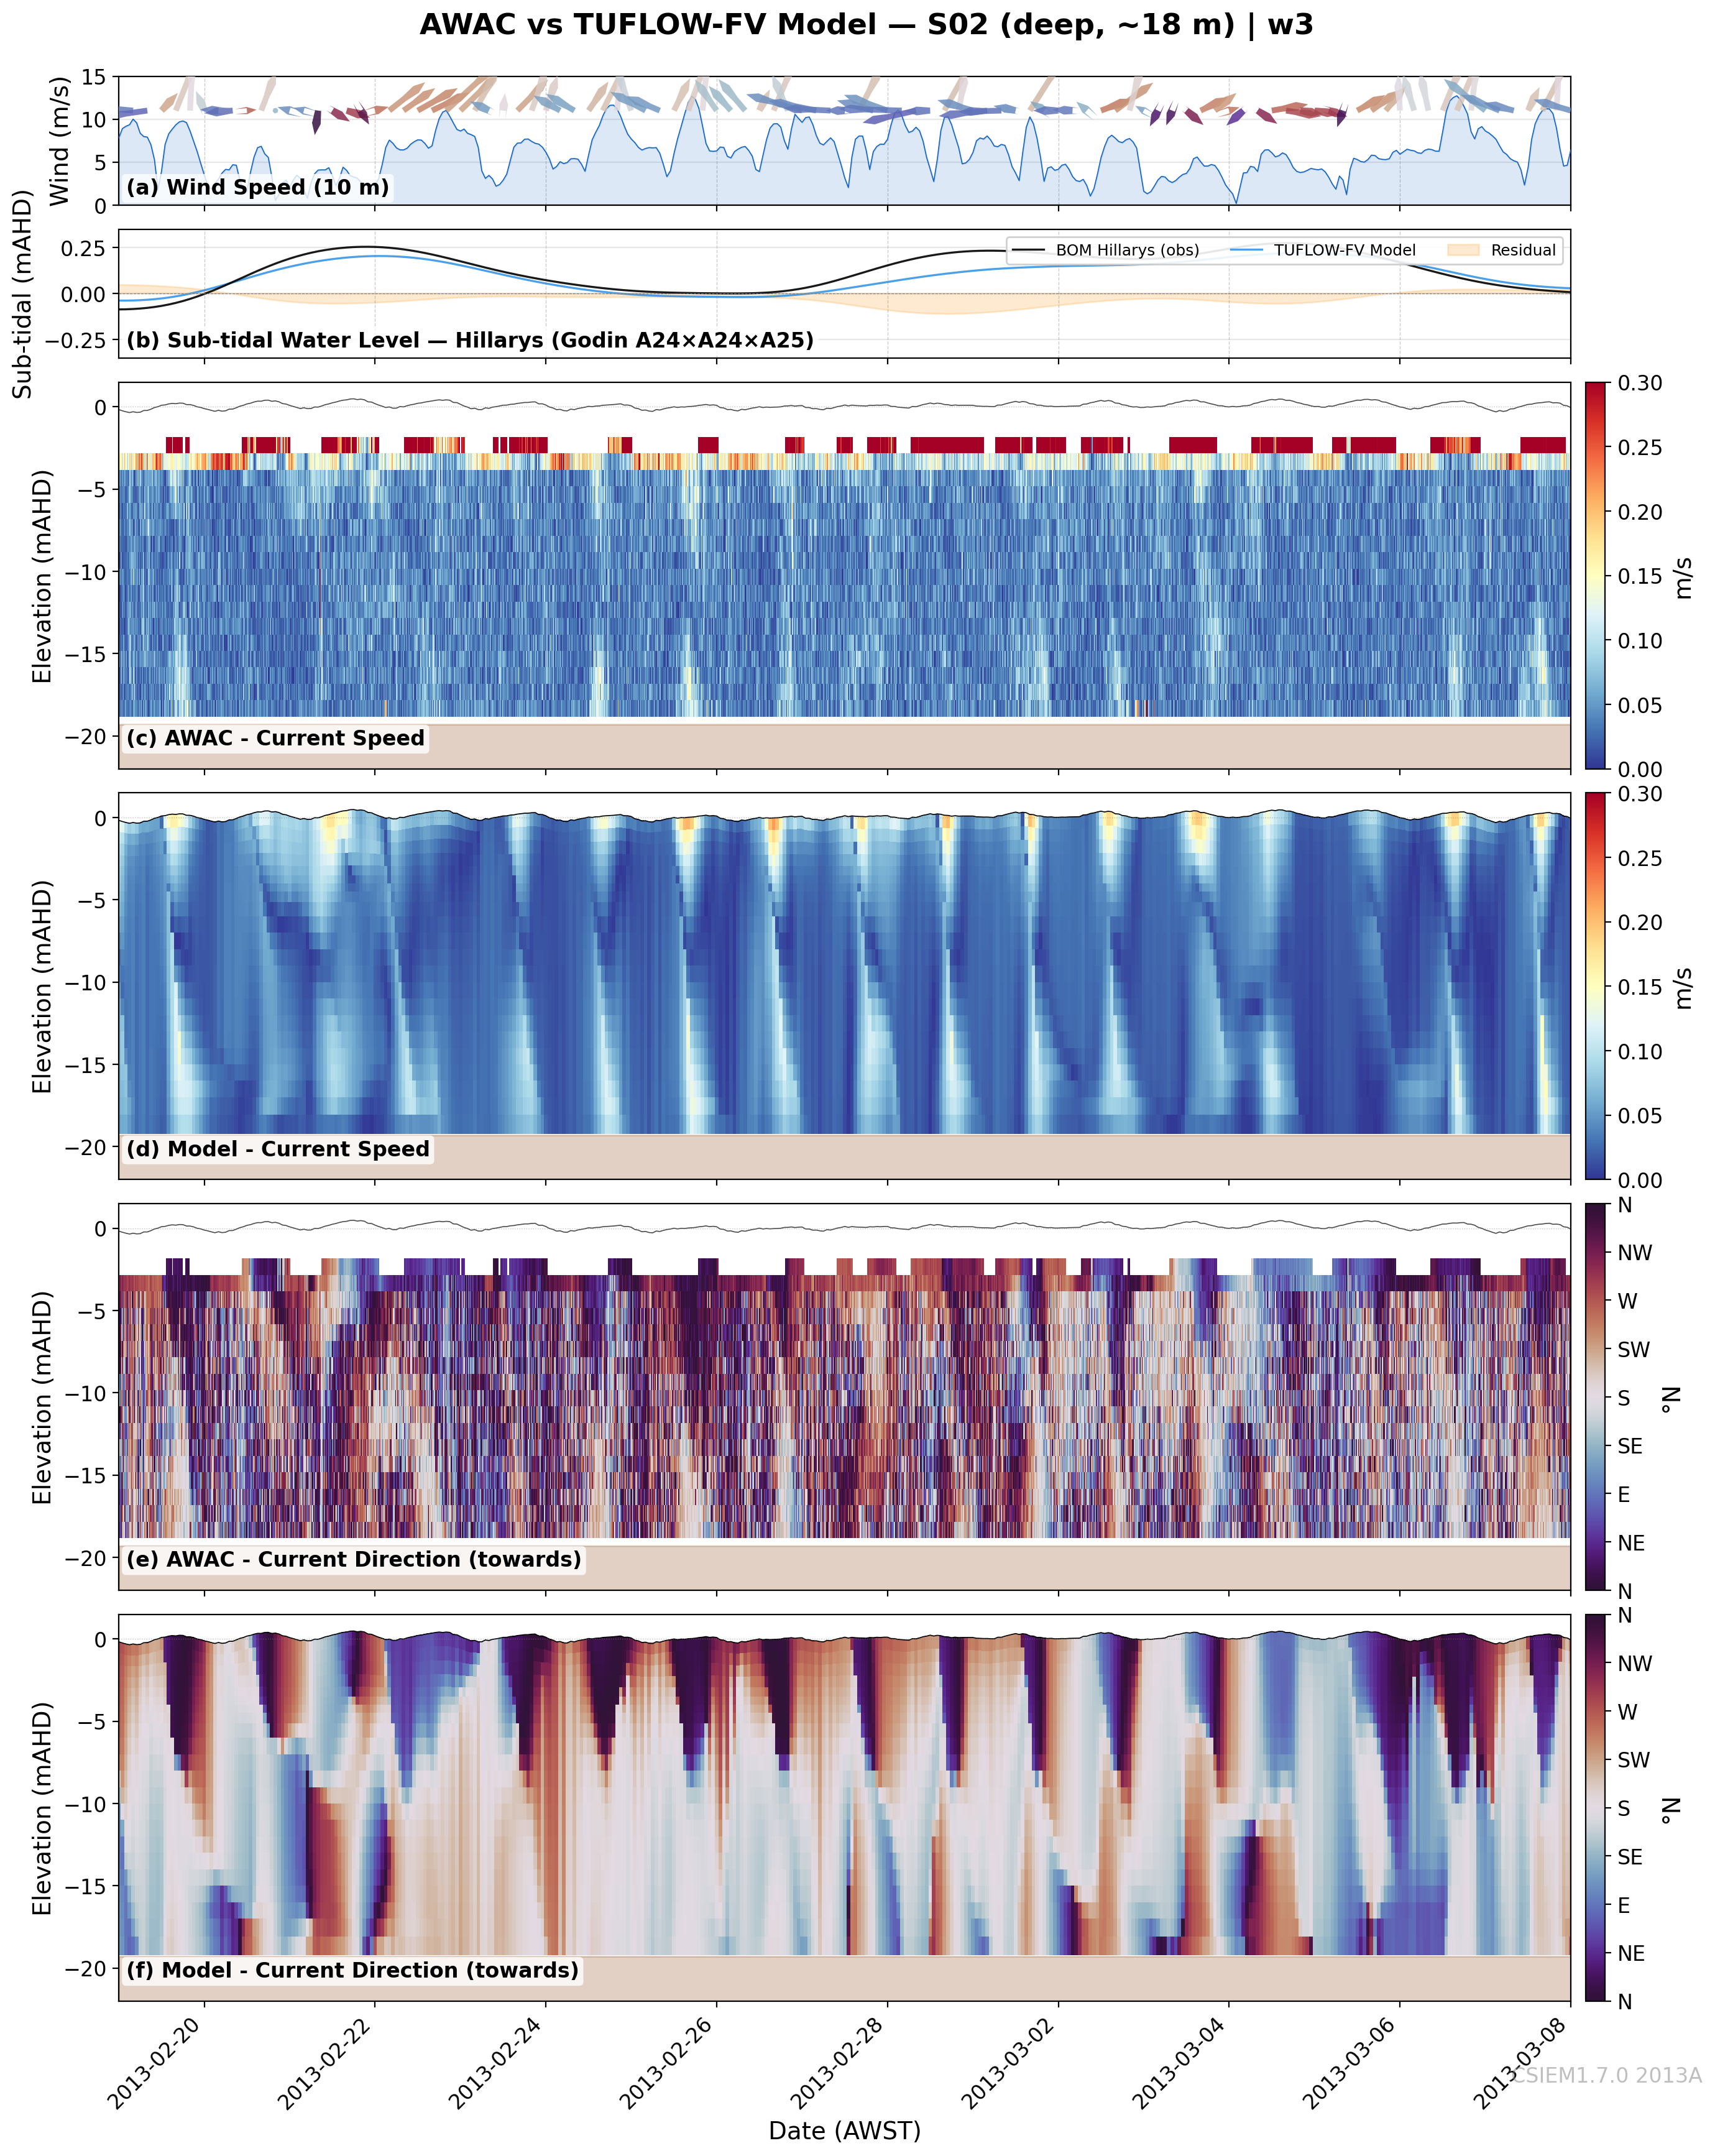
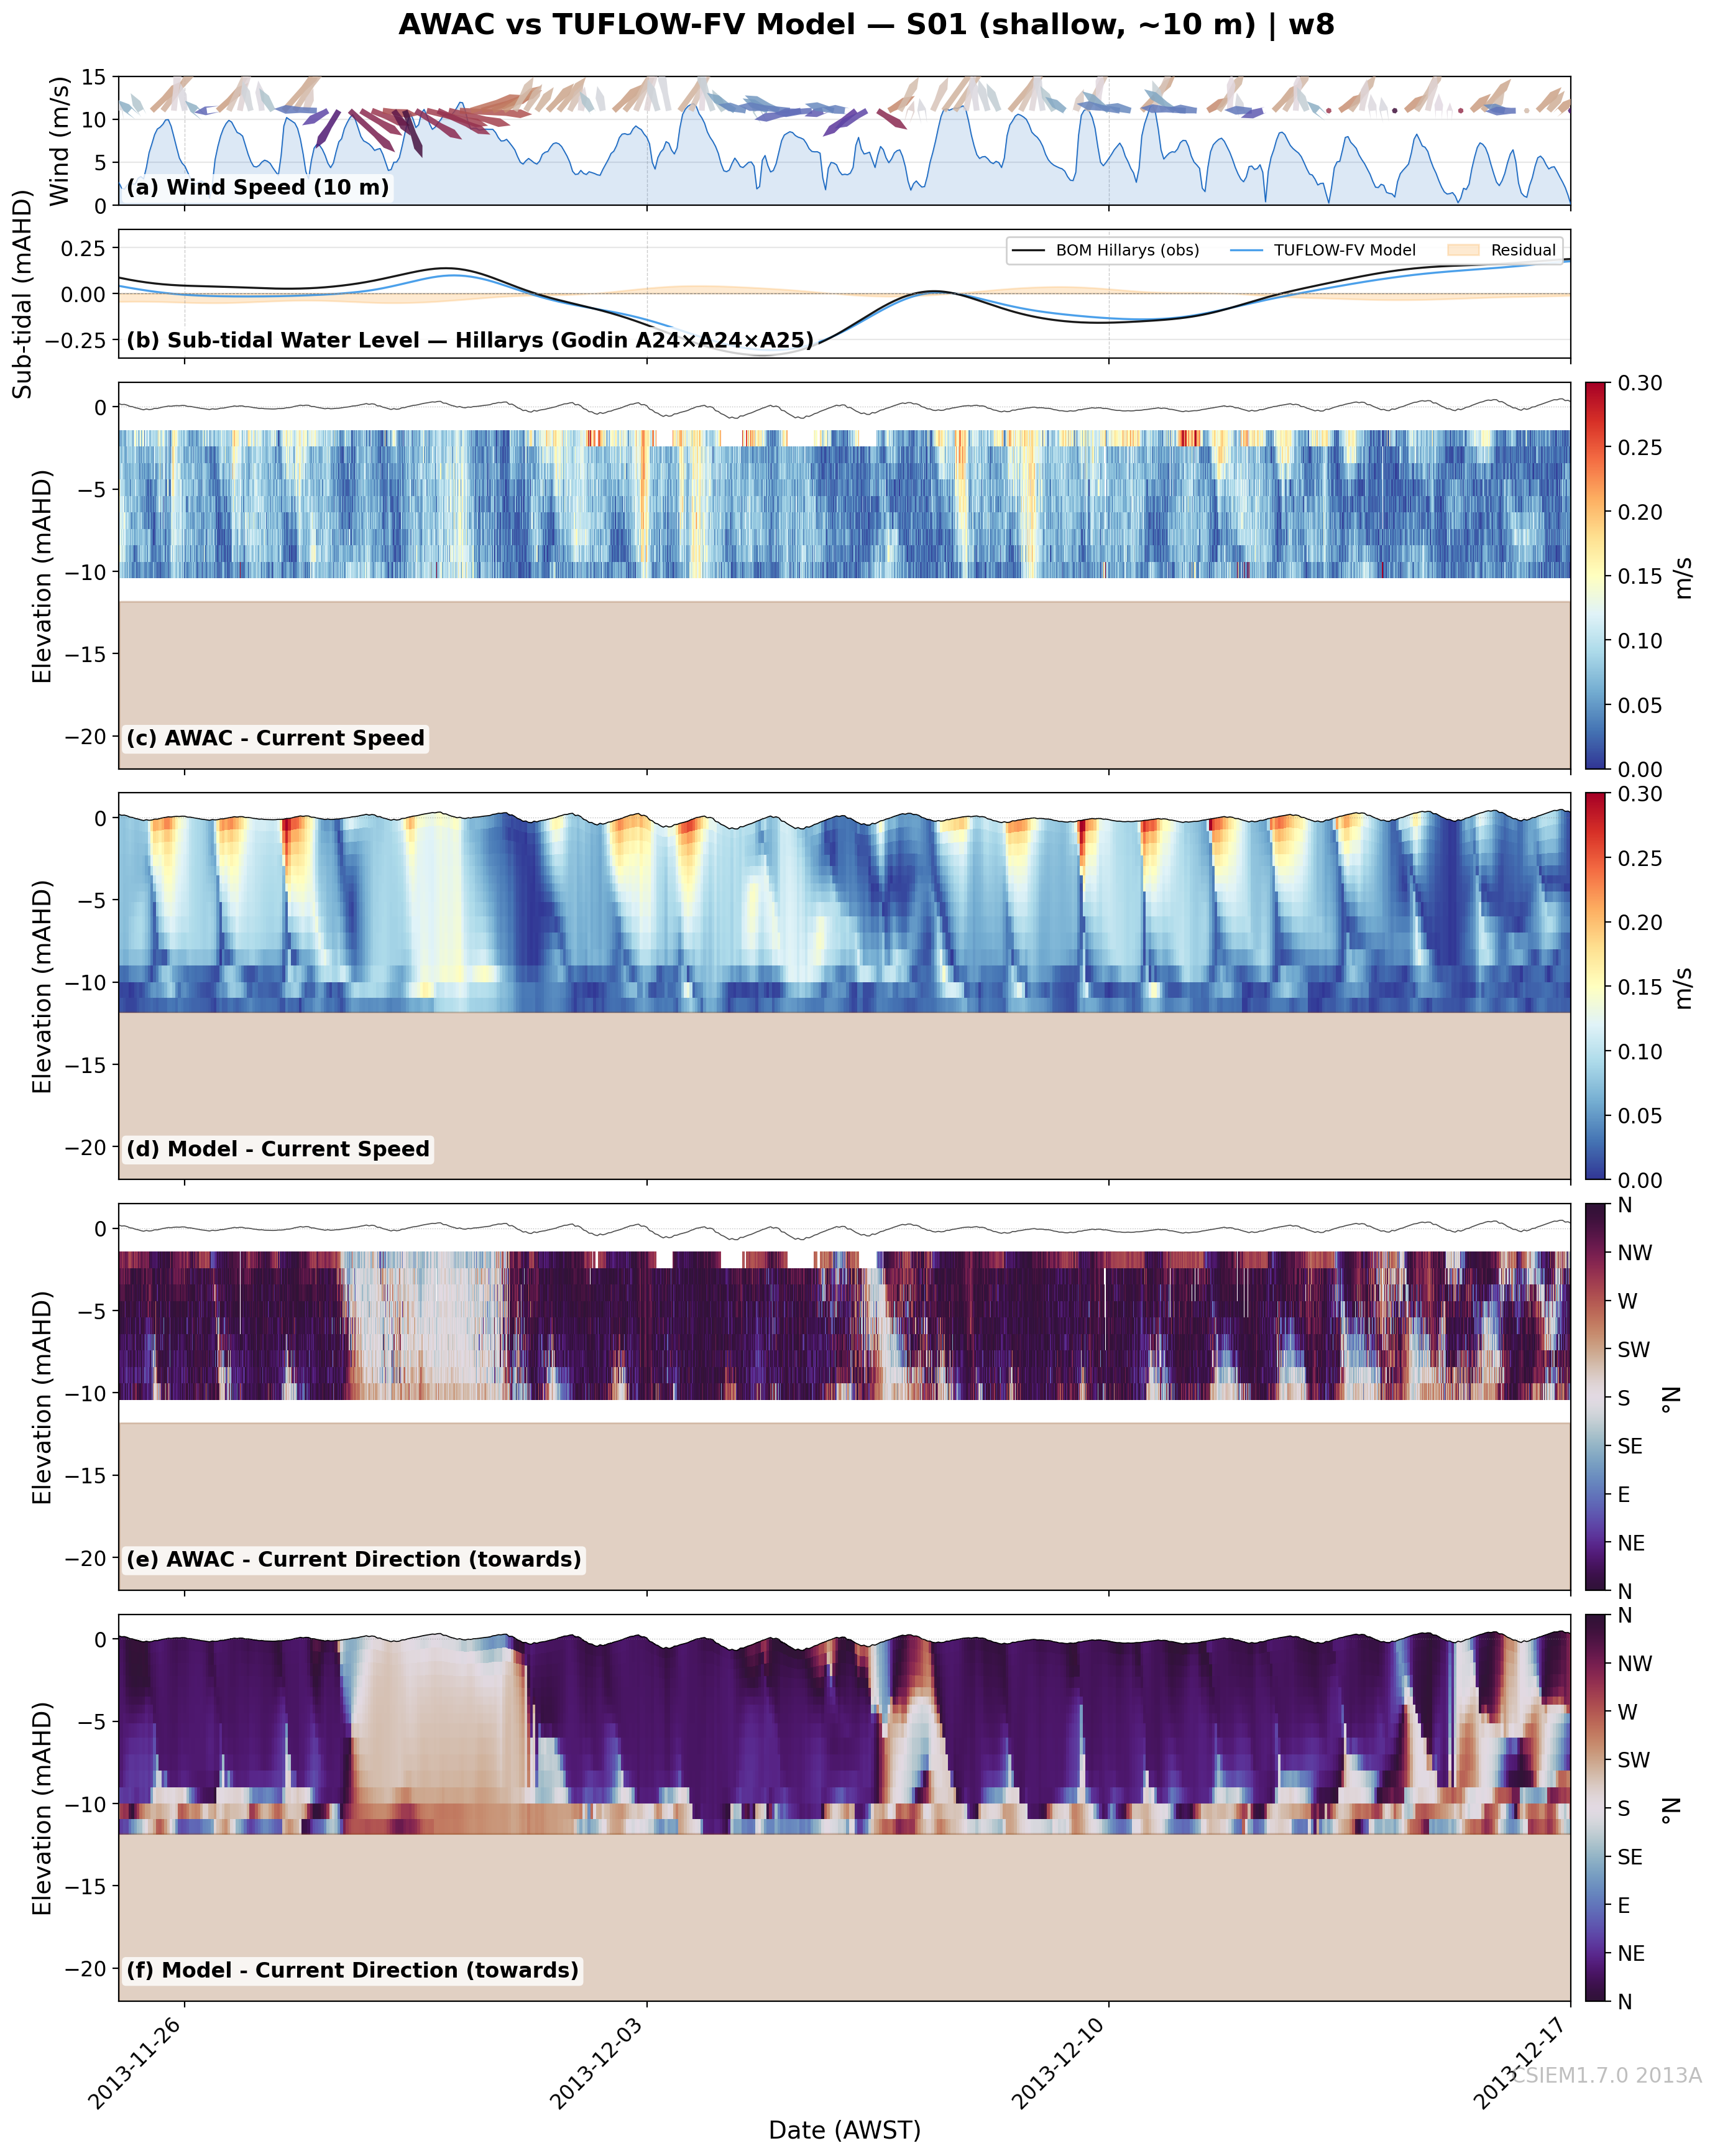
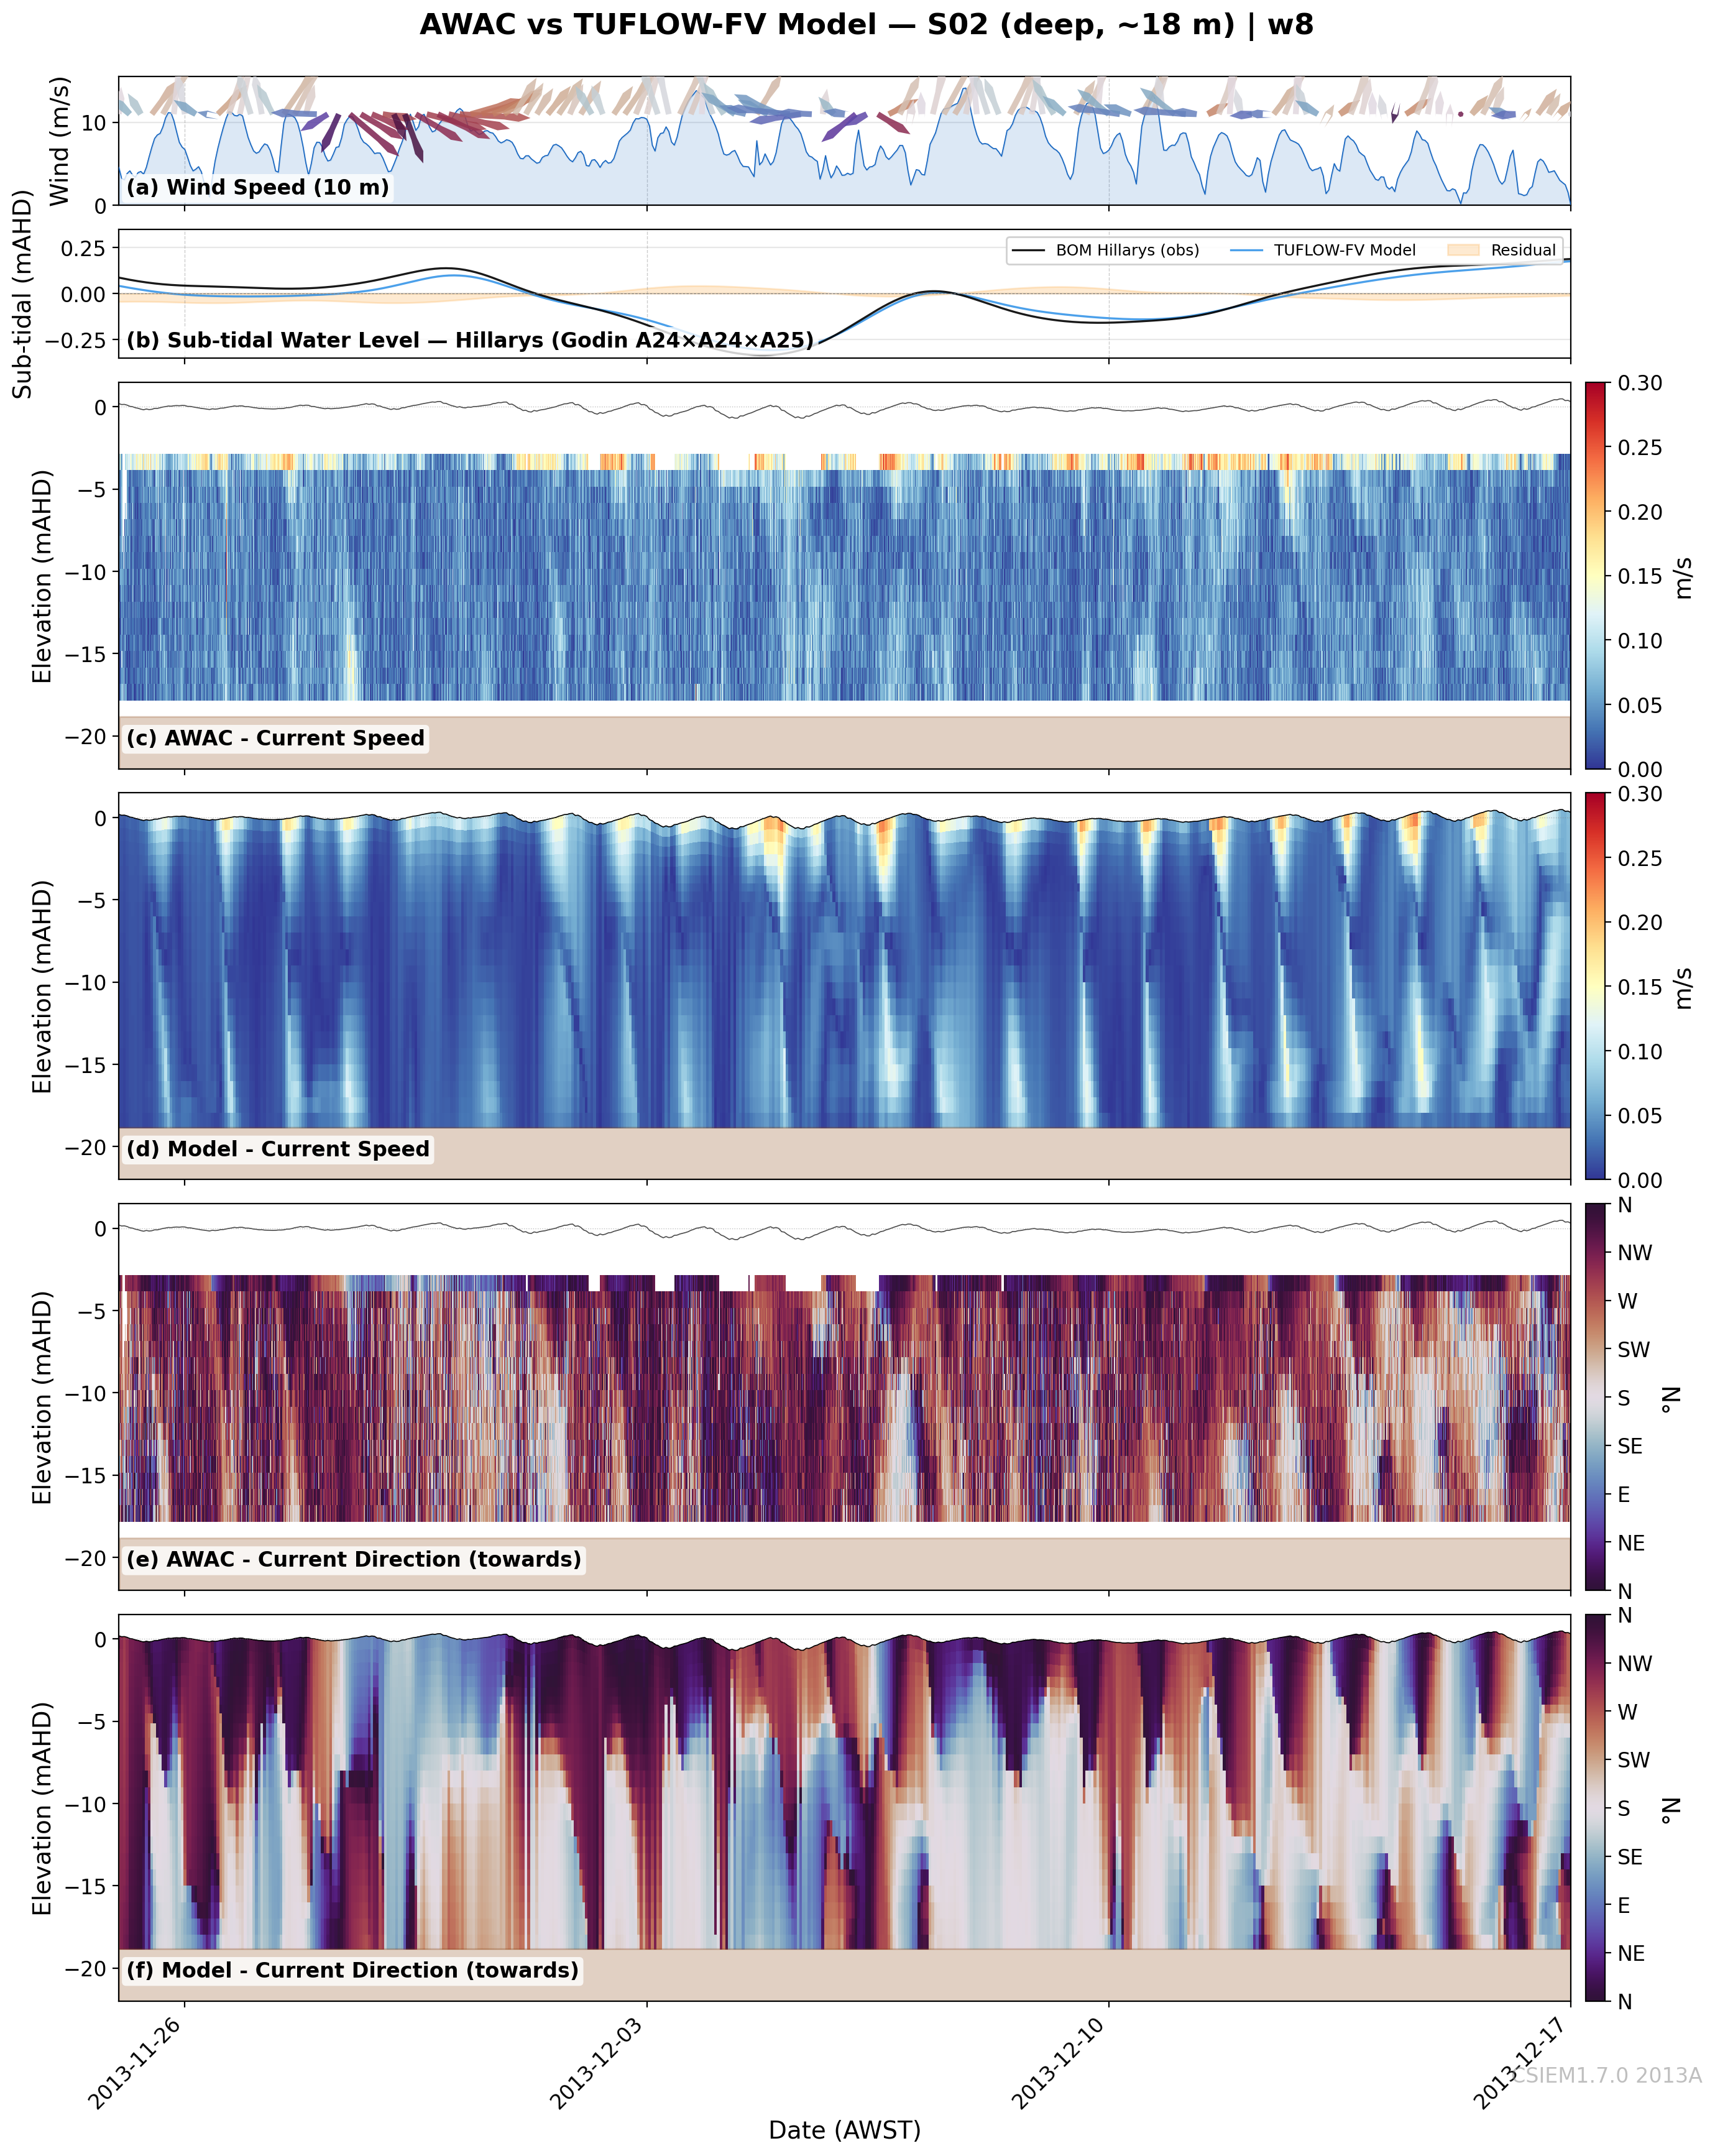
AWAC Mooring Sites
North of Cockburn Sound, Western Australia S01 (~10 m) and S02 (~18 m)
AWAC Data Window Coverage
16 site–window combinations assessed across 8 windows.
Window
Period
Days
S01
S02
w1 Early Summer
2012-12-01 – 2013-01-10
40
✓
✓
w2 Late Summer
2013-01-10 – 2013-02-19
40
✓
✓
w3 Late Summer
2013-02-19 – 2013-03-08
17
✓
✓
w4 Autumn
2013-03-10 – 2013-04-18
39
✓
✓
w5 Late Autumn
2013-04-18 – 2013-05-27
39
✓
✓
w6 Spring
2013-09-02 – 2013-10-14
42
✓
✓
w7 Late Spring
2013-10-14 – 2013-11-25
42
✓
✓
w8 Early Summer
2013-11-25 – 2013-12-17
22
✓
✓
w12012-12-01 – 2013-01-10
w22013-01-10 – 2013-02-19
w32013-02-19 – 2013-03-08
w42013-03-10 – 2013-04-18
w52013-04-18 – 2013-05-27
w62013-09-02 – 2013-10-14
w72013-10-14 – 2013-11-25
w82013-11-25 – 2013-12-17
S01 (10m) — Shallow (~10 m)
S02 (18m) — Deep (~18 m)
S01 (10m) — Shallow (~10 m)
S02 (18m) — Deep (~18 m)
S01 (10m) — Shallow (~10 m)
S02 (18m) — Deep (~18 m)
S01 (10m) — Shallow (~10 m)
S02 (18m) — Deep (~18 m)
S01 (10m) — Shallow (~10 m)
S02 (18m) — Deep (~18 m)
S01 (10m) — Shallow (~10 m)
S02 (18m) — Deep (~18 m)
S01 (10m) — Shallow (~10 m)
S02 (18m) — Deep (~18 m)
S01 (10m) — Shallow (~10 m)
S02 (18m) — Deep (~18 m)
Data Source & Notes
The AWAC (Acoustic Wave and Current) profiler data were collected by
JPPL (James Point Pty Ltd) as part of a 2013
field campaign north of Cockburn Sound. Two bottom-mounted Nortek AWACs were deployed:
S01 (shallow shelf, ~10 m depth, 15 vertical bins) and S02 (deeper basin, ~18 m depth, 25 bins).
Deployments span December 2012 to December 2013, with data gaps at each site
when instruments were serviced (S01 gap: Jun–Sep; S02 gap: May–Jul).
Source format — original MATLAB v7.3 / HDF5 files converted to NumPy .npz via convert_awac_mat.py (requires Python 3.12 with h5py).
Per-window coordinates — S02 was physically repositioned between sub-deployments; per-window coordinates are used for model cell extraction.
Speed colourmap — fixed at 0–0.3 m/s; direction uses twilight_shifted cyclic colourmap (towards convention, °N).
Model: CSIEM1.7.0 2013A (TUFLOW-FV, A-mesh) — Nov 2012 to Dec 2013.
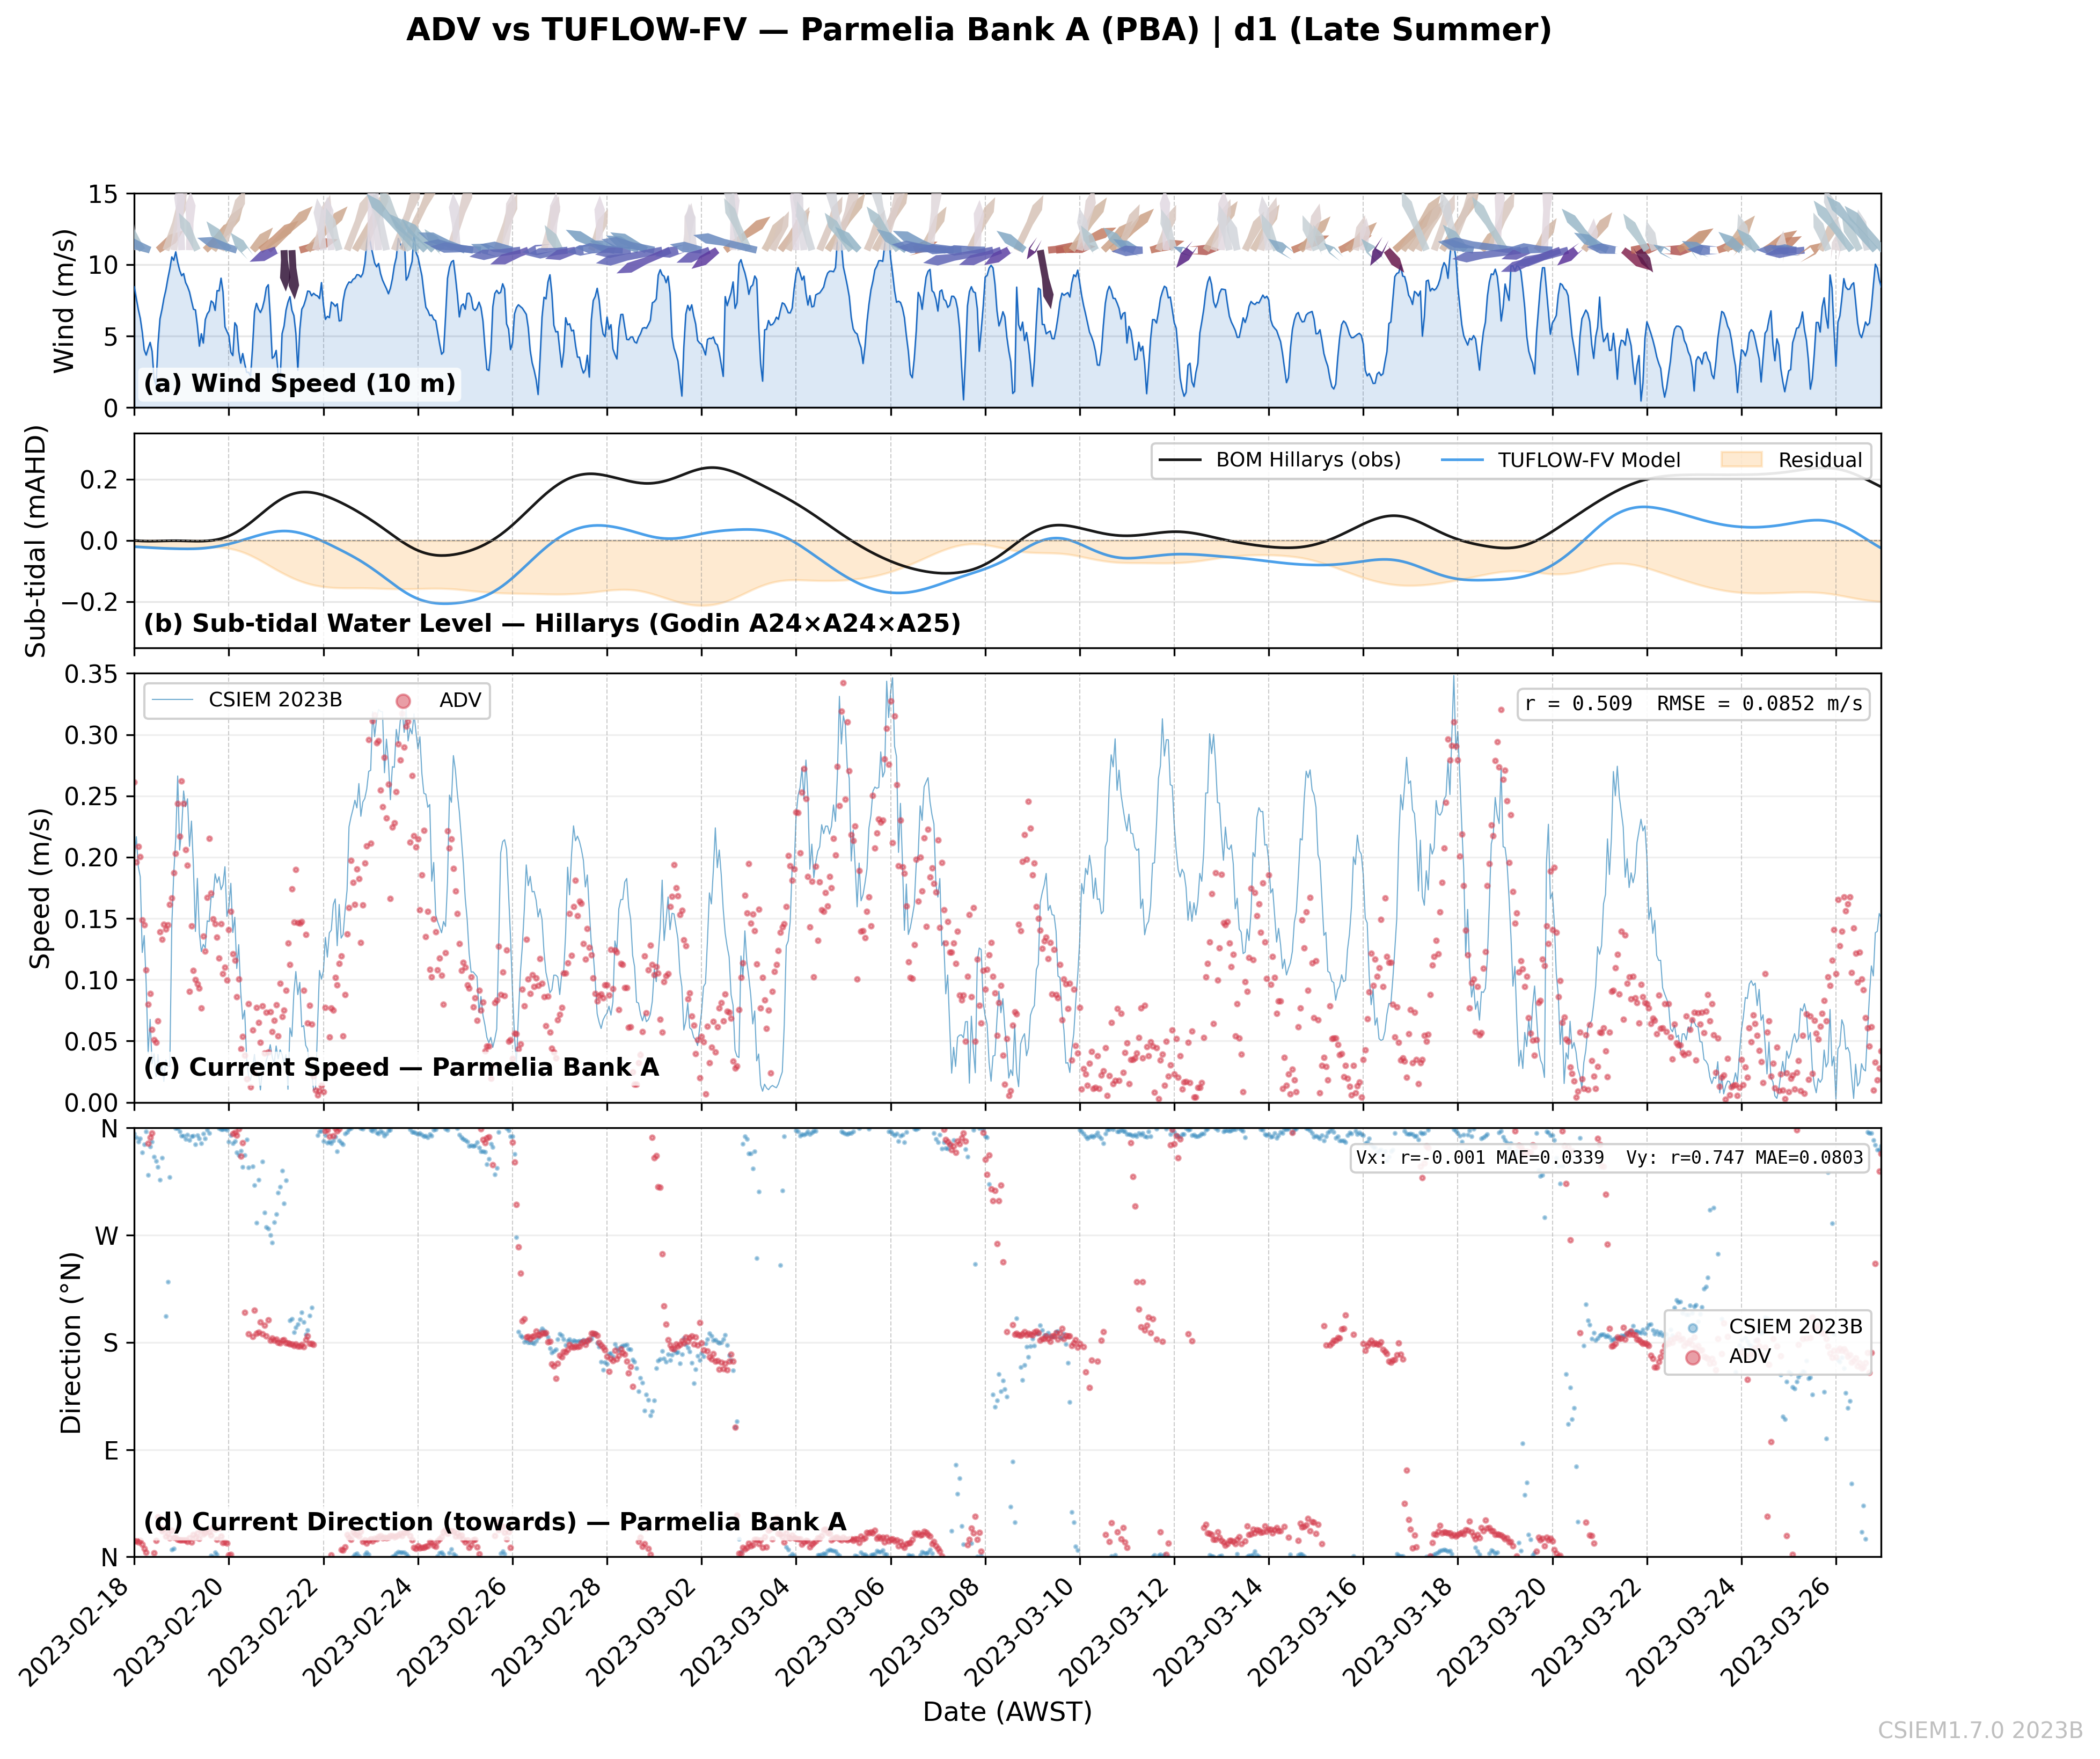
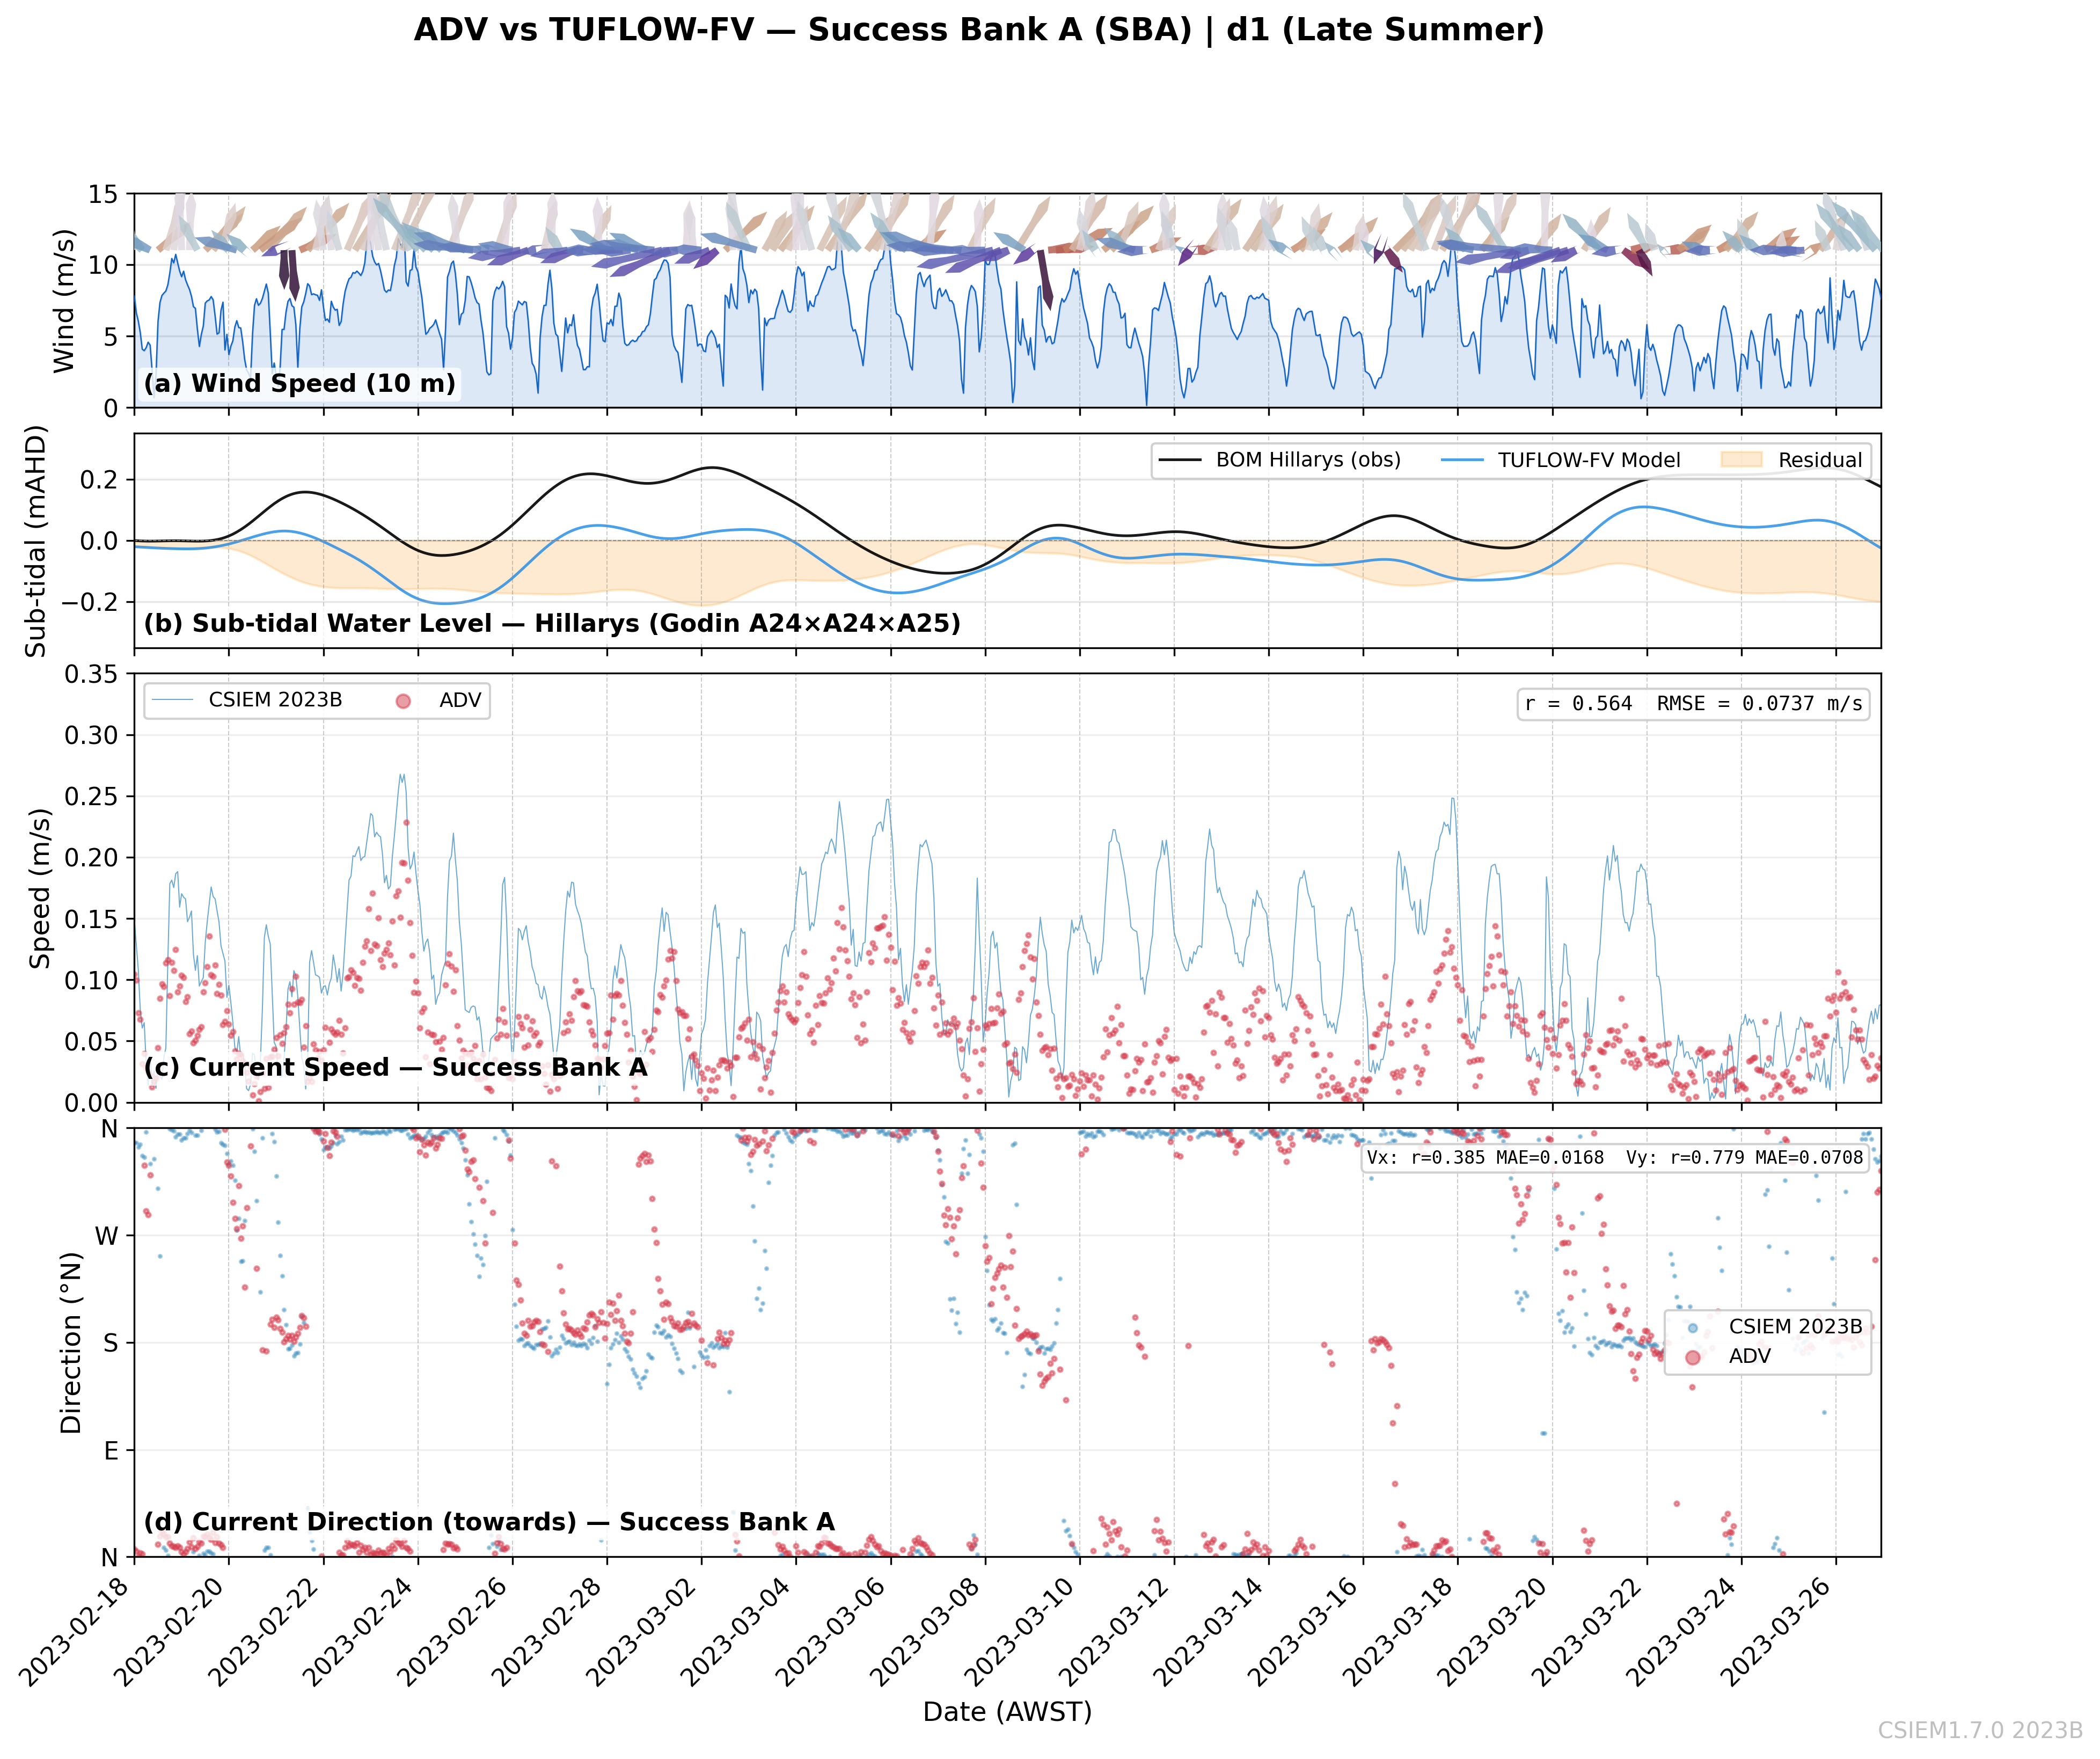
ADV Deployment Sites
Owen Anchorage & surrounds Parmelia Bank & Success Bank (~5 m depth)
Deployment Windows
4 near-bed ADV sites deployed across 4 windows in 2023–2024 (WWMSP Project 9.1, Hansen et al. 2025).
Window
Period
Season
Sites
d1
2023-02-18 – 2023-03-27
Late Summer
PBA, SBA
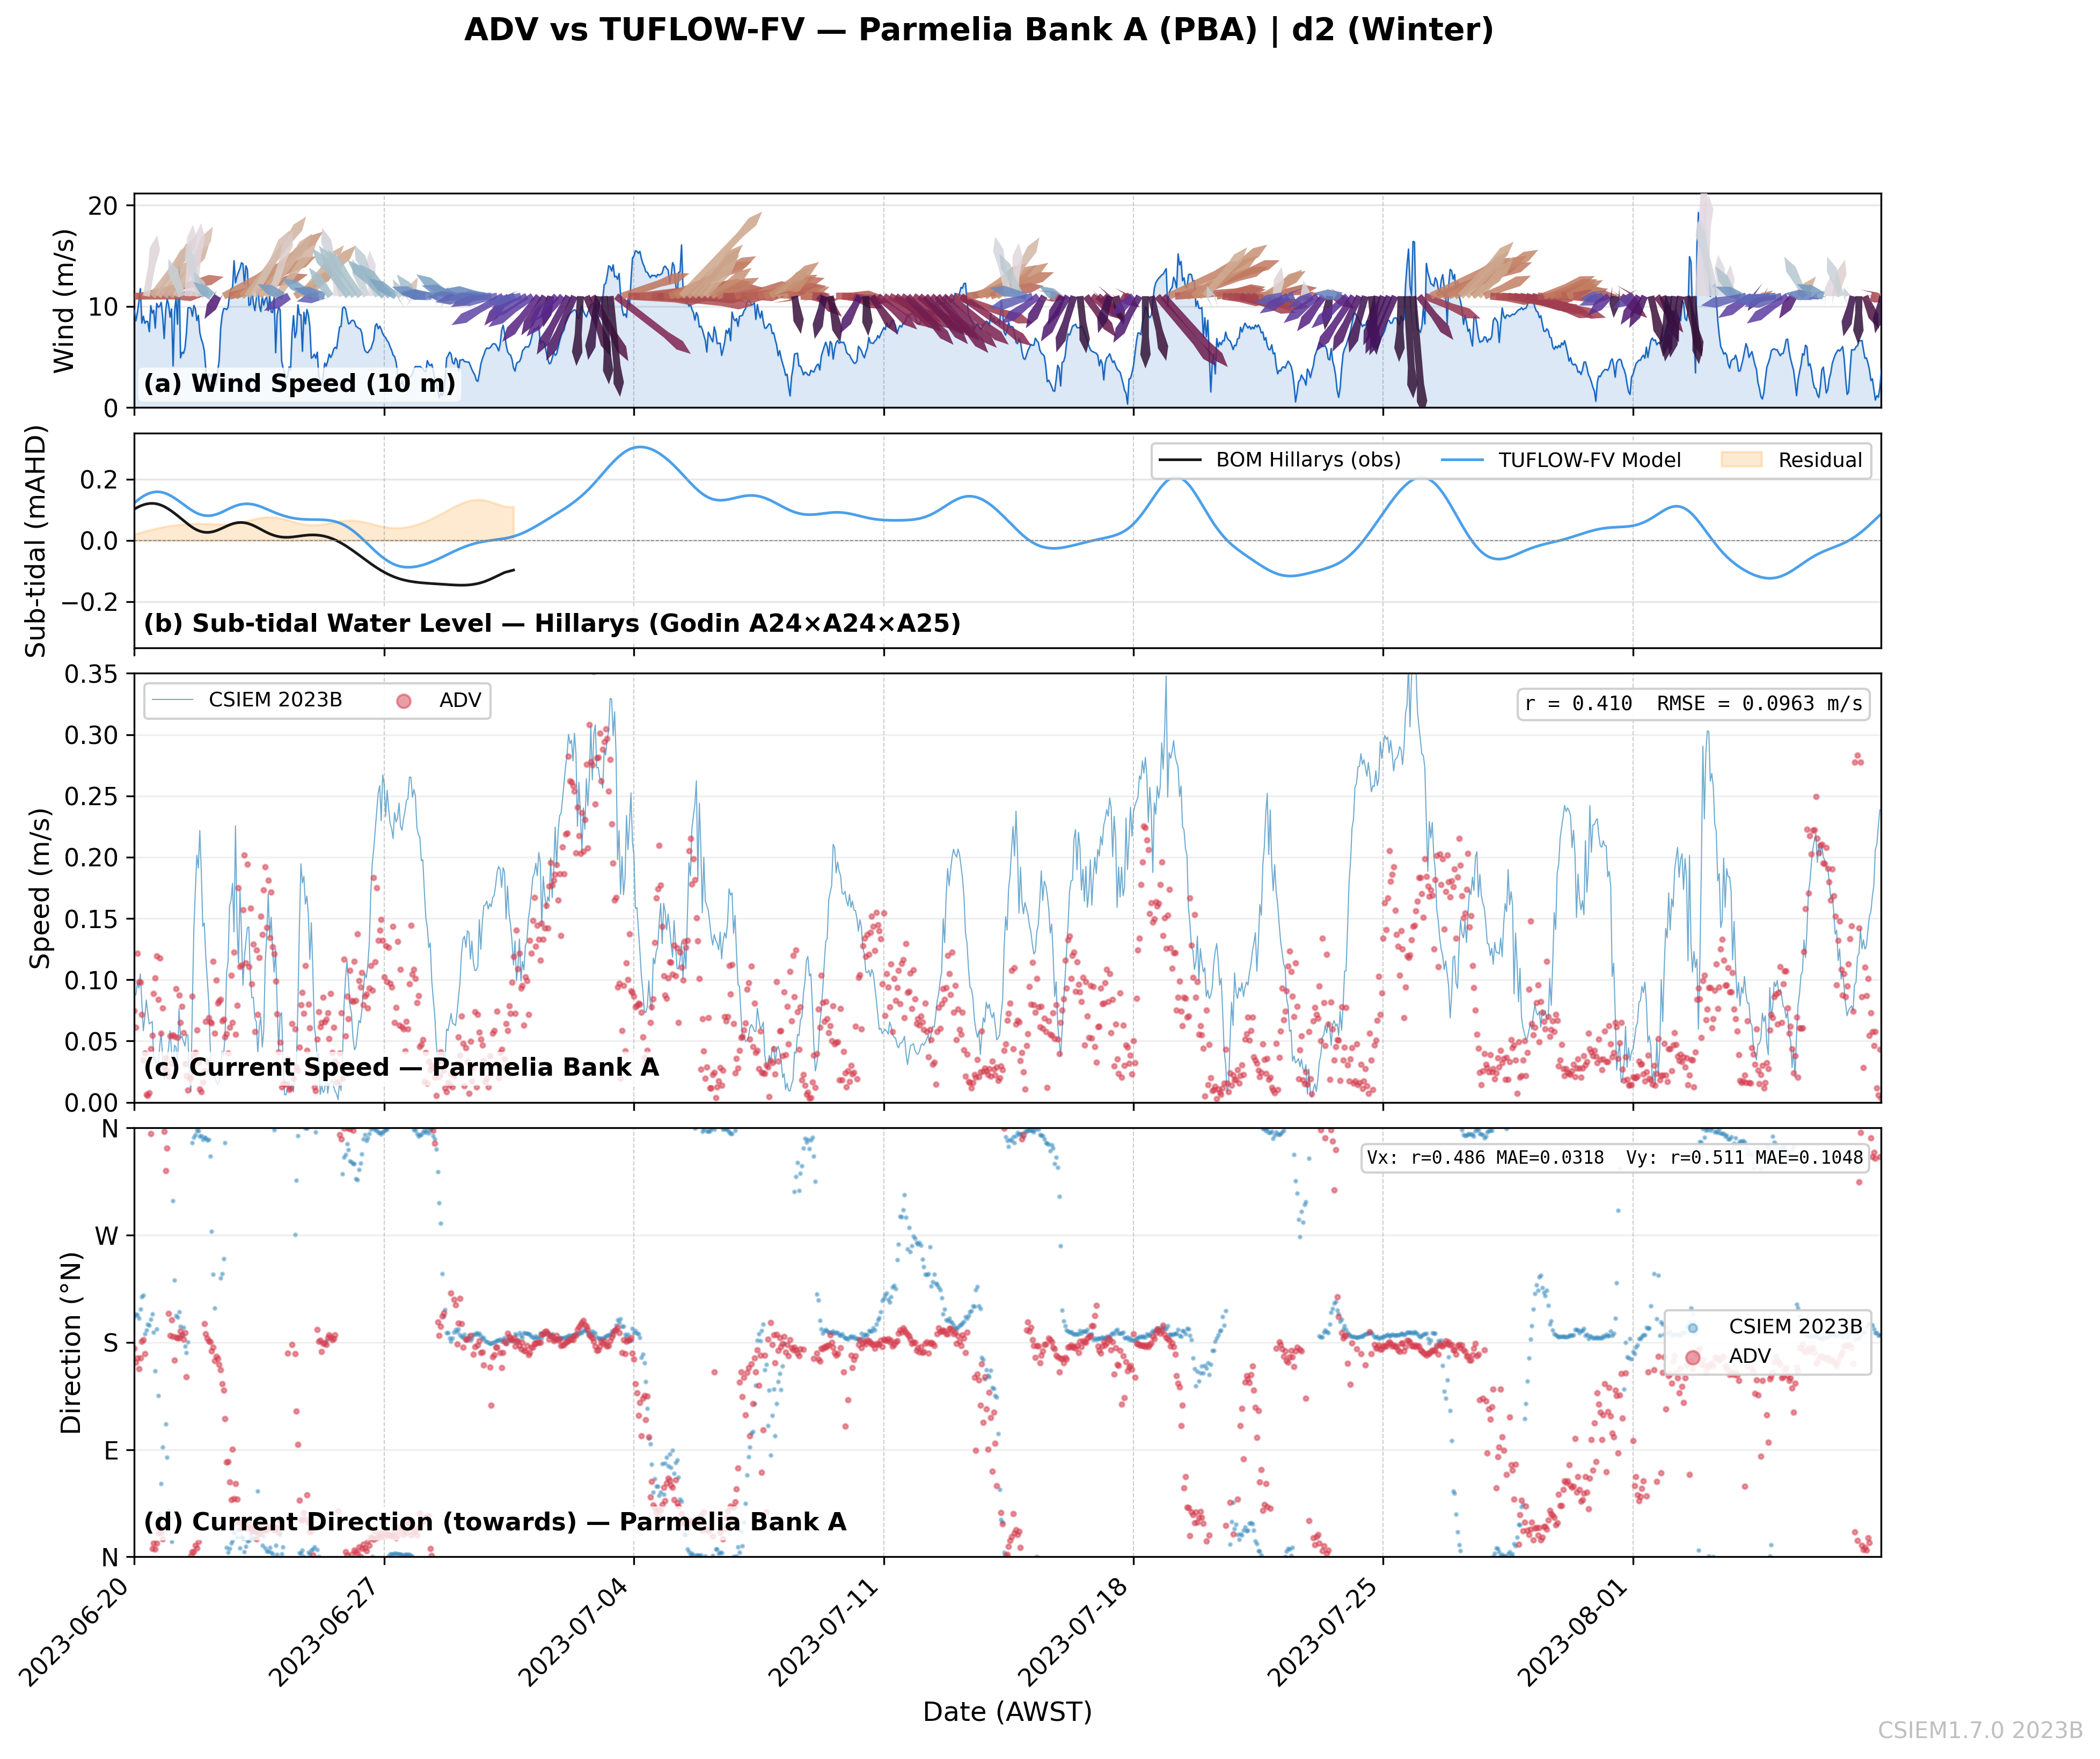
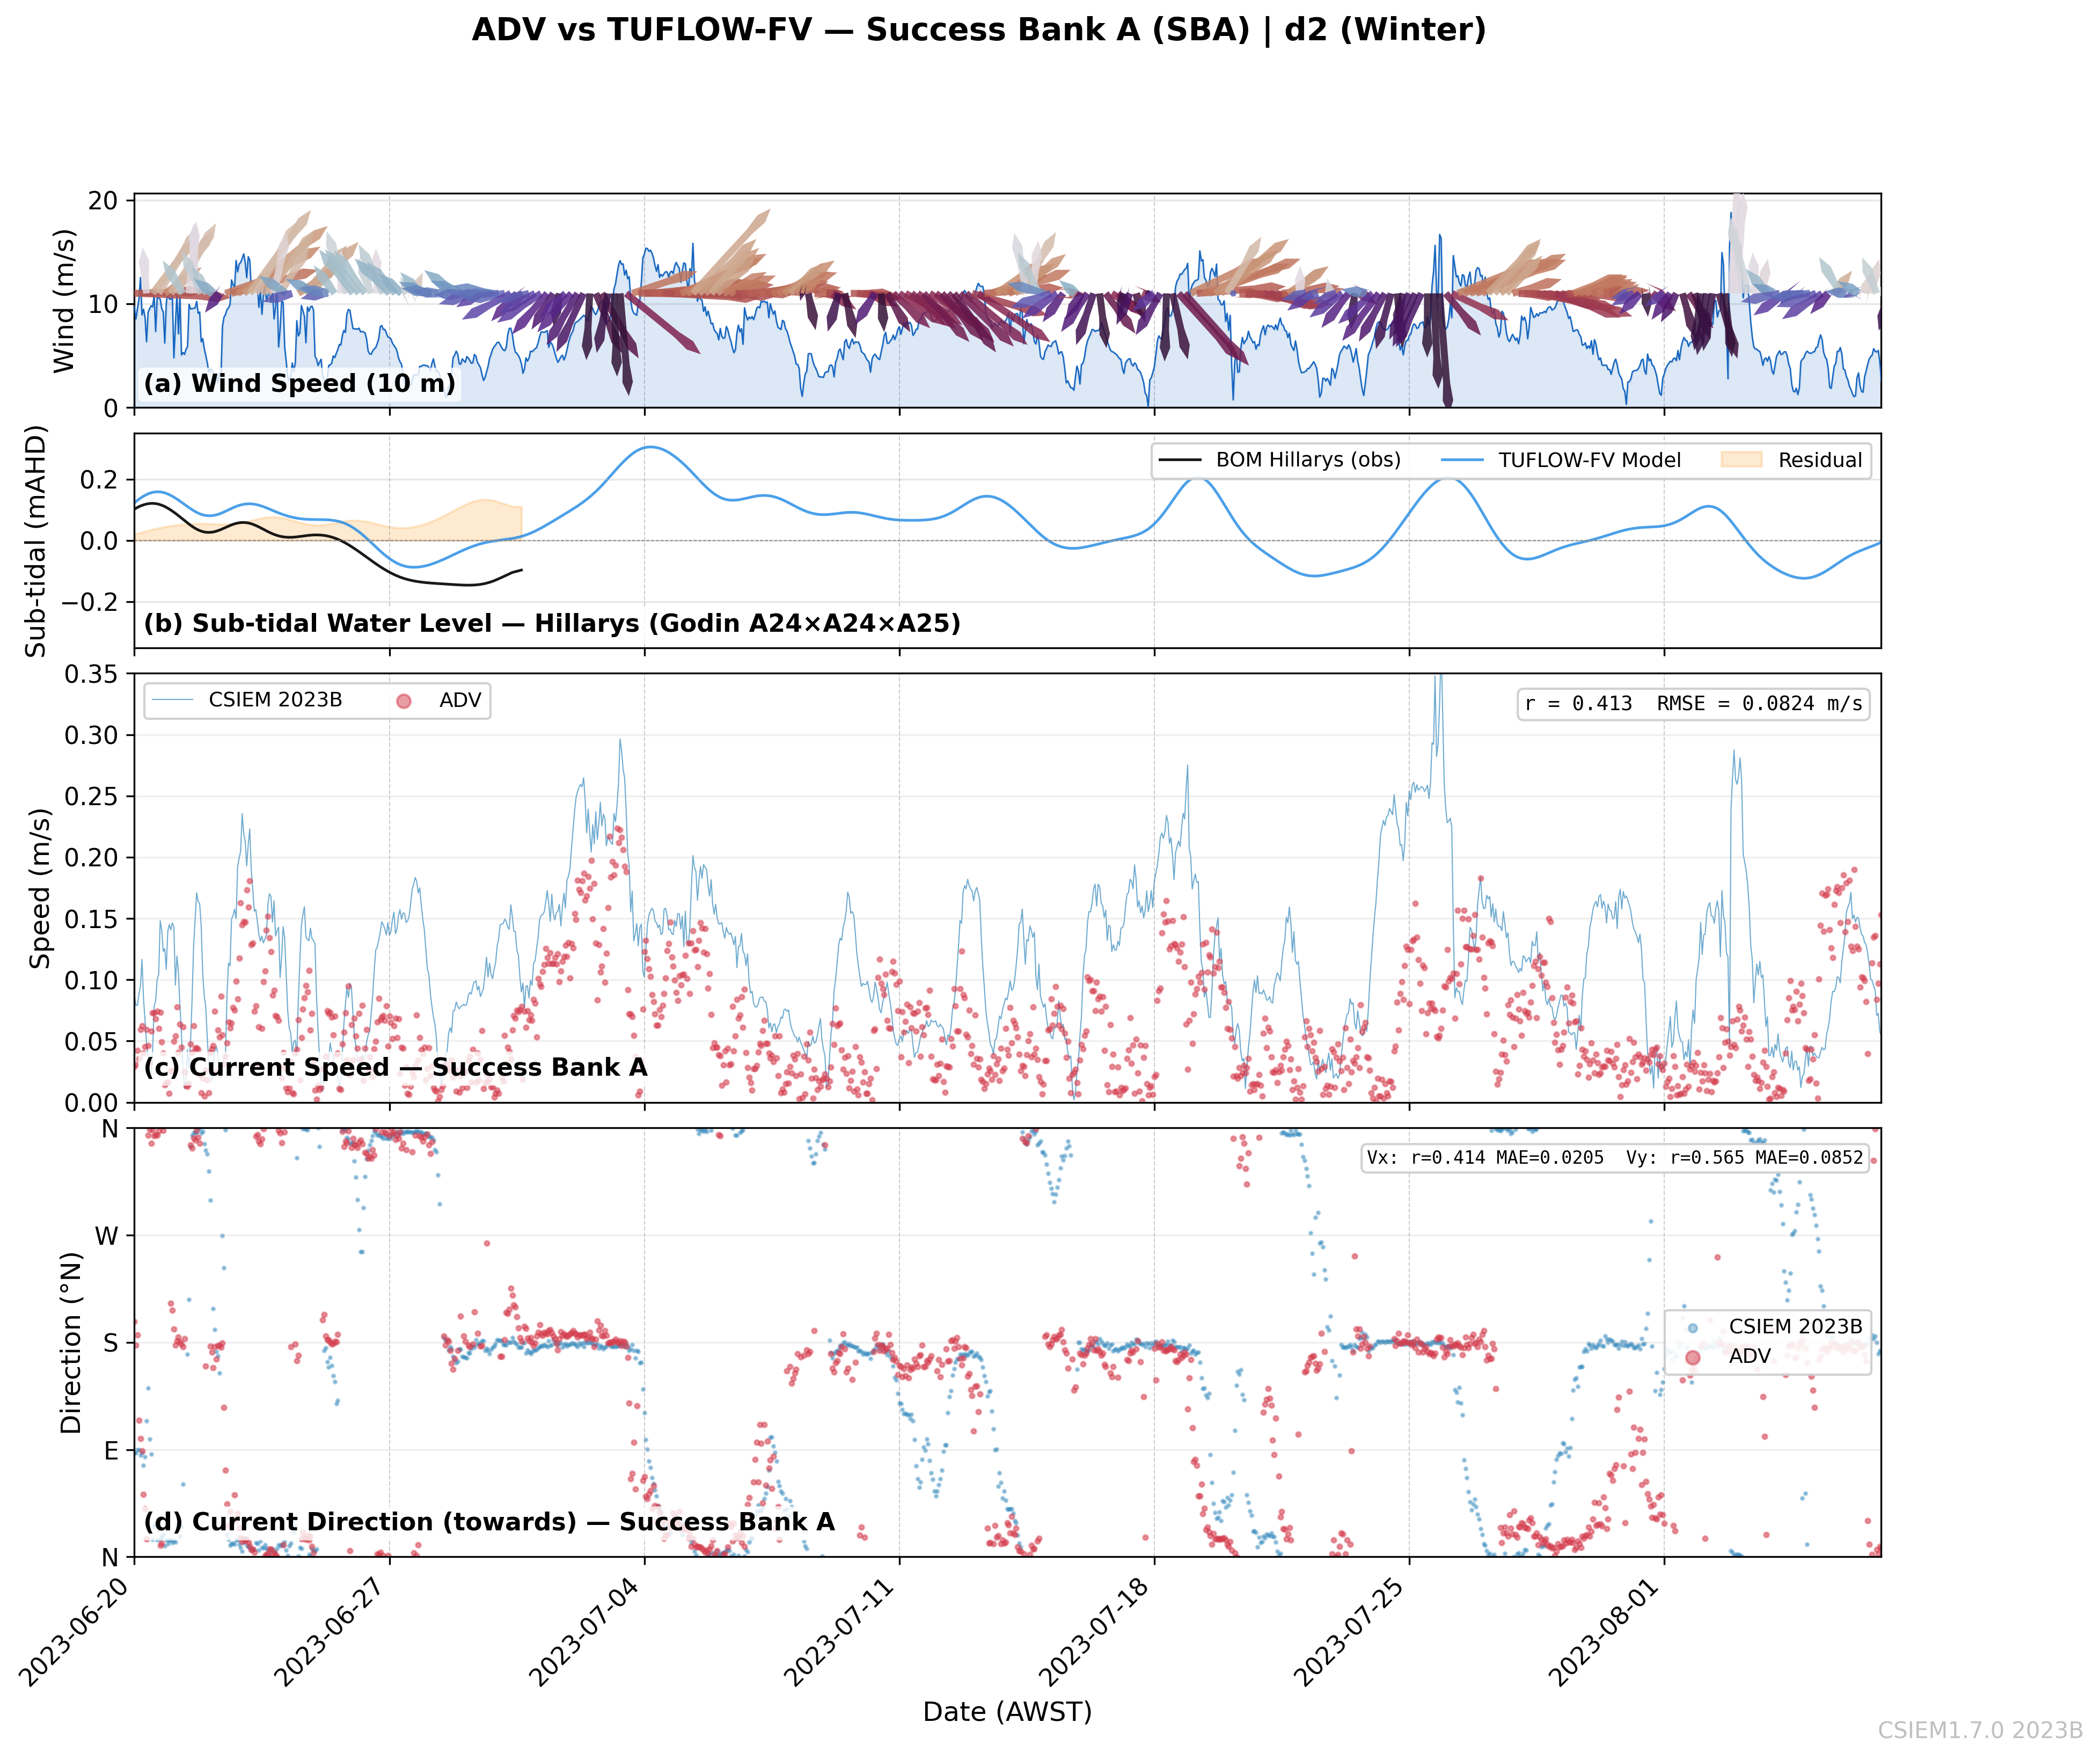
d2
2023-06-20 – 2023-08-08
Winter
PBA, SBA
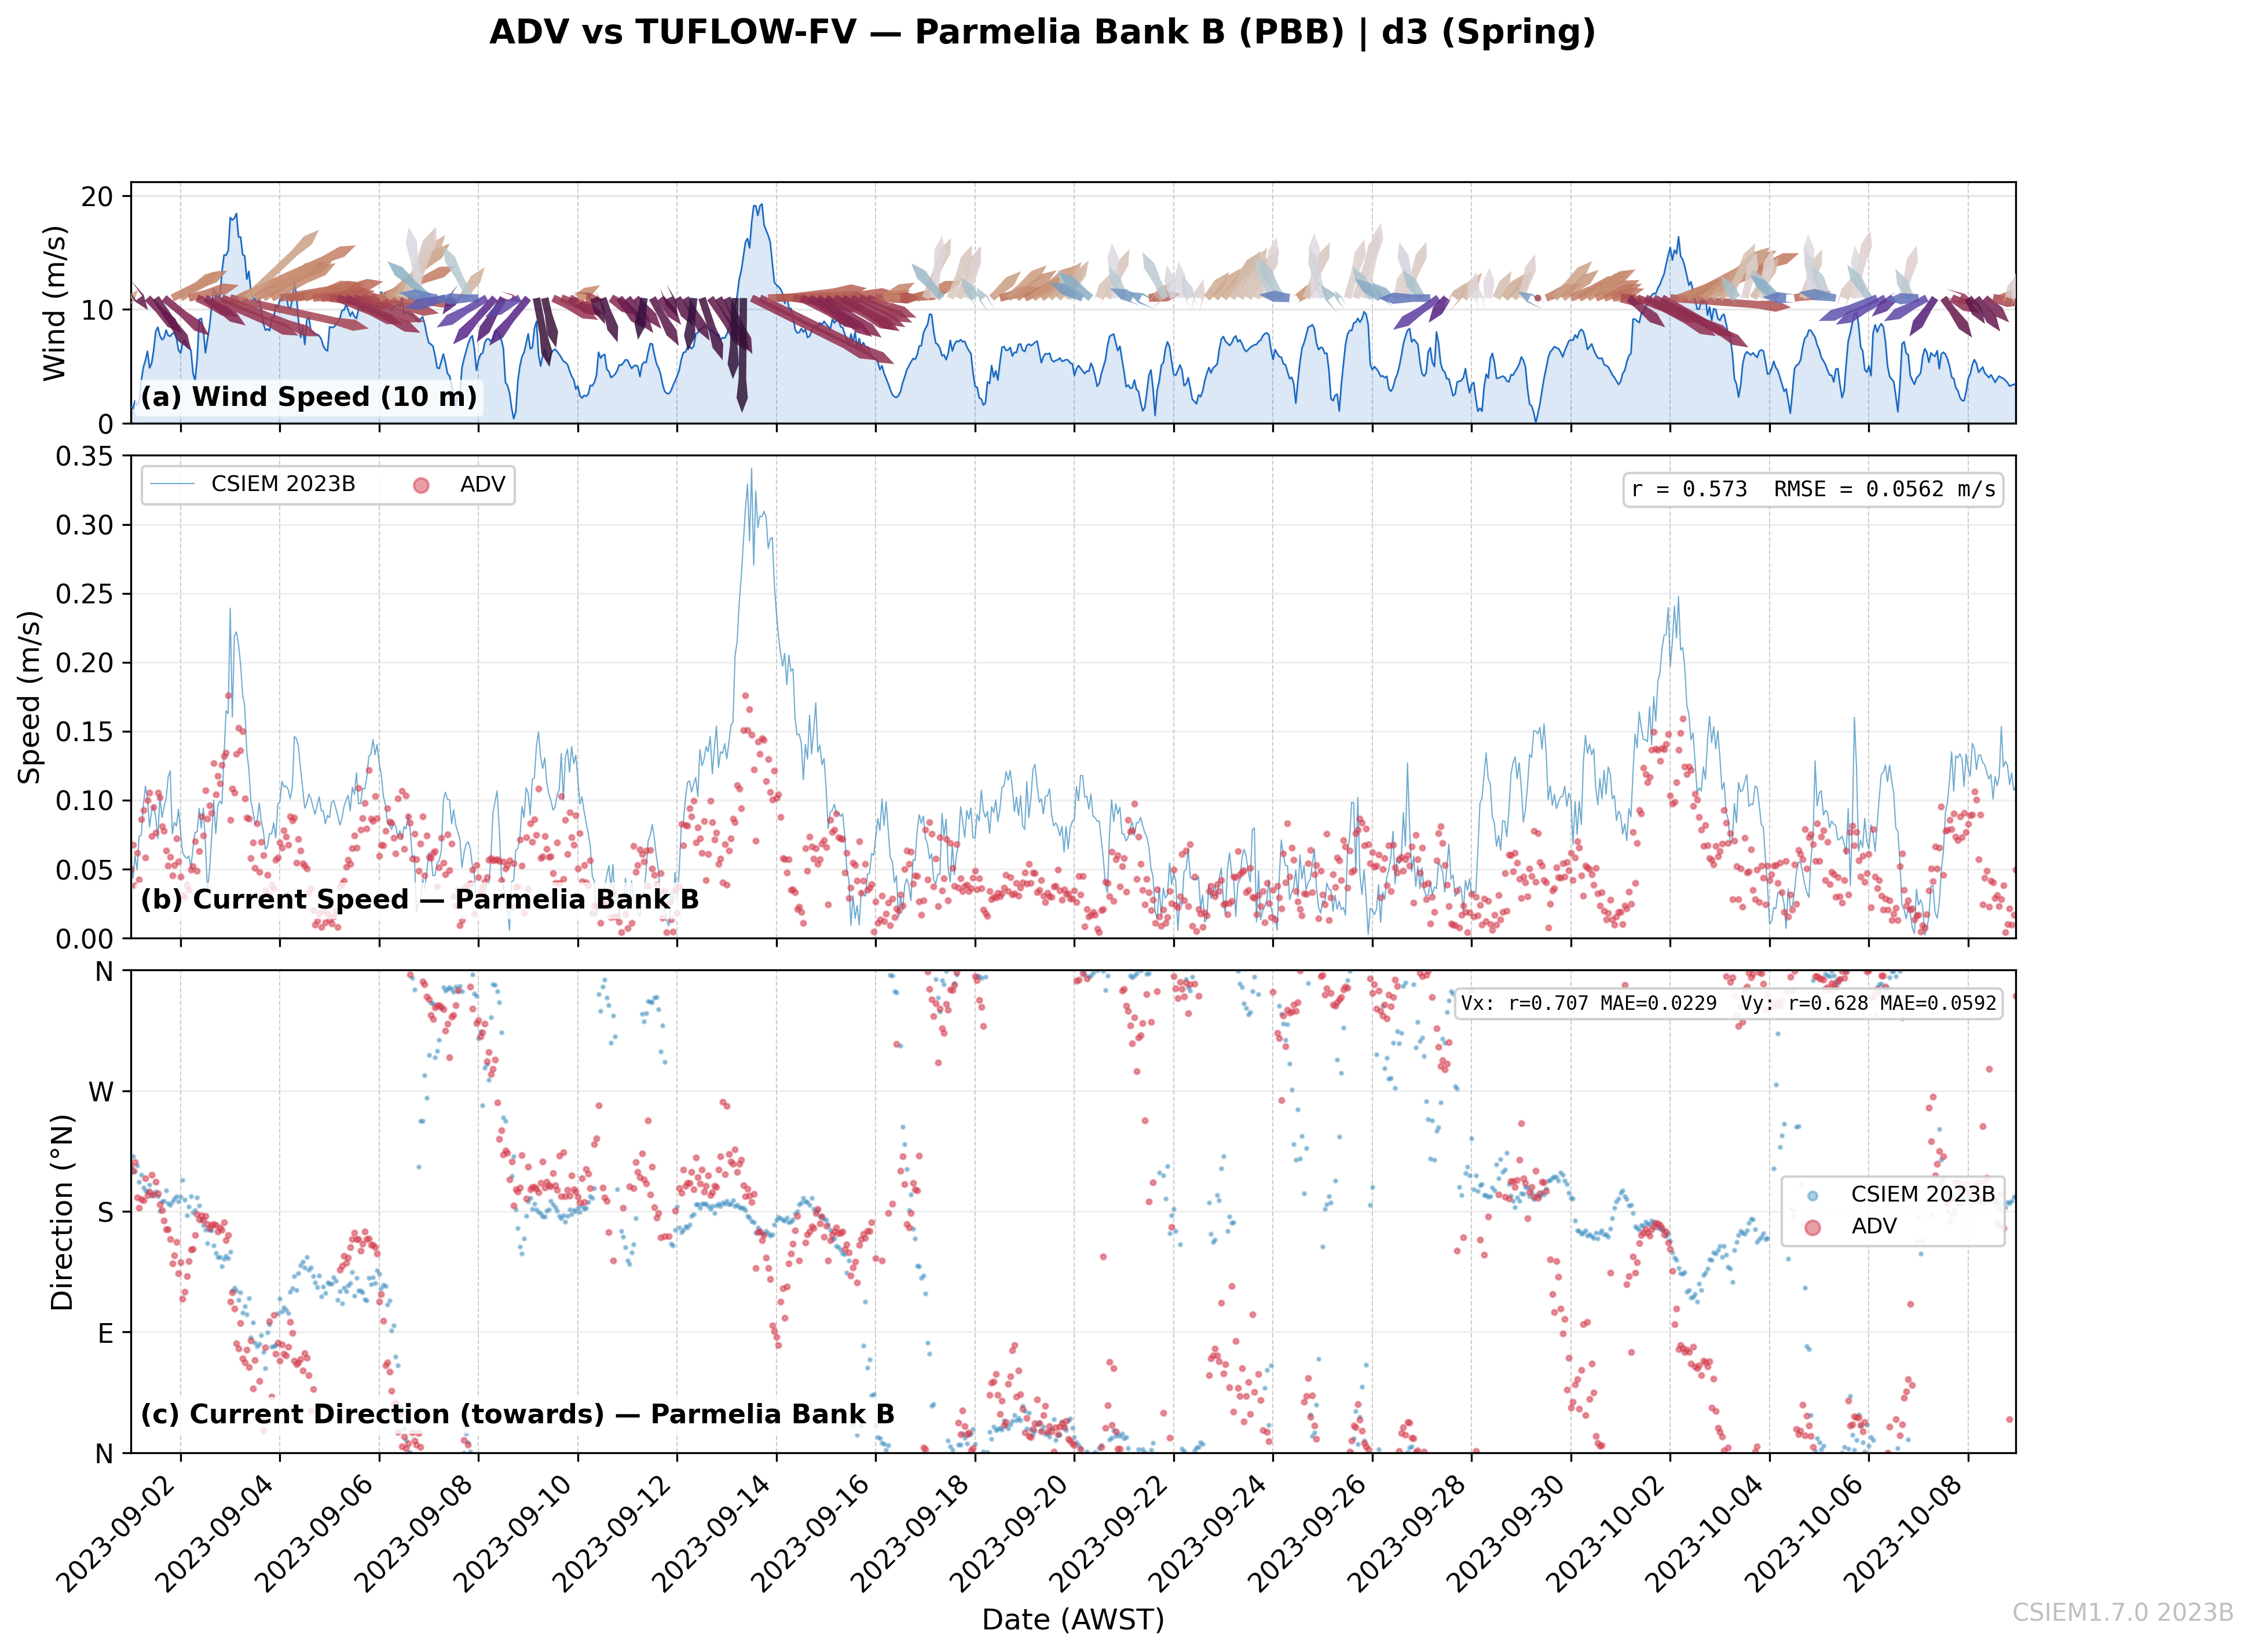
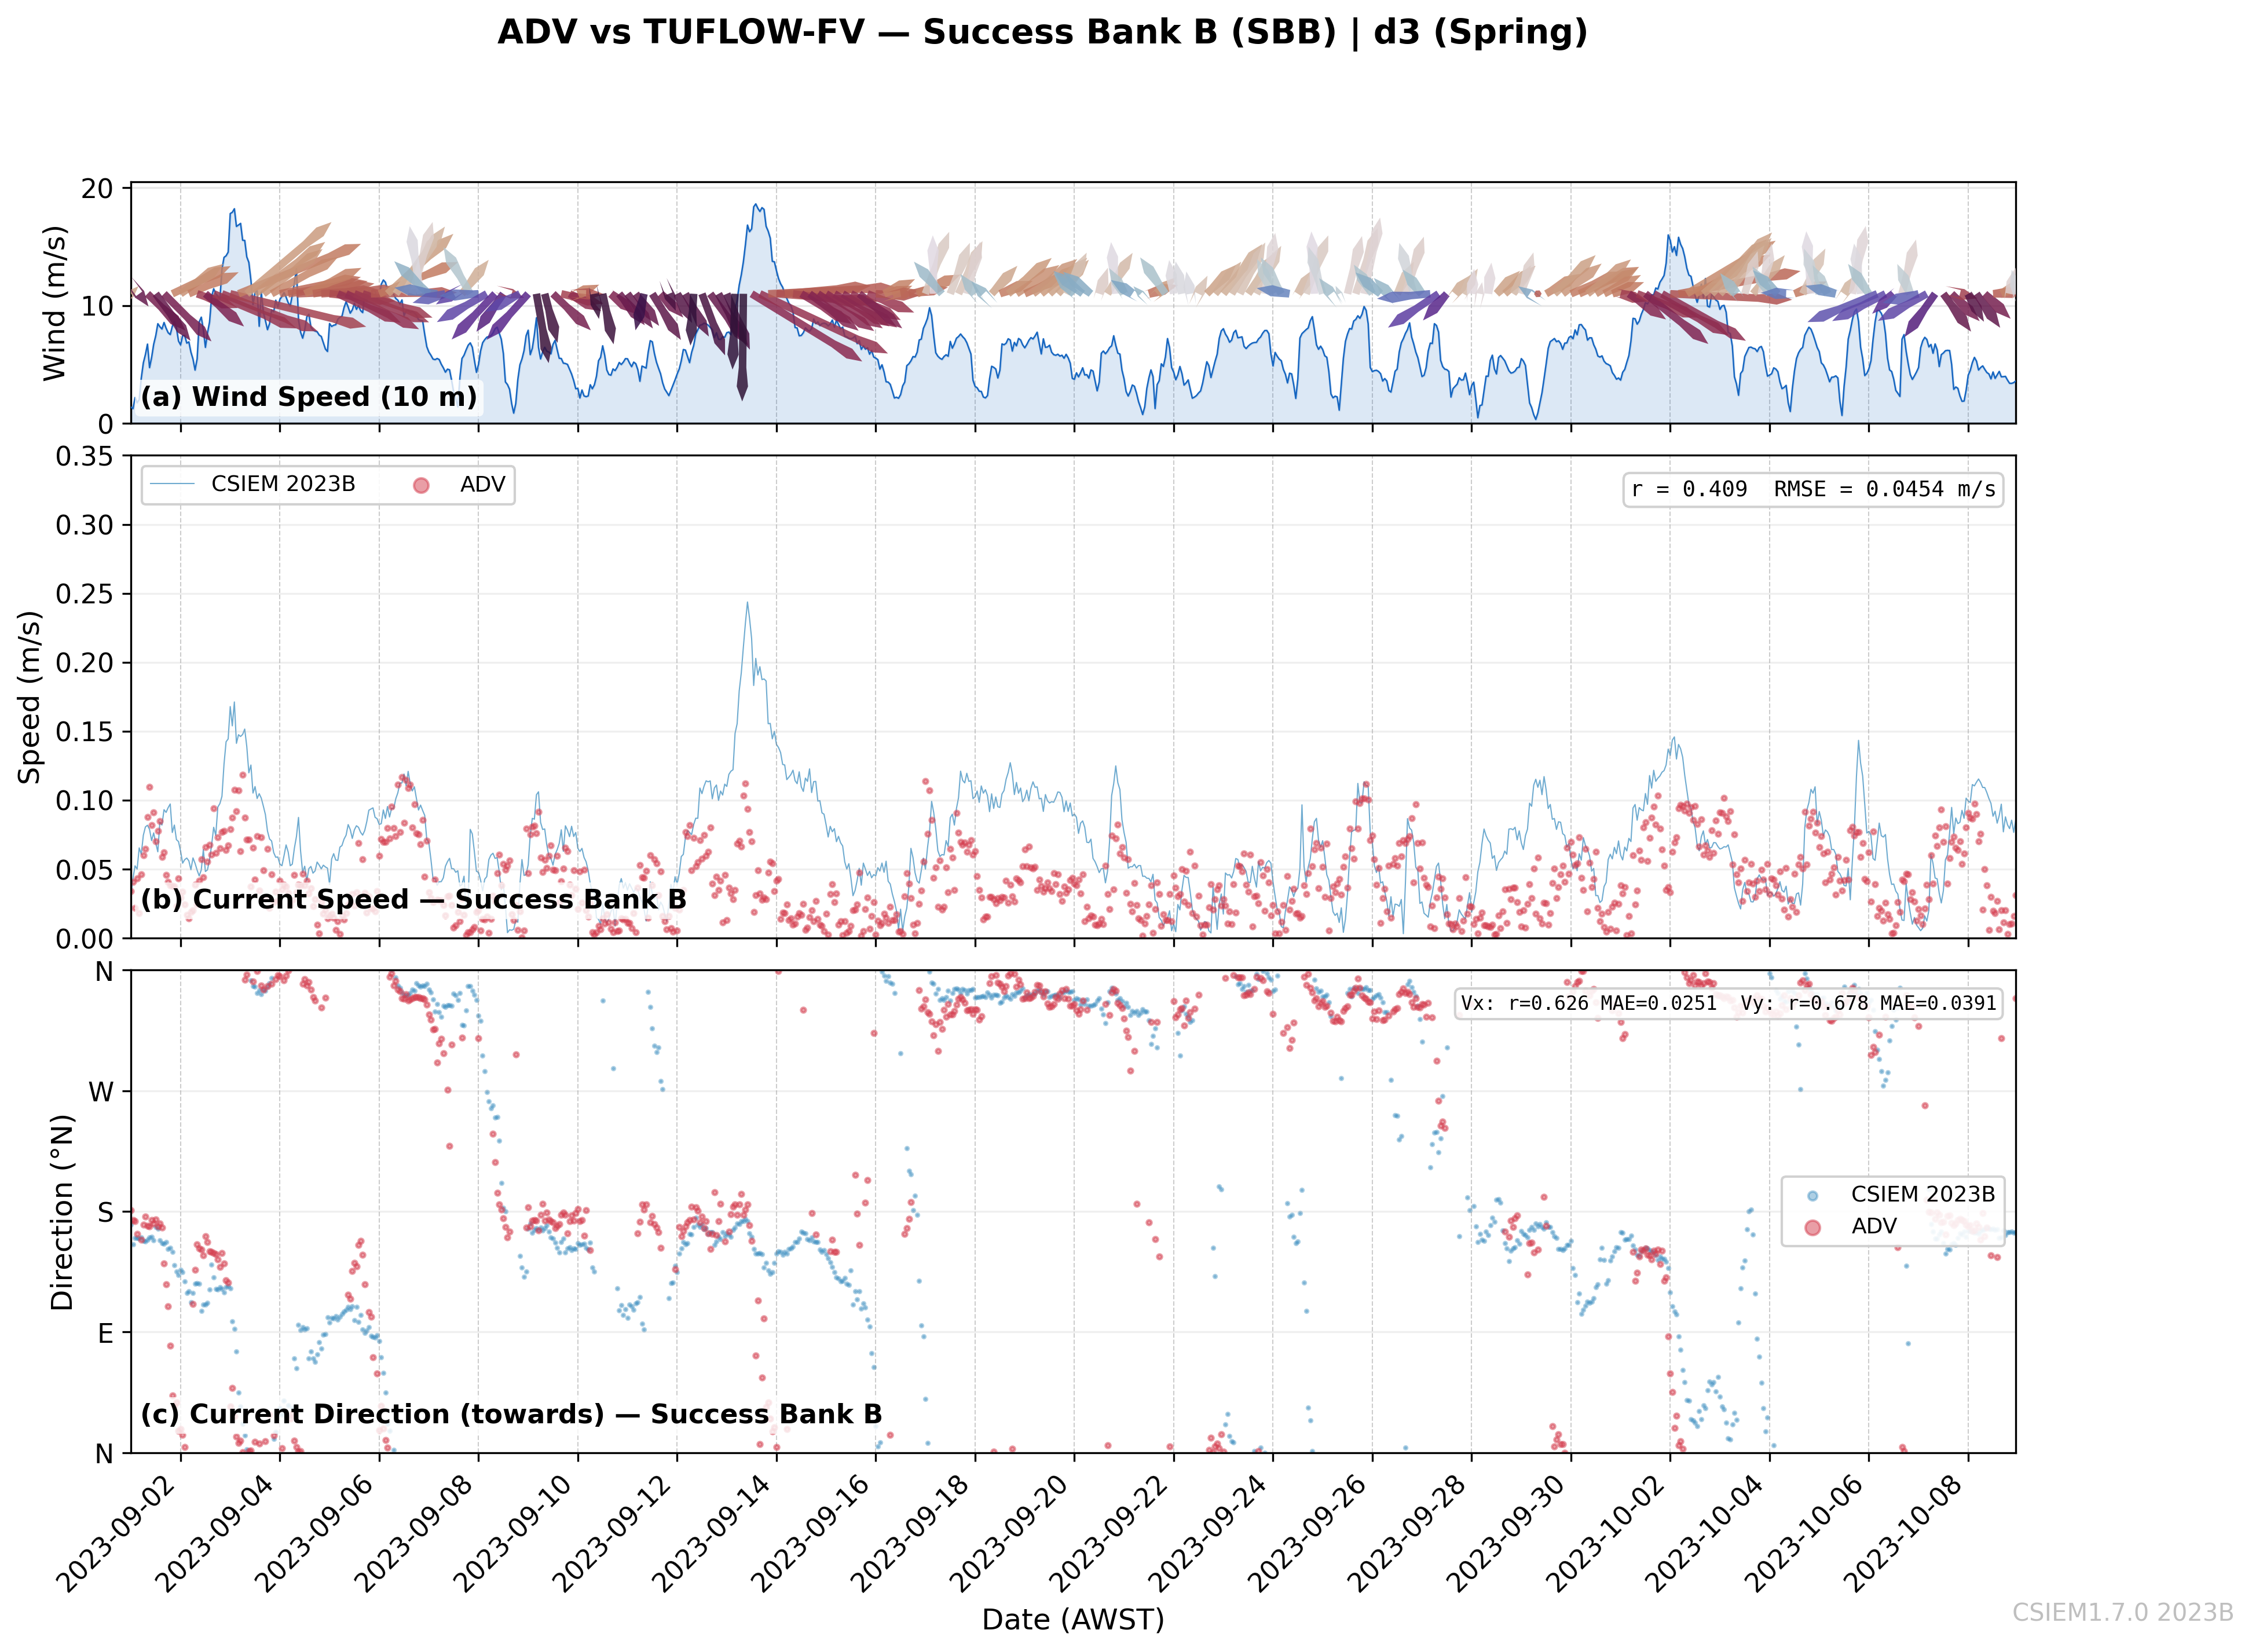
d3
2023-09-01 – 2023-10-09
Spring
PBB, SBB
d4
2024-01-24 – 2024-02-22
Summer
PBB, SBB
d1 (Late Summer)2023-02-18
d2 (Winter)2023-06-20
d3 (Spring)2023-09-01
d4 (Summer)2024-01-24
PBA — Parmelia Bank A
SBA — Success Bank A
PBA — Parmelia Bank A
SBA — Success Bank A
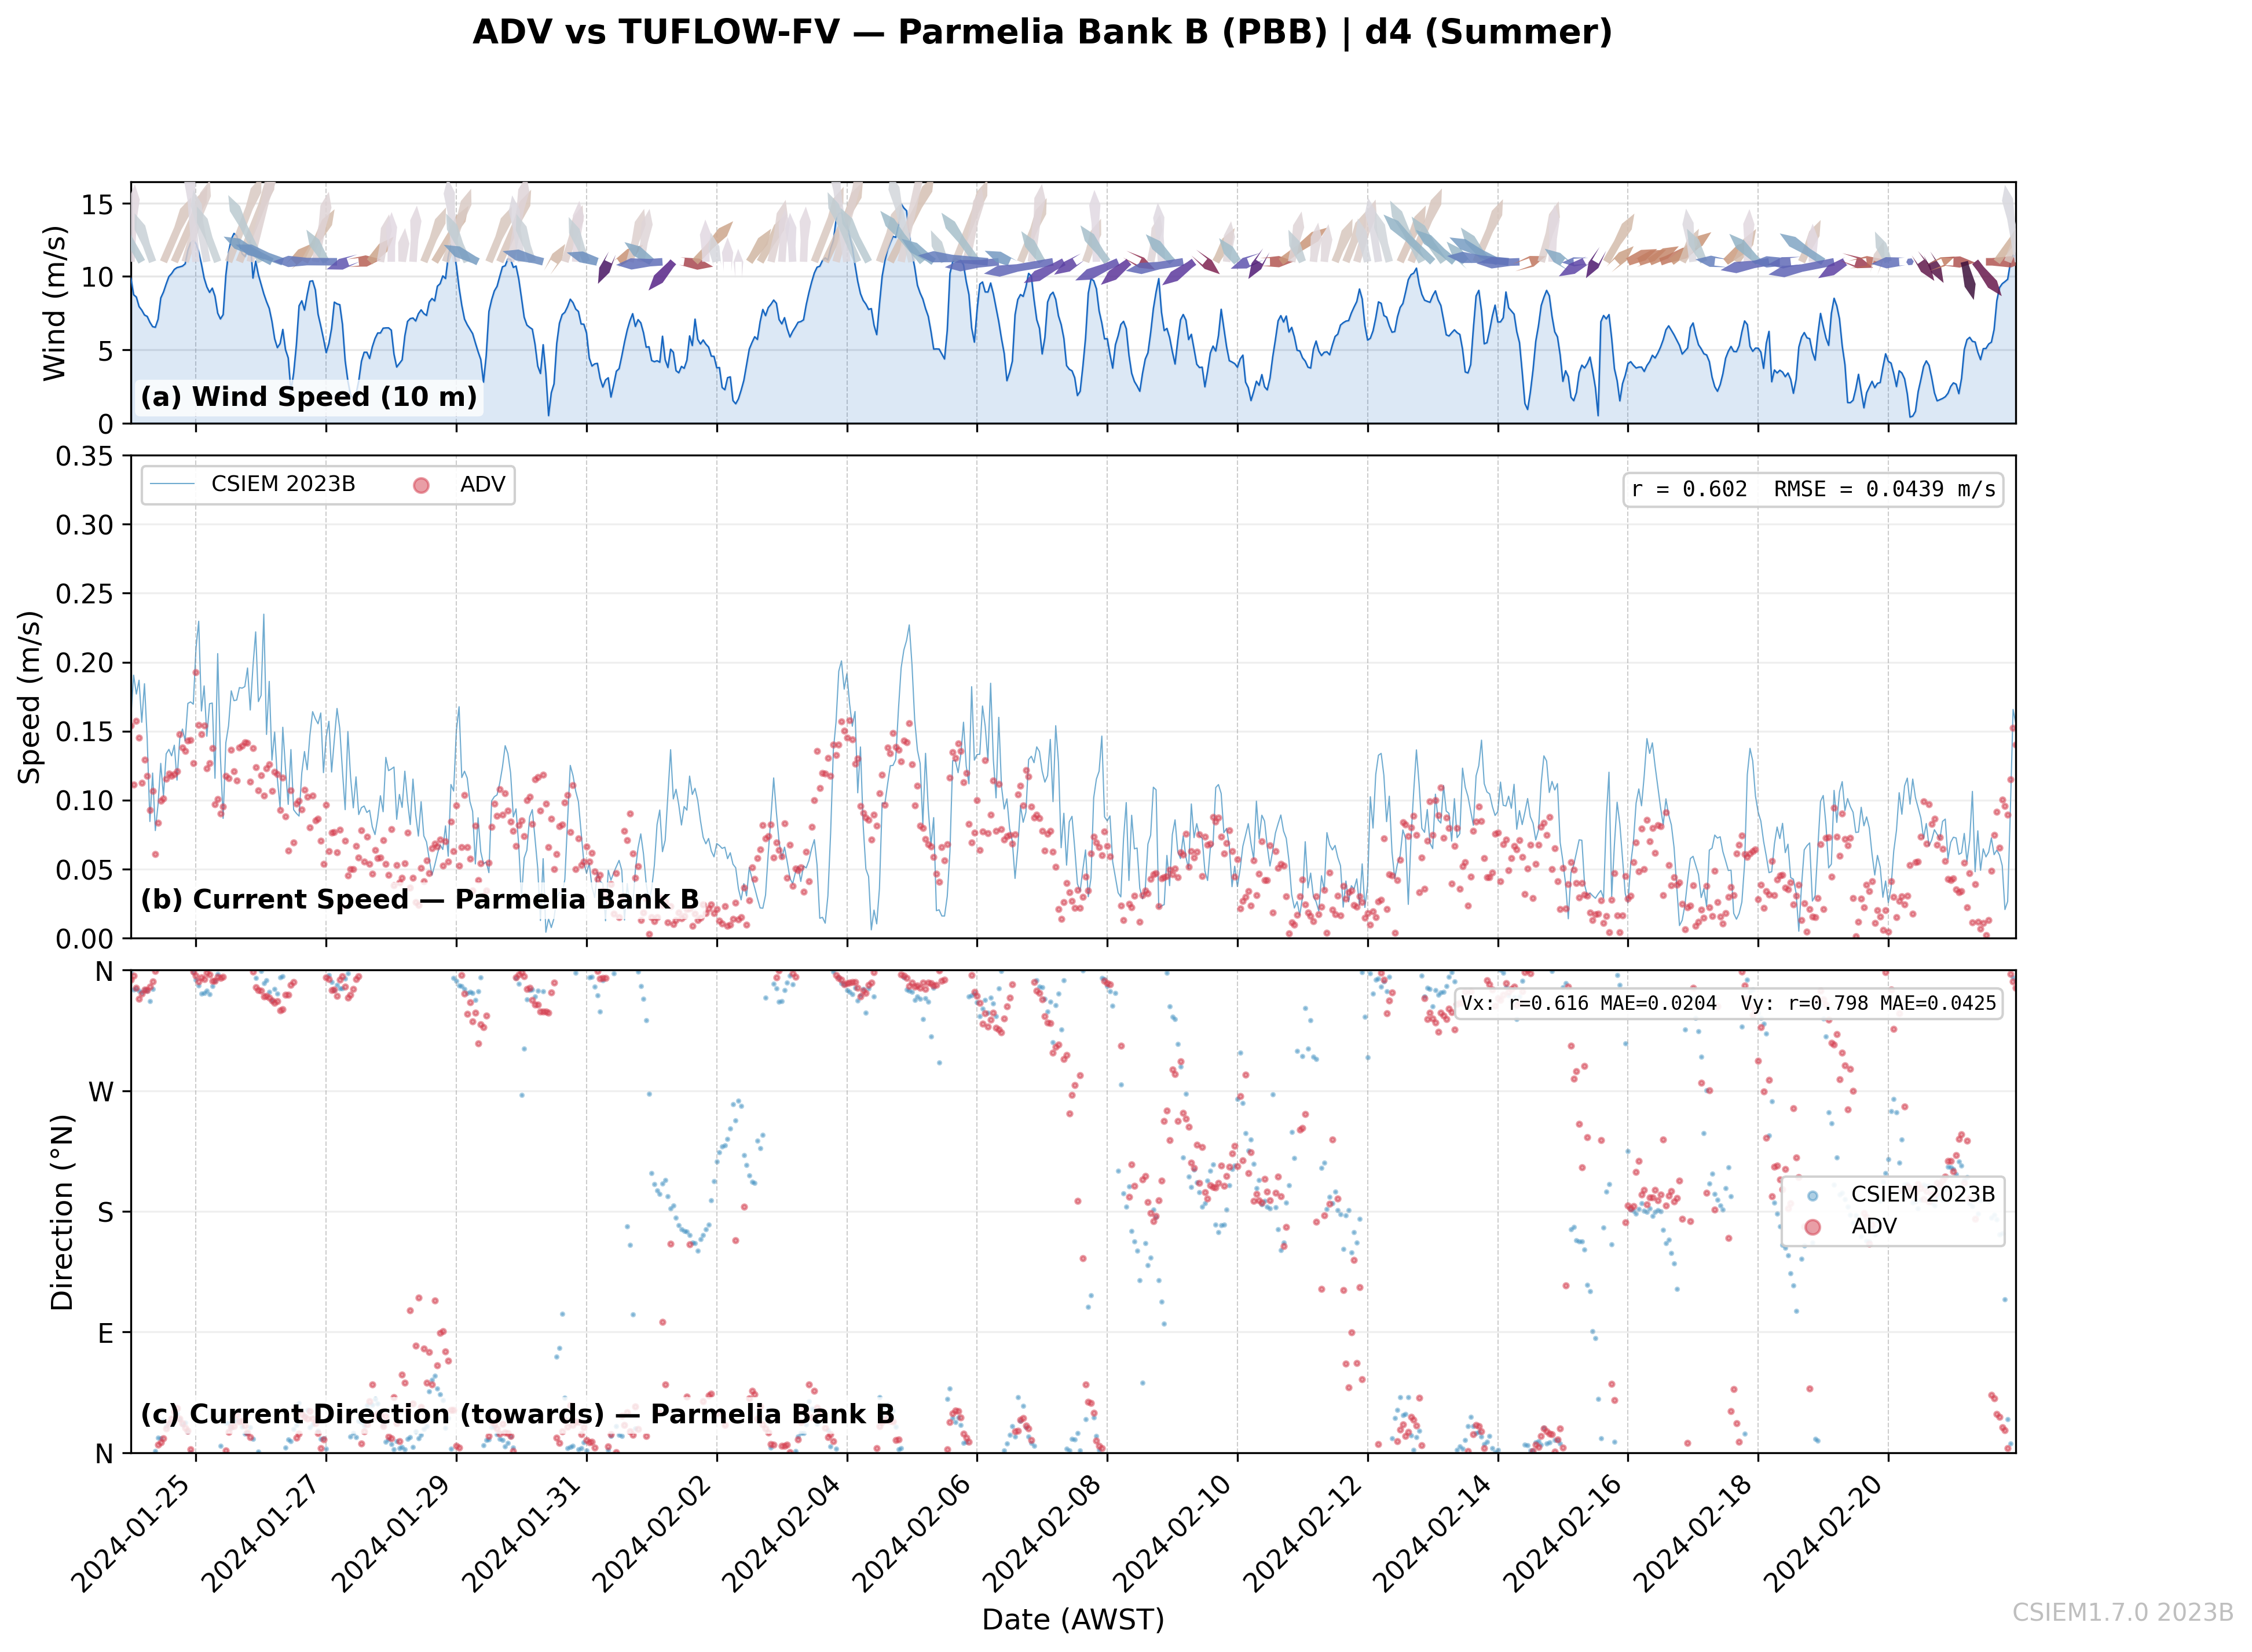
PBB — Parmelia Bank B
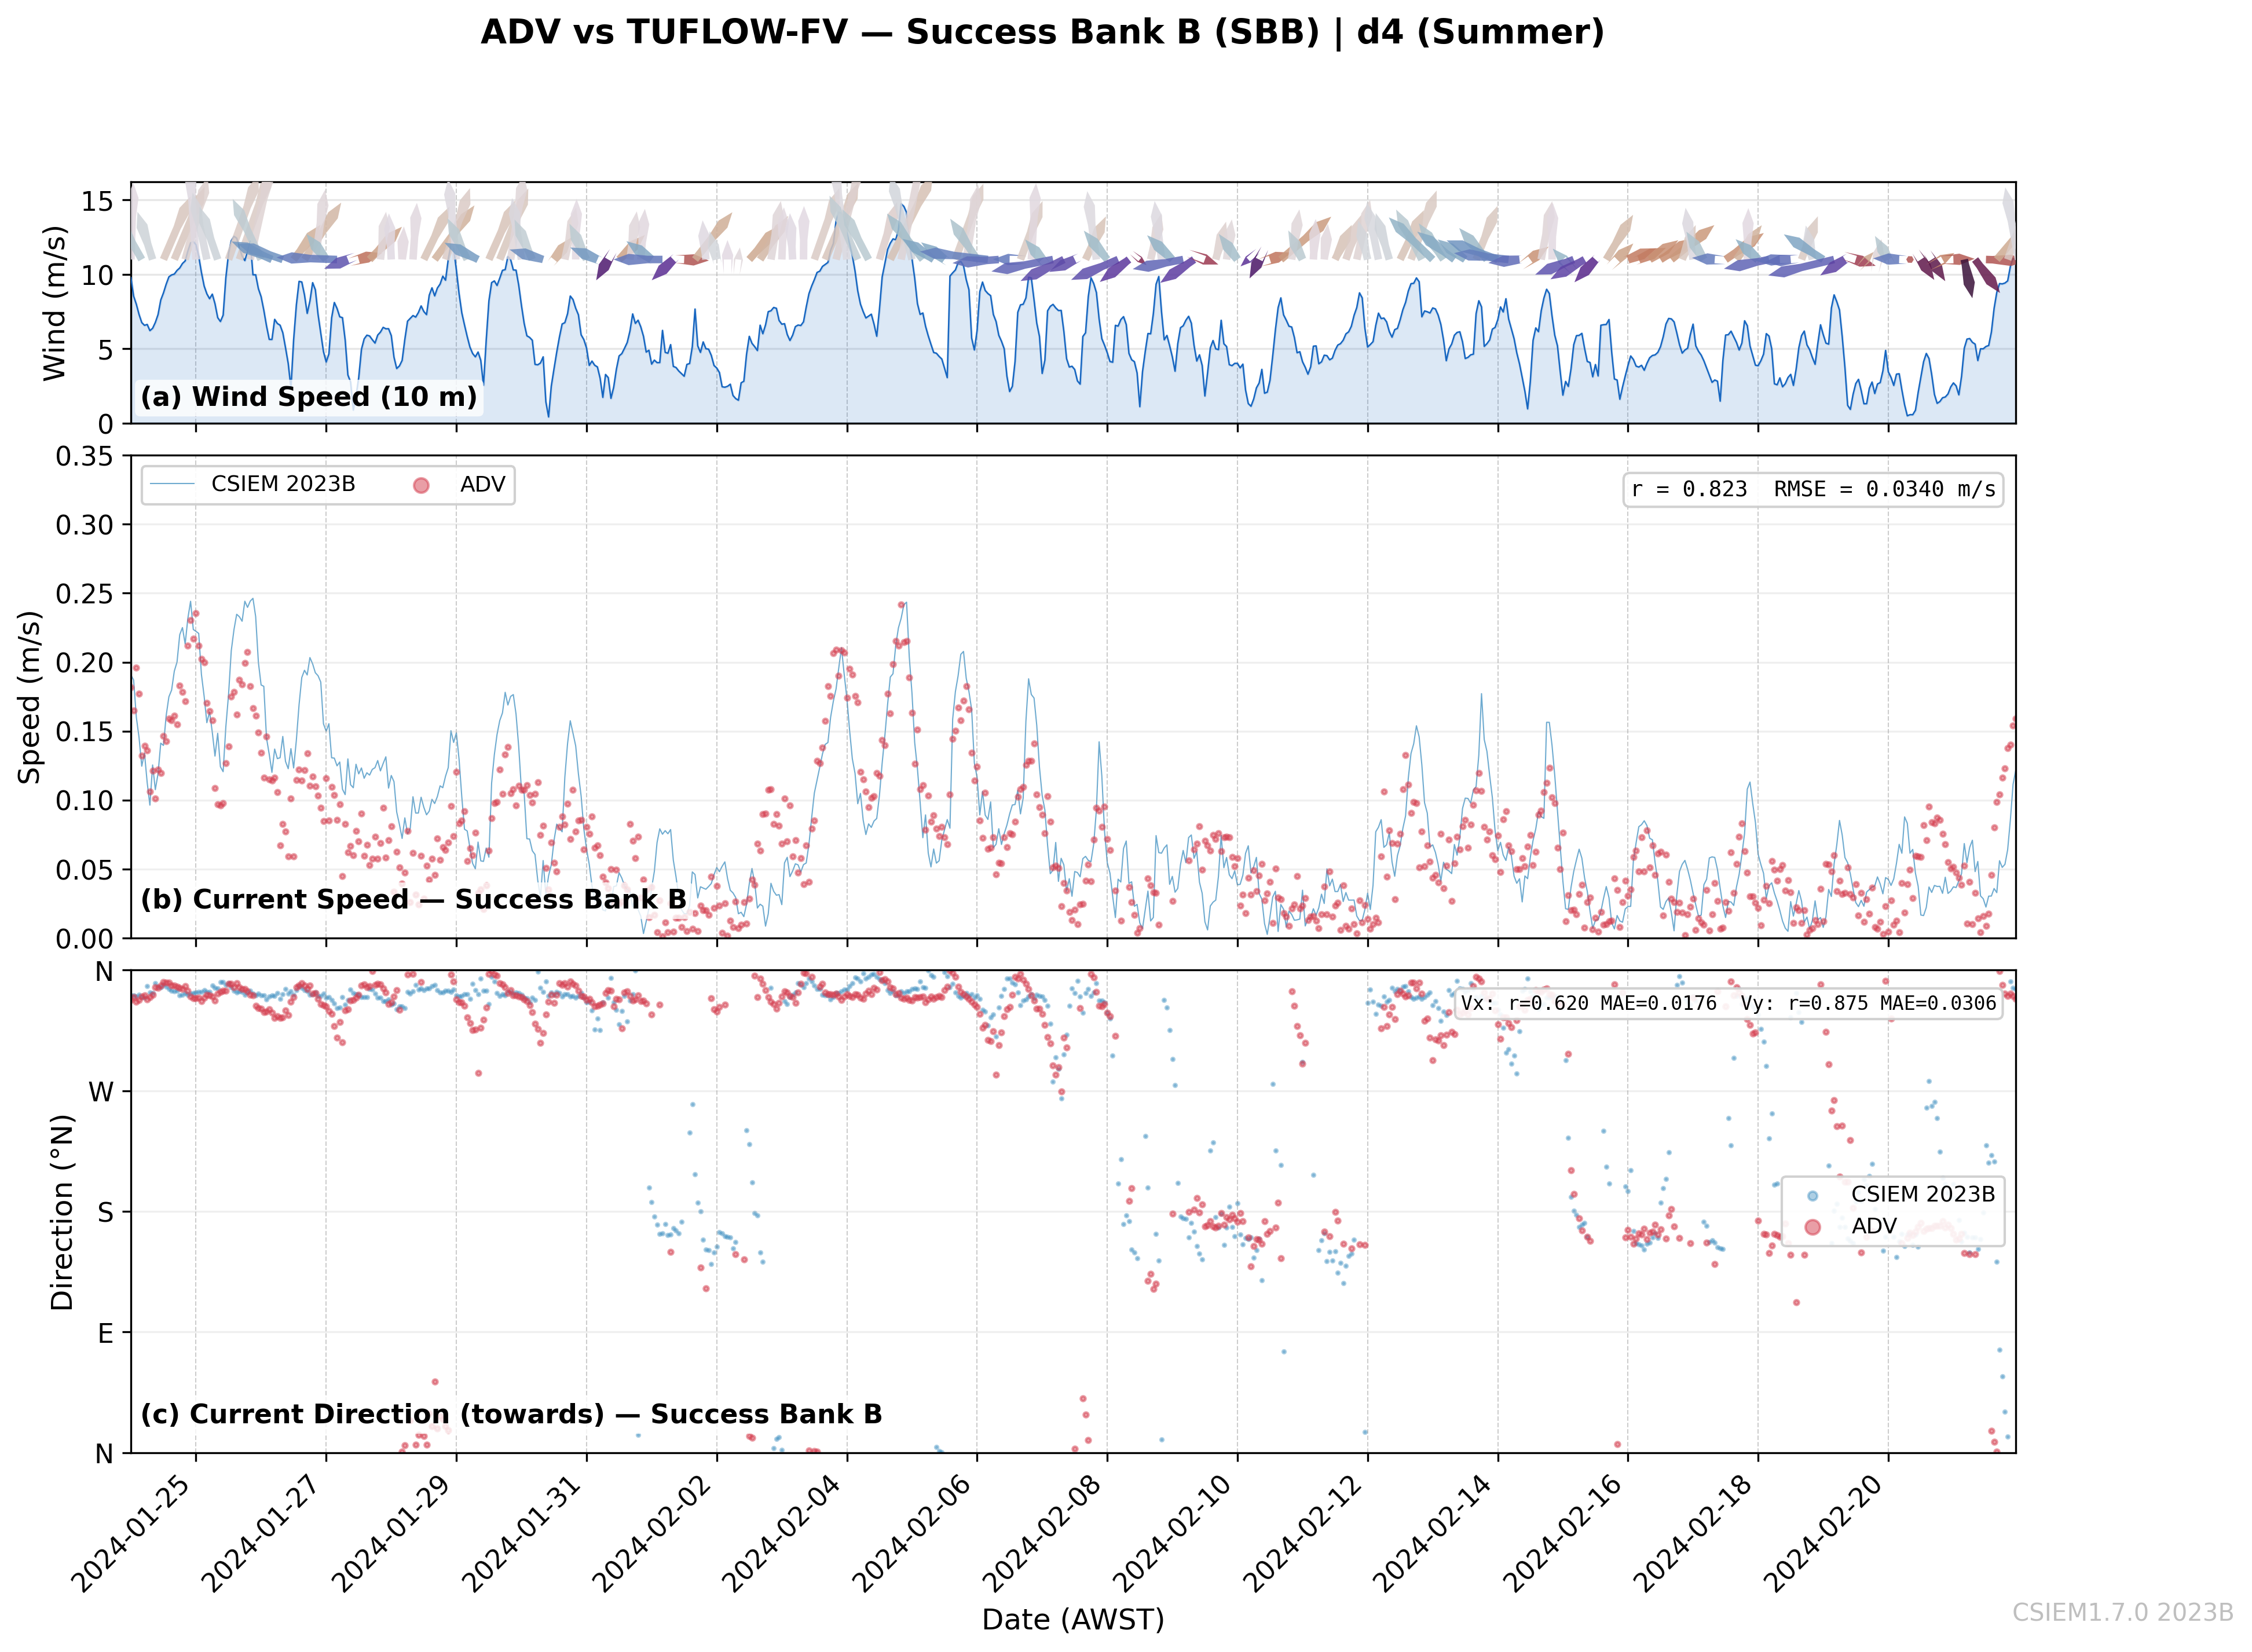
SBB — Success Bank B
PBB — Parmelia Bank B
SBB — Success Bank B
Data Source & Notes
Near-bed current velocity data were collected using Acoustic Doppler Velocimeters (ADVs)
as part of WAMSI Westport Marine Science Program, Project 9.1
(In-situ hydrodynamic and sediment transport measurements; Hansen et al. 2025).
Four ADVs were deployed across Parmelia Bank and Success Bank in Owen Anchorage
during 2023–2024, measuring near-bed current velocities converted to speed and
direction (towards).
4-panel layout — Wind speed & direction, sub-tidal water level (Hillarys, Godin filter), current speed, current direction.
Measurement level — ADV sensors measure at a fixed height above the seabed (~0.15–0.5 m); model comparison uses bottom-layer velocities.
Speed filter — ADV speeds exceeding ±0.4 m/s are excluded; directions masked below 0.02 m/s.
Statistics — Pearson r and RMSE shown for speed; component-wise r and MAE for direction panel.
Sub-tidal panel — Not shown for d3/d4 as BOM Hillarys obs end 1 Jul 2023.