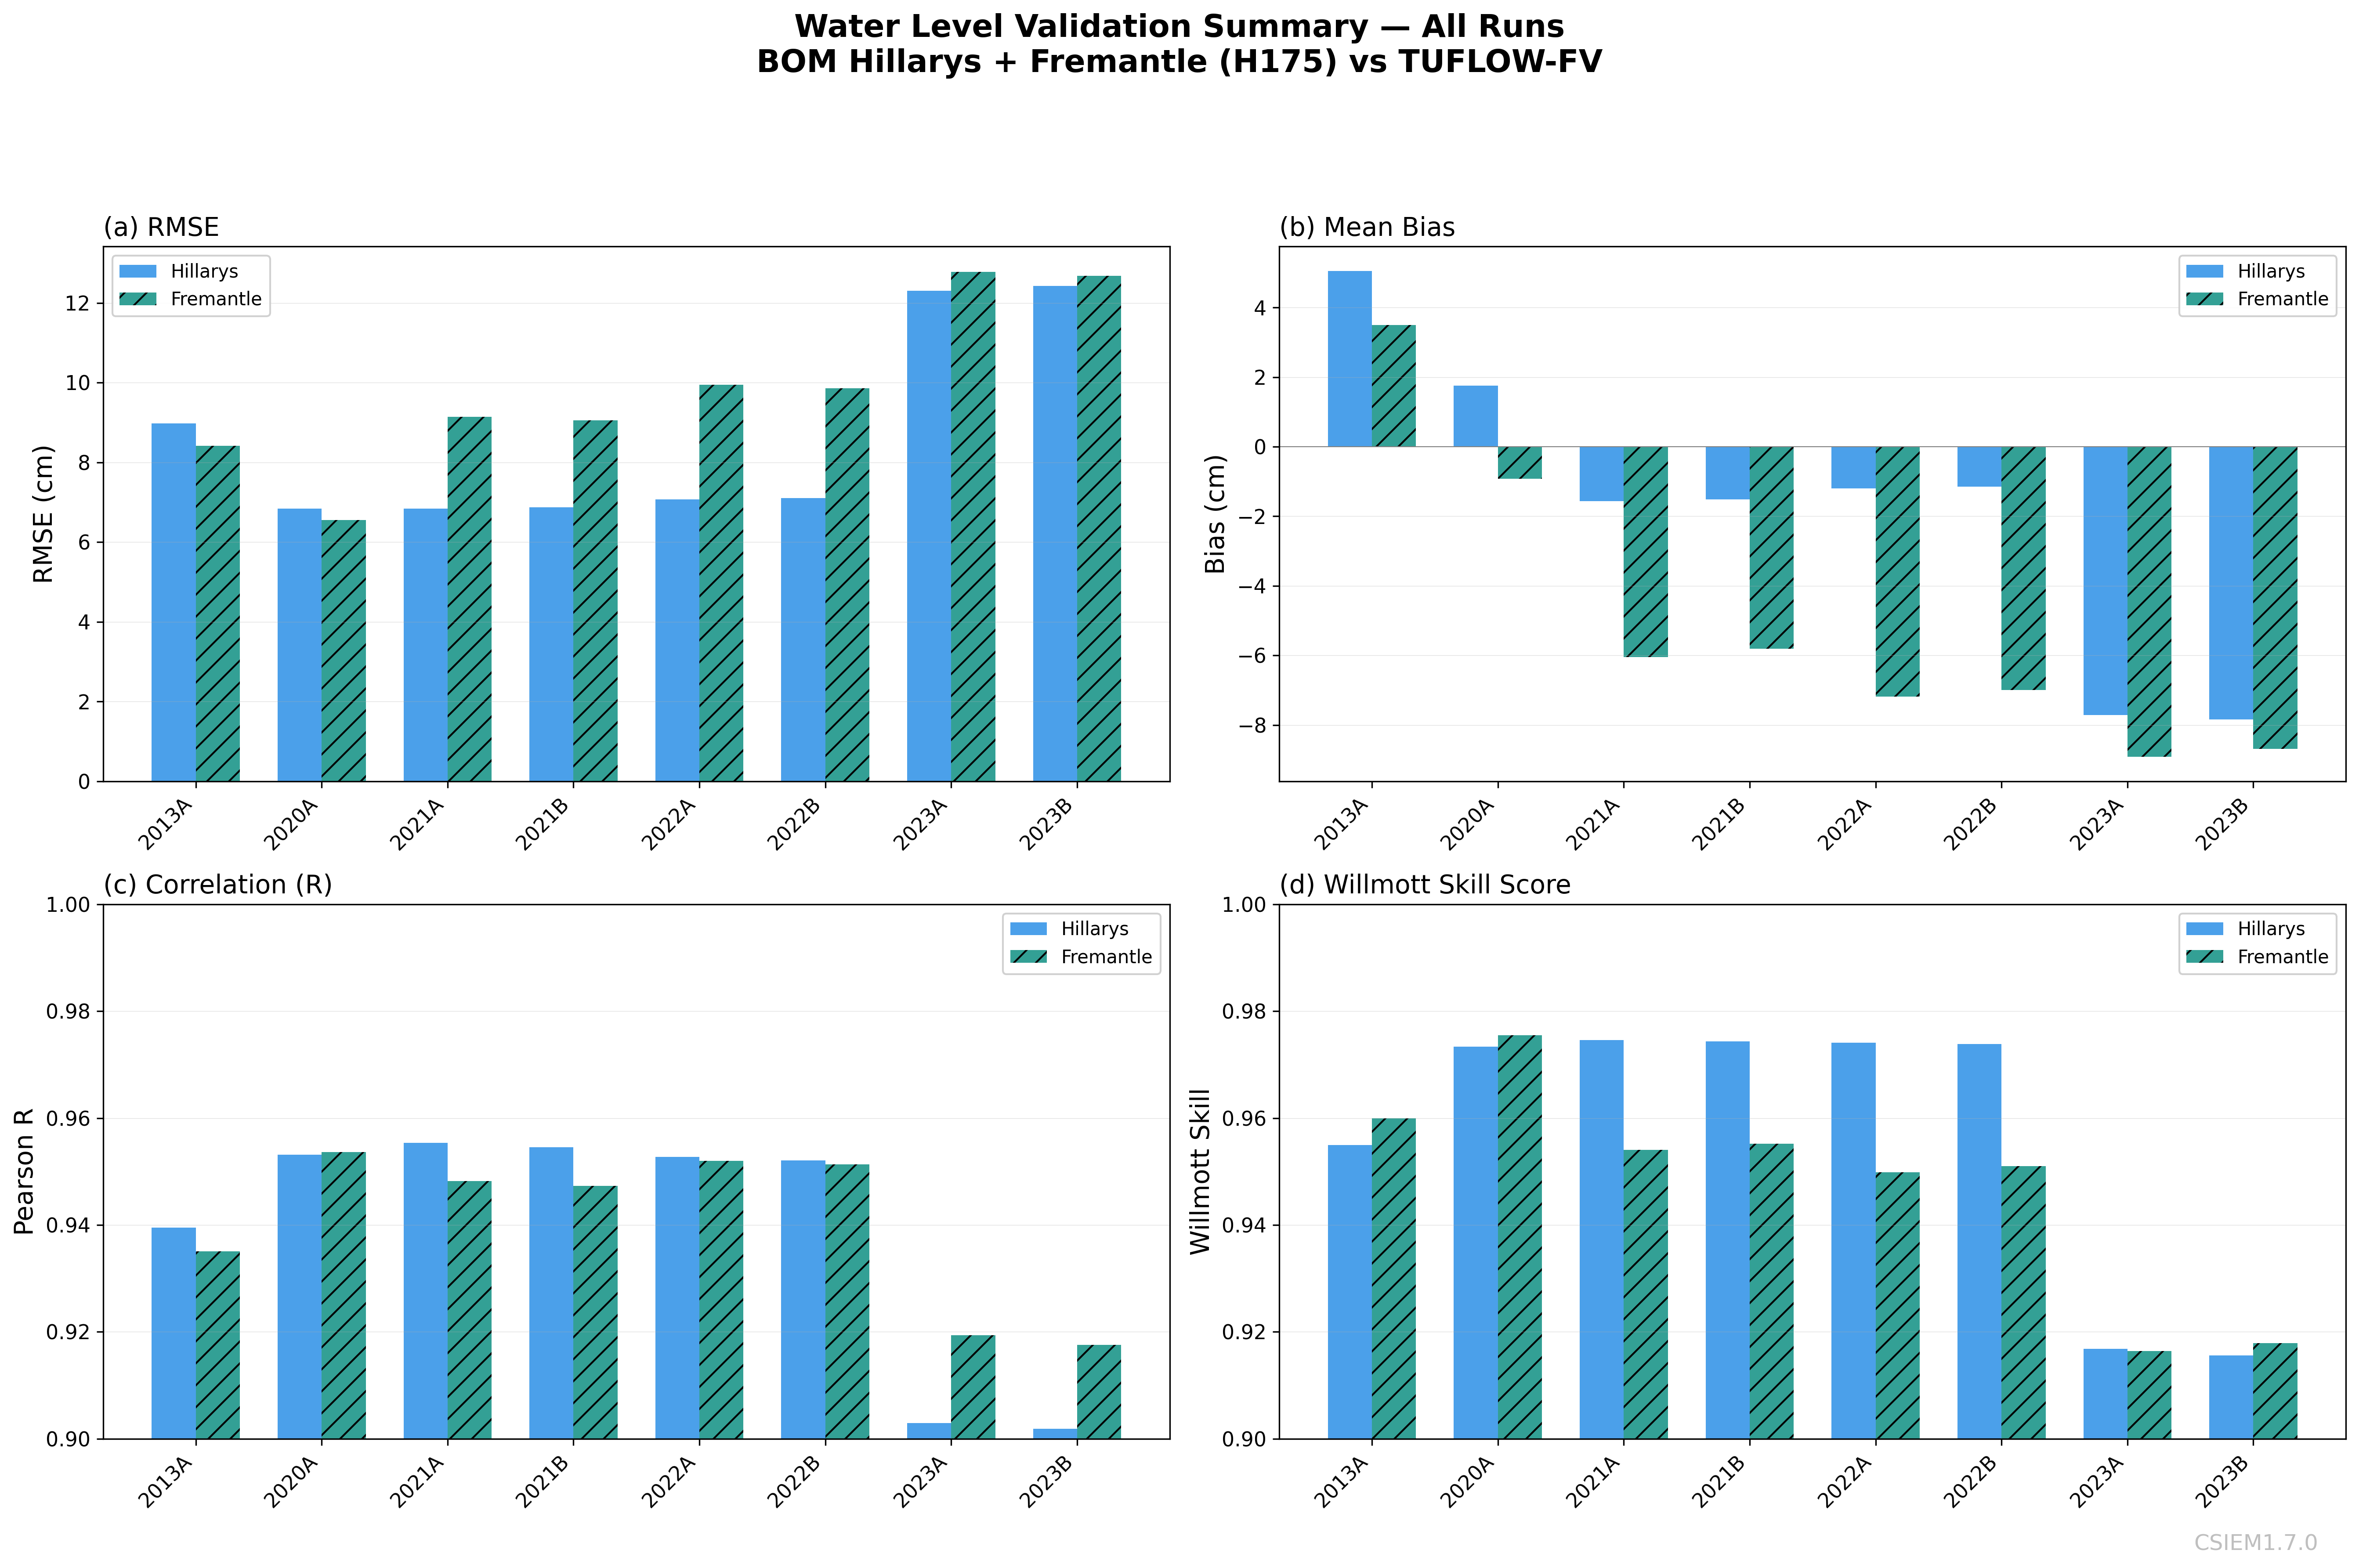
Cross-run comparison: RMSE, Bias, Correlation, and Willmott Skill at both stations
Hillarys — Median RMSE
7.0 cm
R = 0.953 | Skill = 0.974 | 8 runs
Fremantle — Median RMSE
9.1 cm
R = 0.950 | Skill = 0.953 | 8 runs
Overall Willmott Skill
0.96
Median across all runs & stations
Inter-annual Sea-level Variability
Sub-tidal water level at Hillarys and Fremantle after Godin (1972) A24×A24×A25 tidal filtering, annotated with NW Australian tropical cyclone active periods and estimated continental shelf wave (CSW) arrival times. CSW propagation speed ~500 km/day along the WA coast.
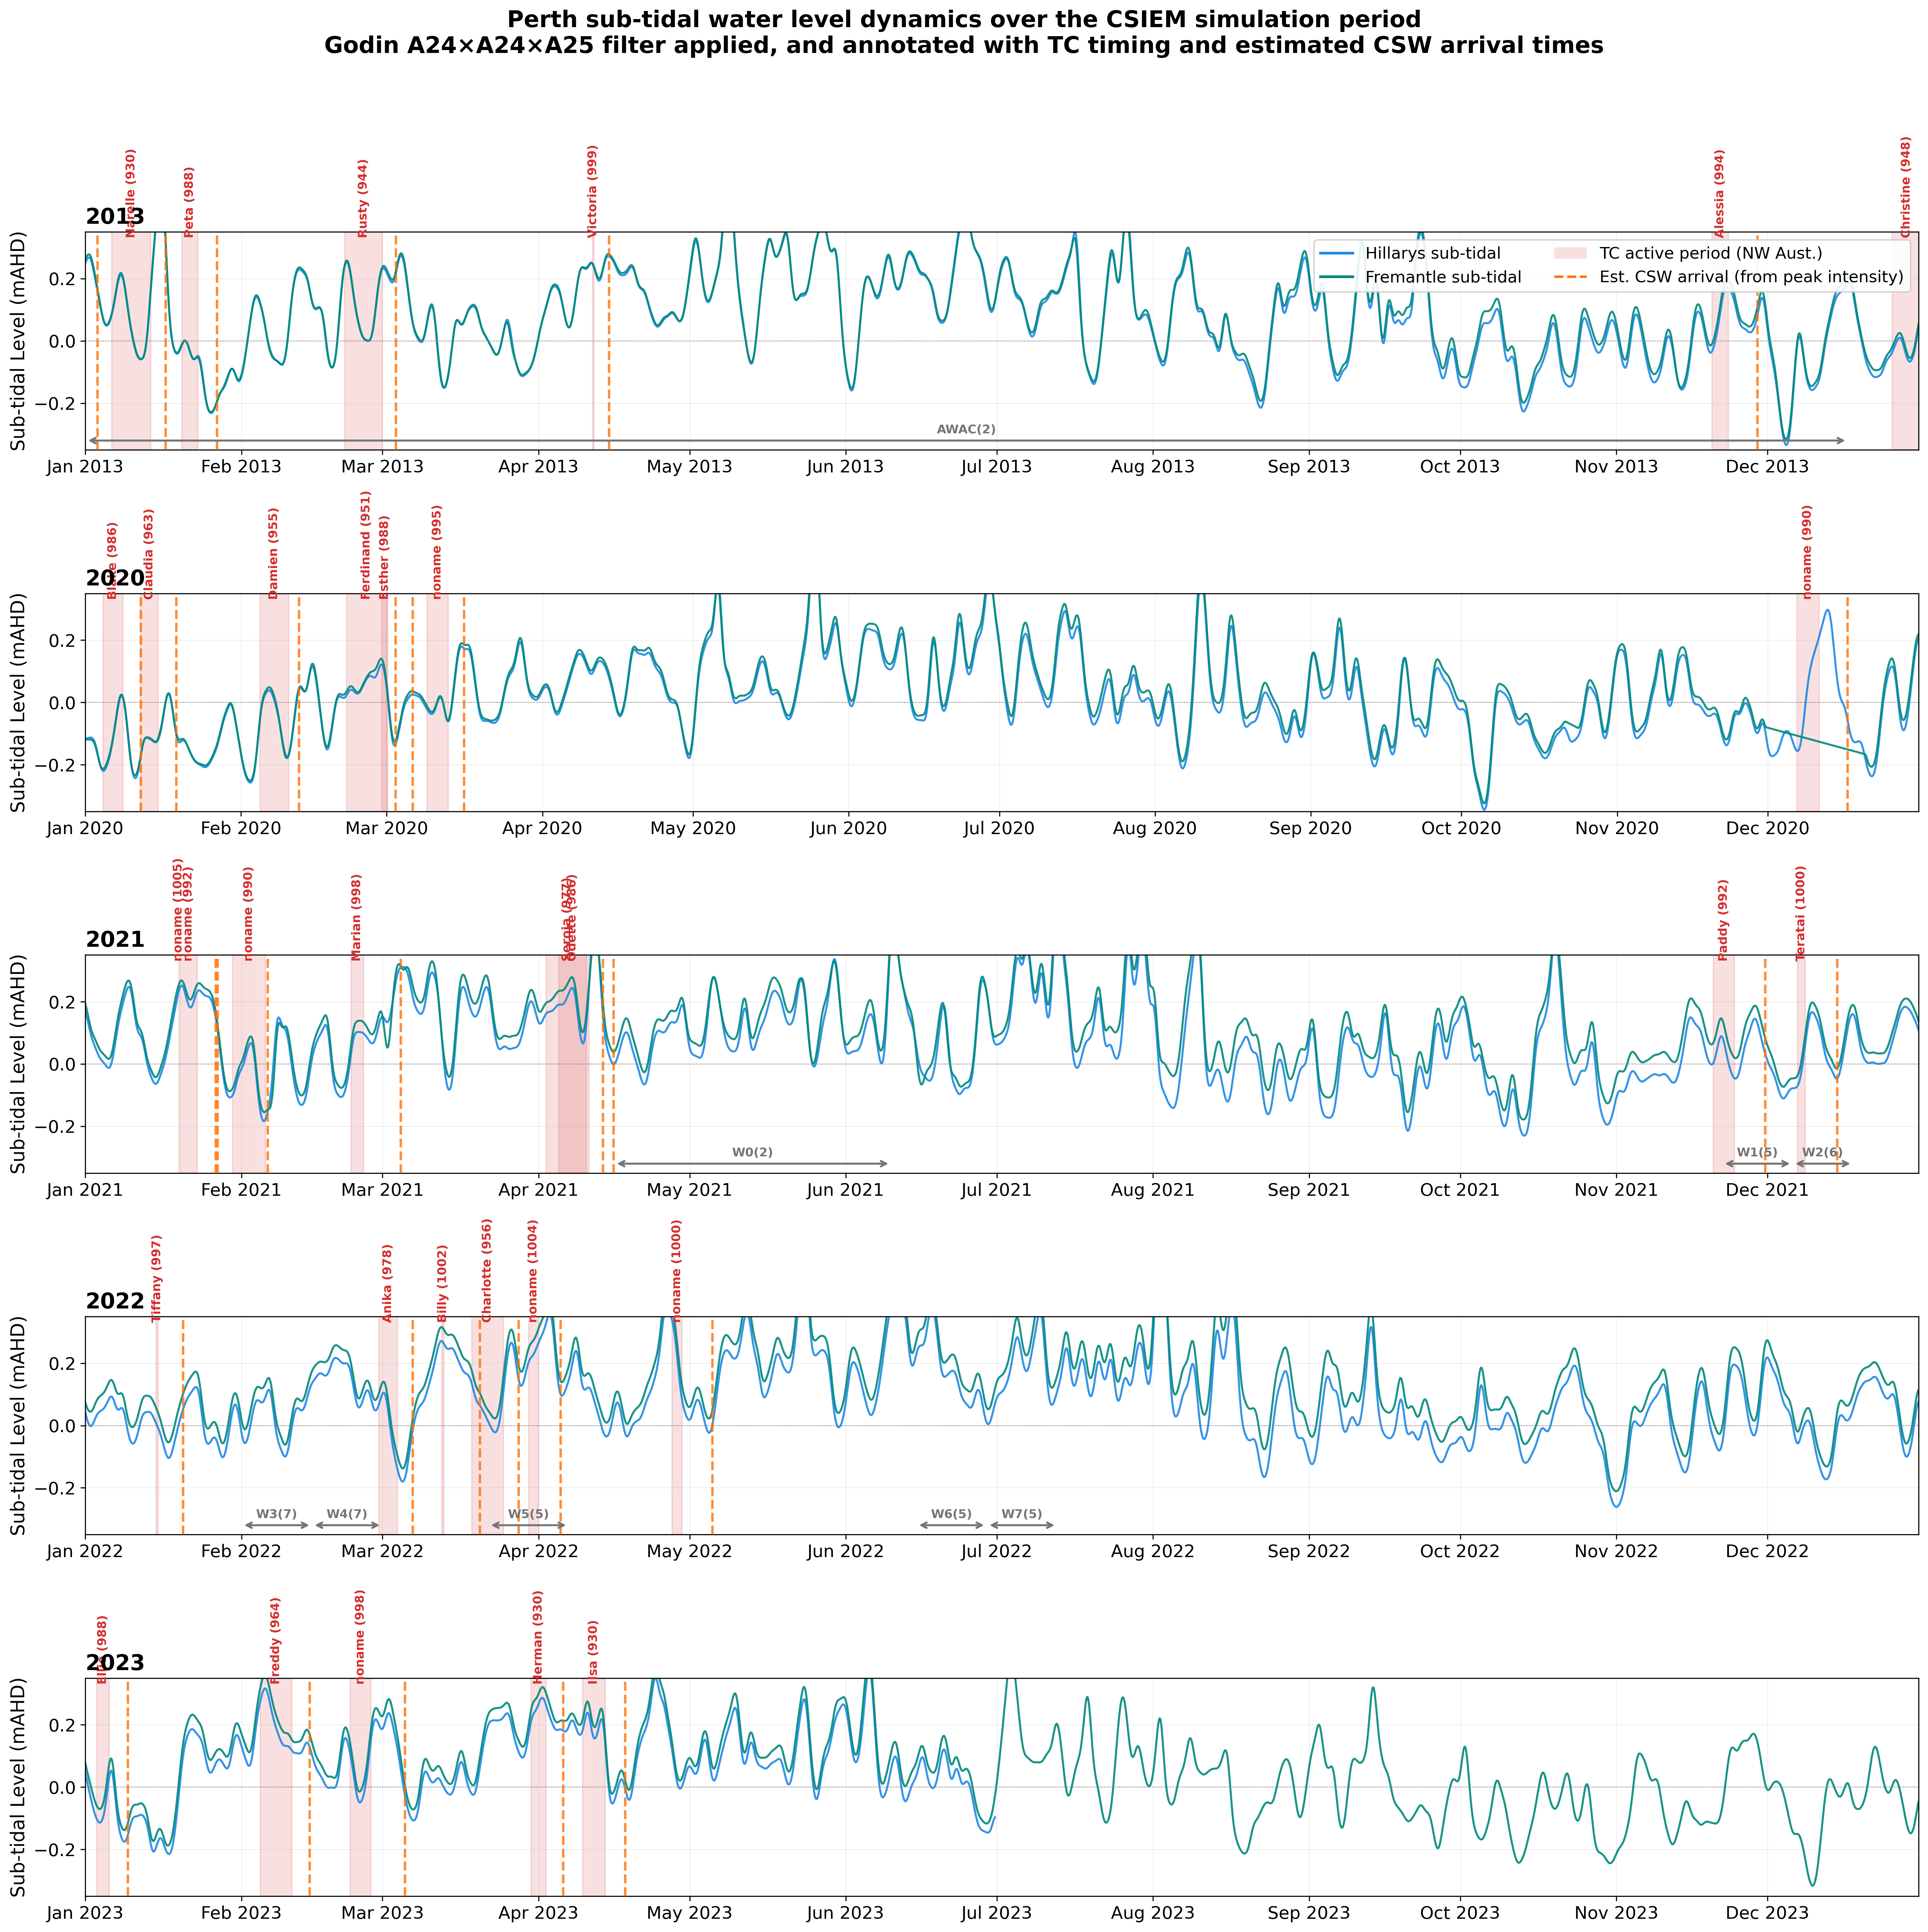
Sub-tidal water level — all simulation years (2013, 2020–2023) with TC timing and estimated CSW arrivals
Detailed Validation Plots
2013A
2020A
2021A
2021B
2022B
2022A
2023A
2023B
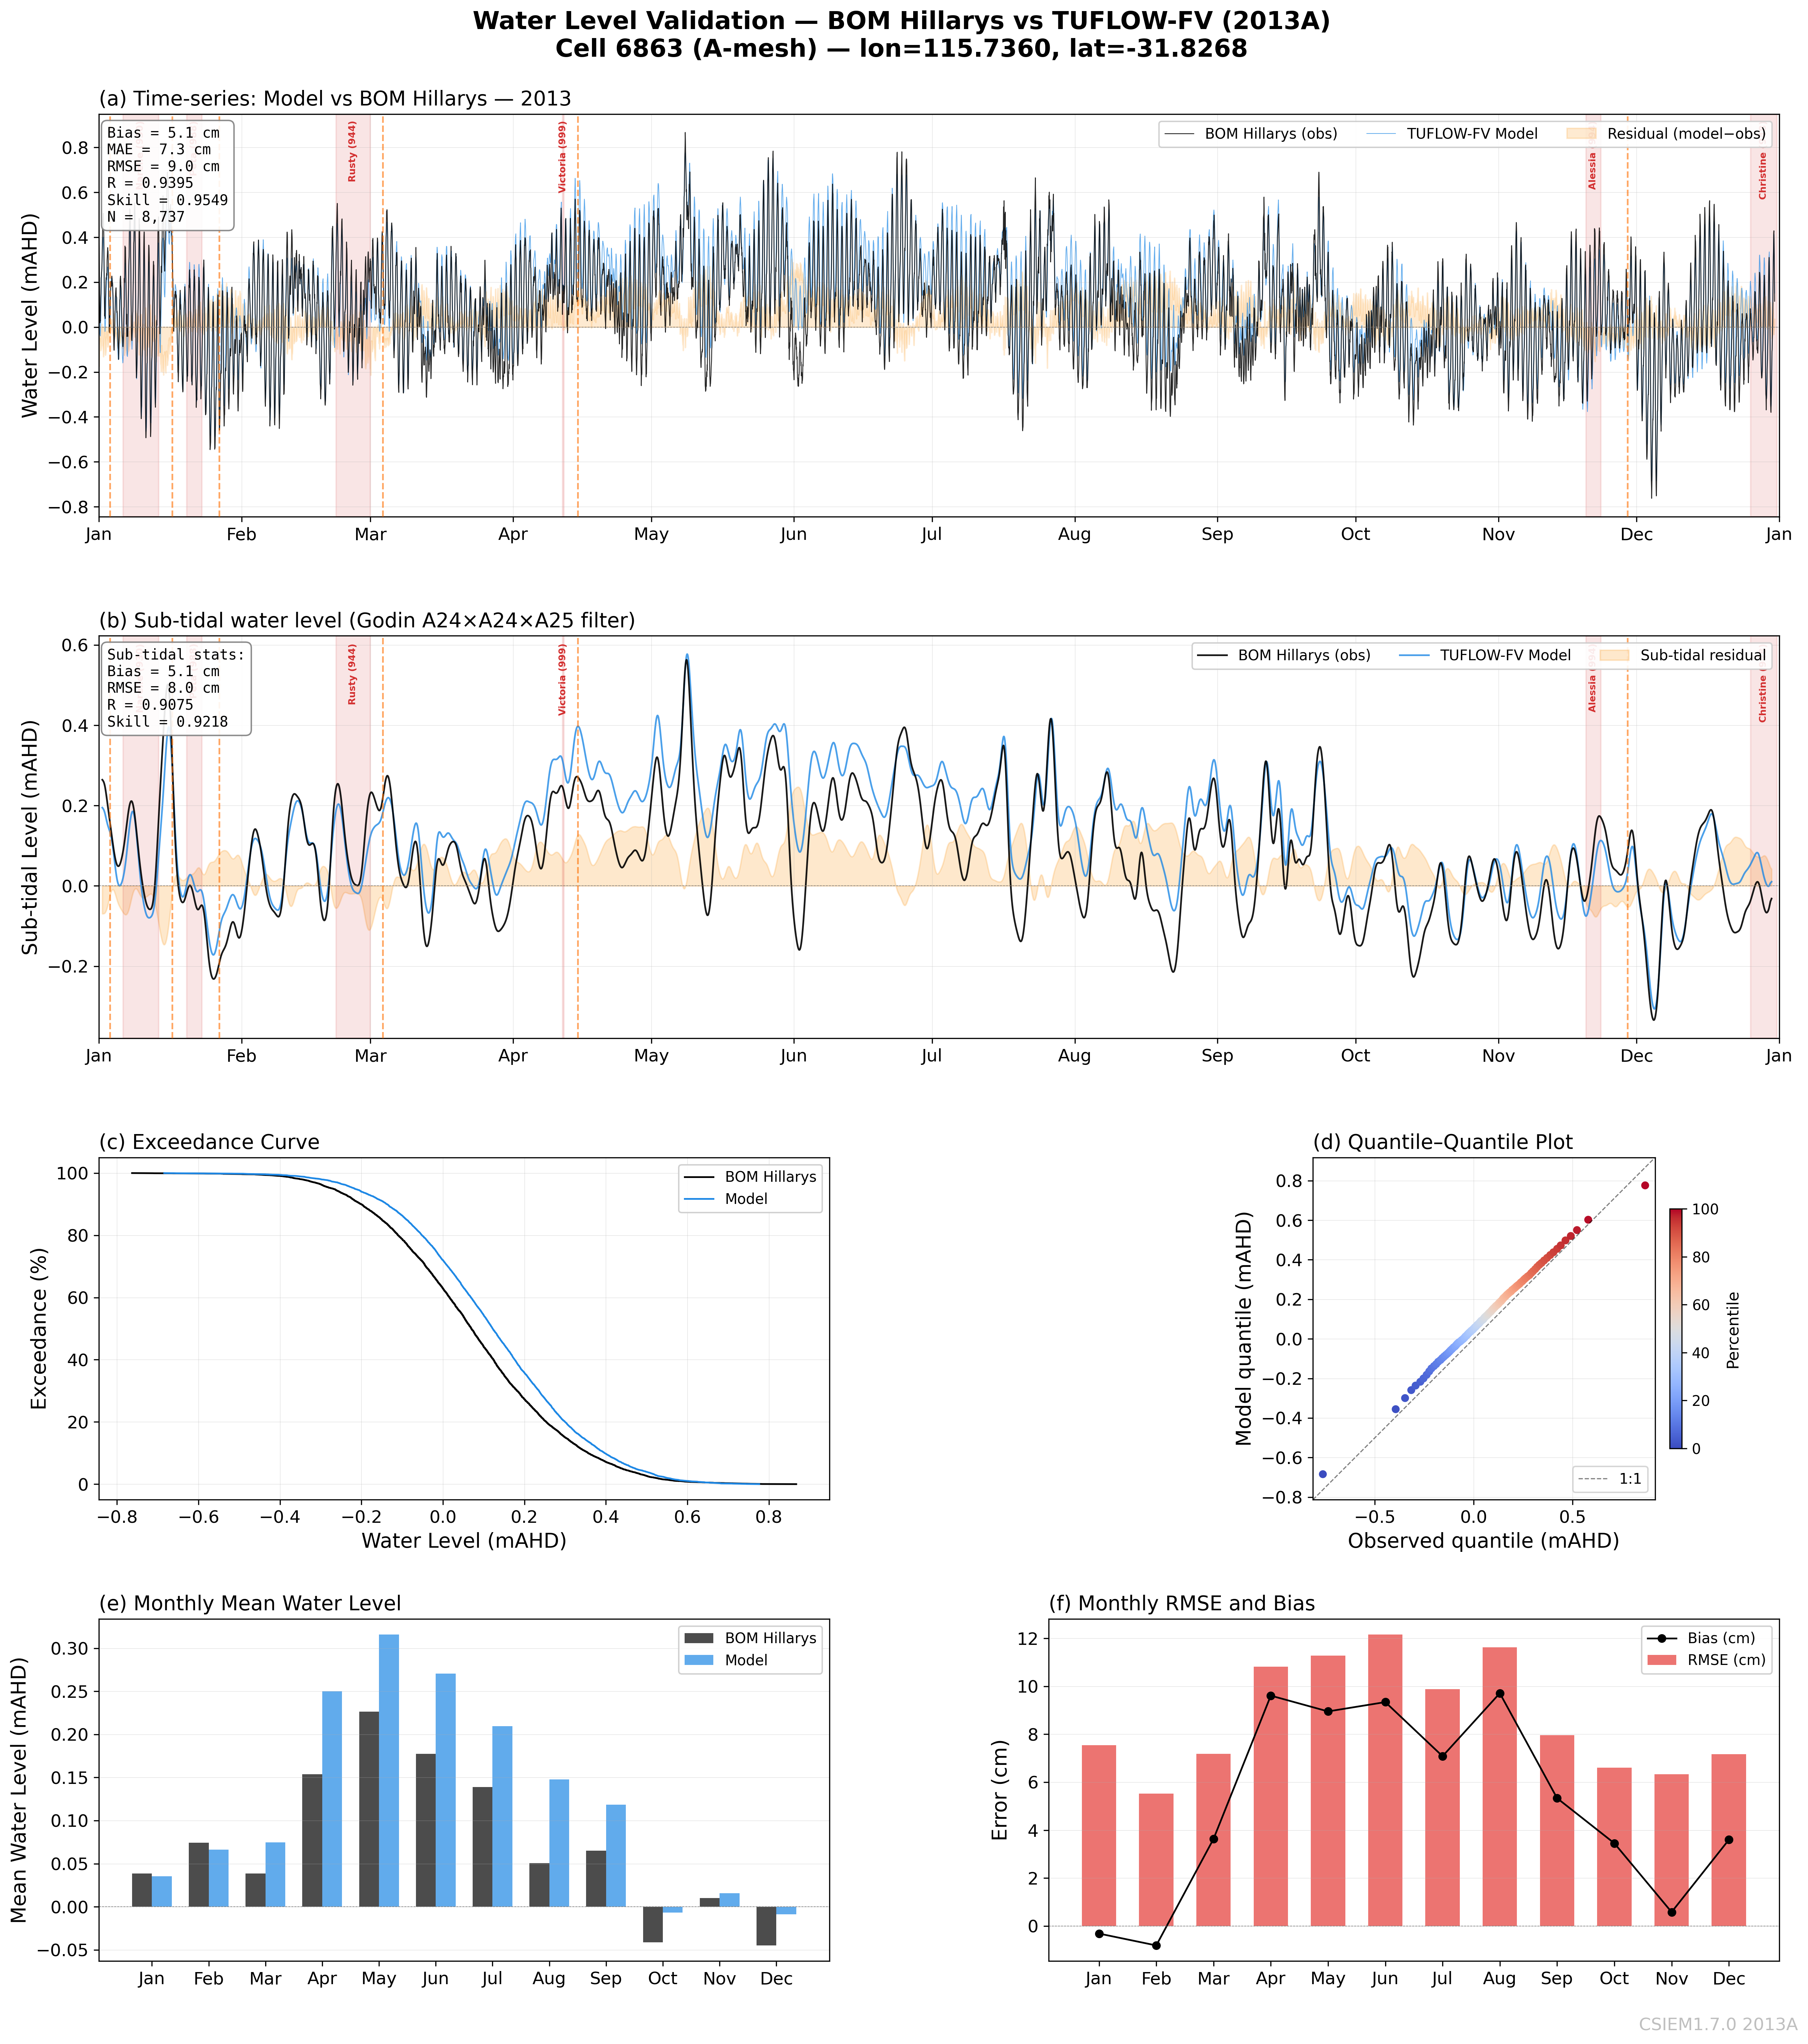
Hillarys — 2013A (A-mesh) — RMSE 9.0 cm, Skill 0.955
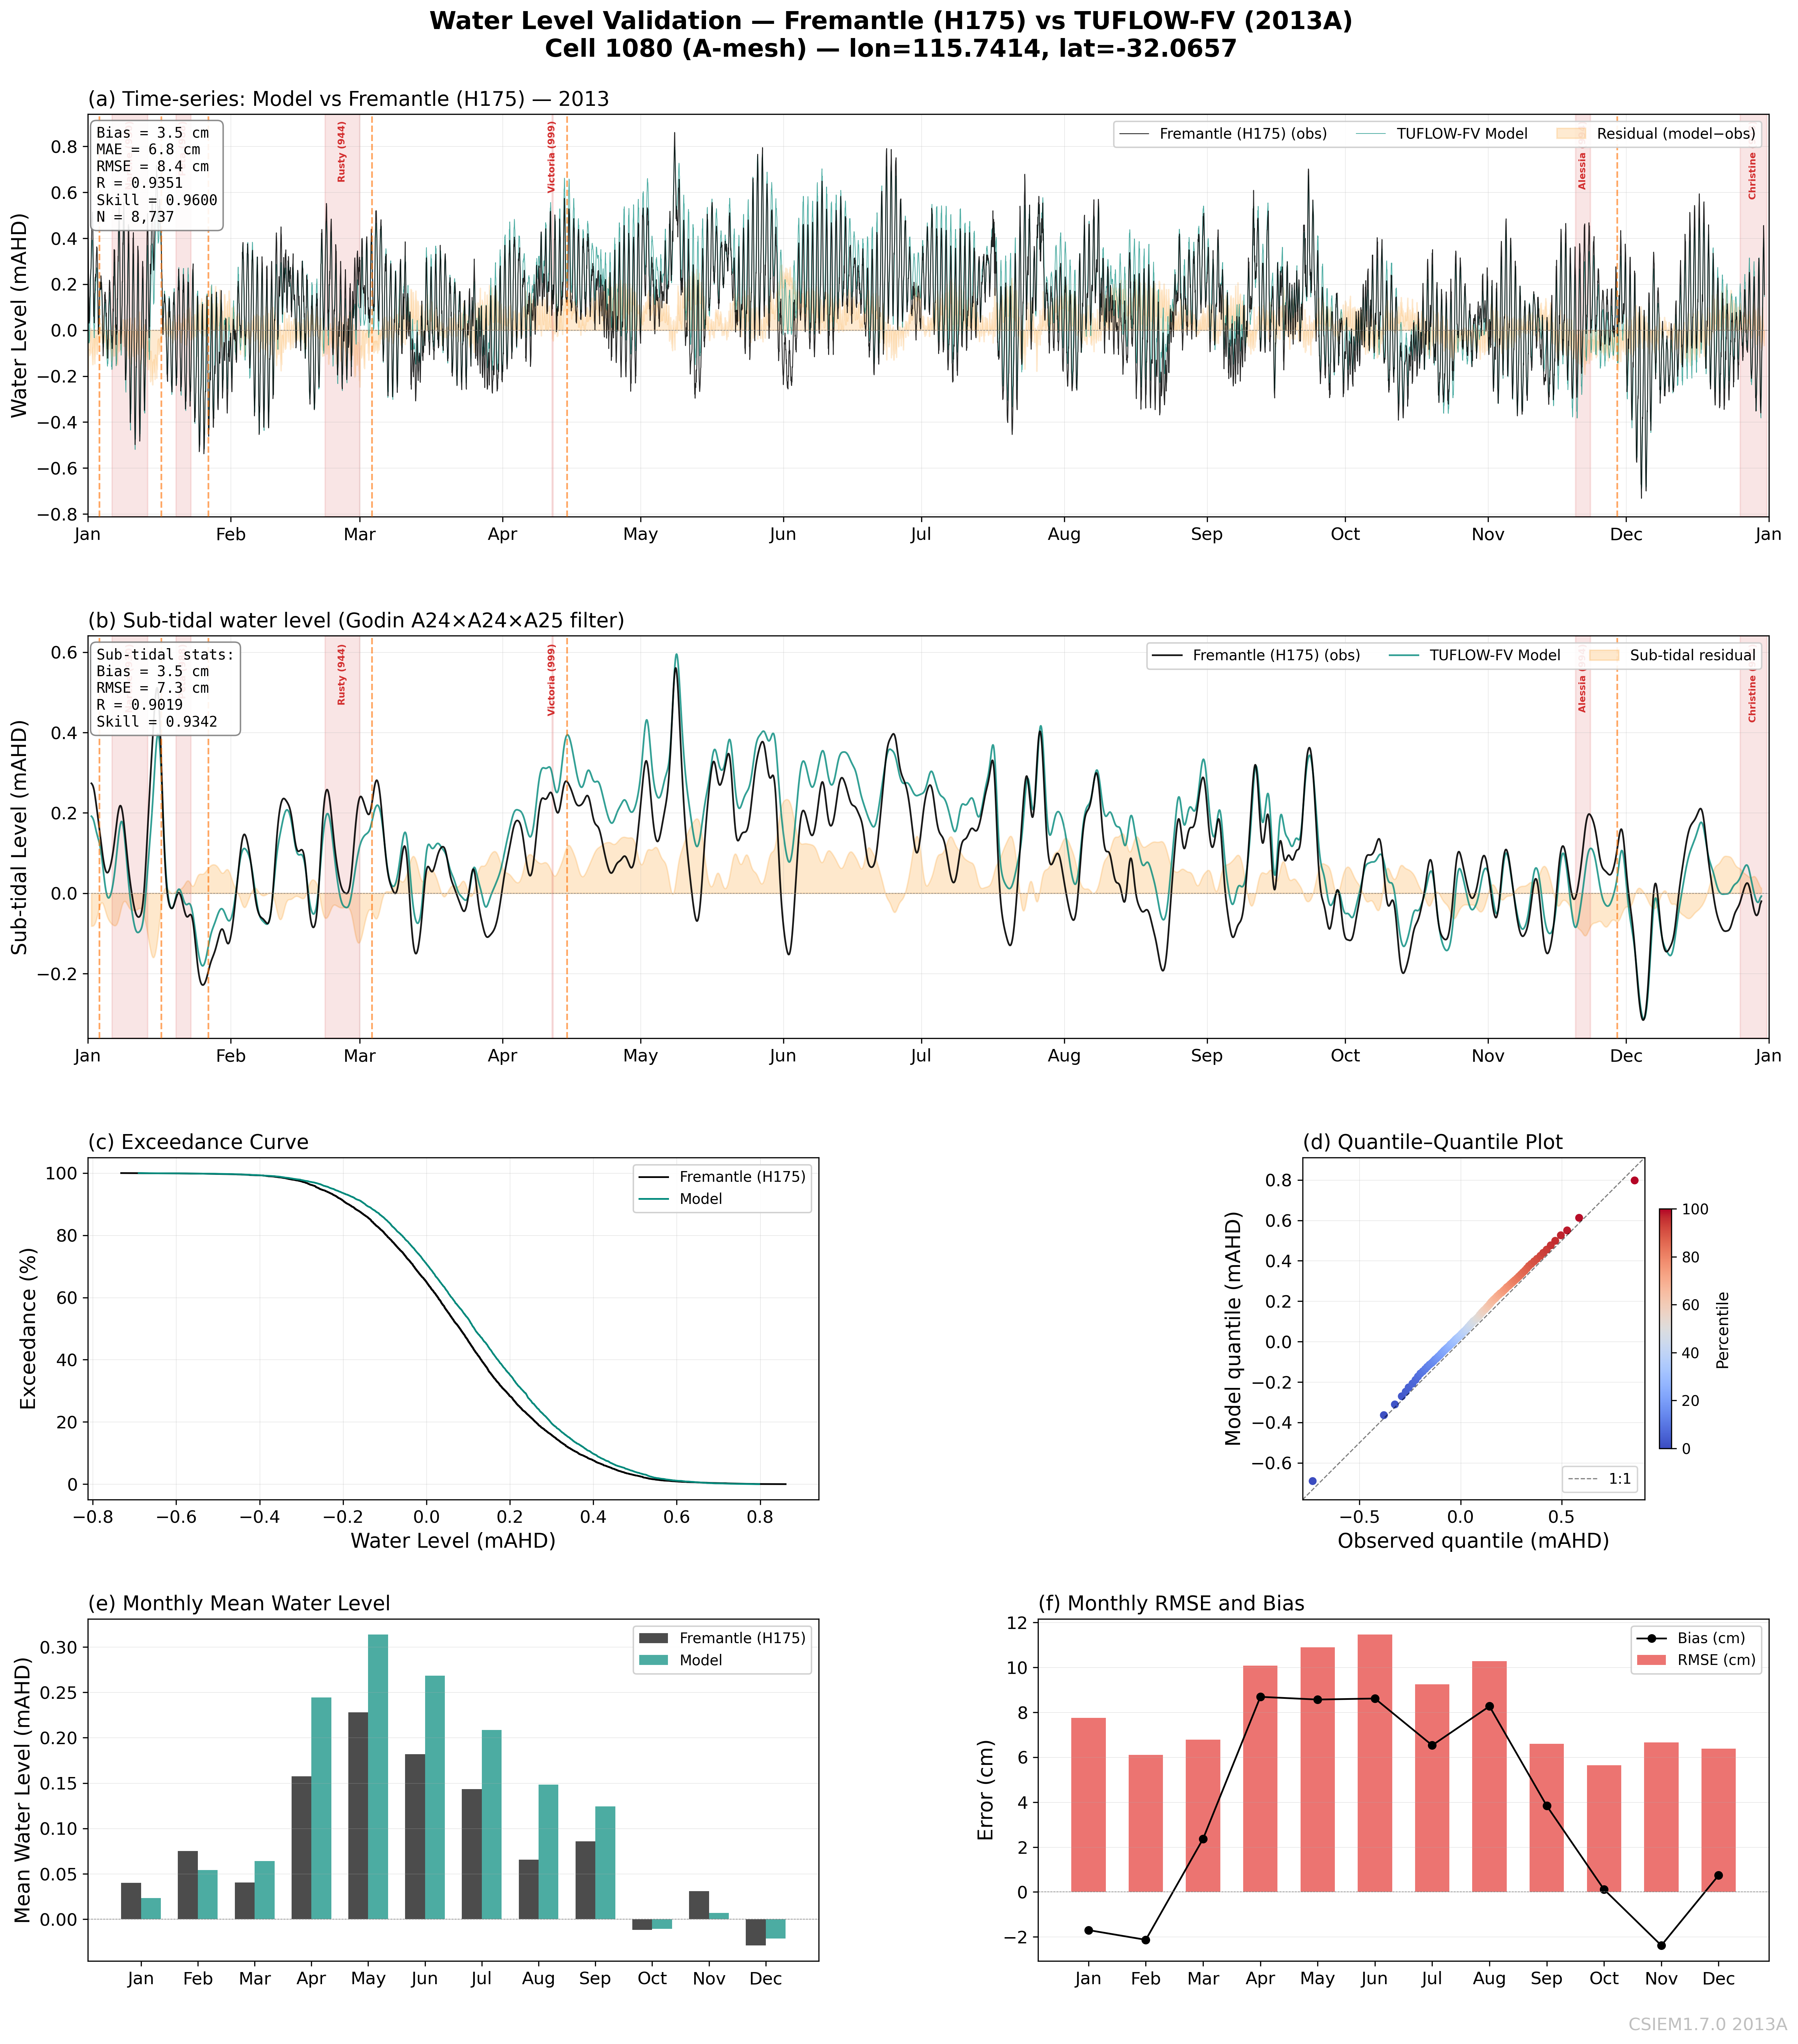
Fremantle — 2013A (A-mesh) — RMSE 8.4 cm, Skill 0.960
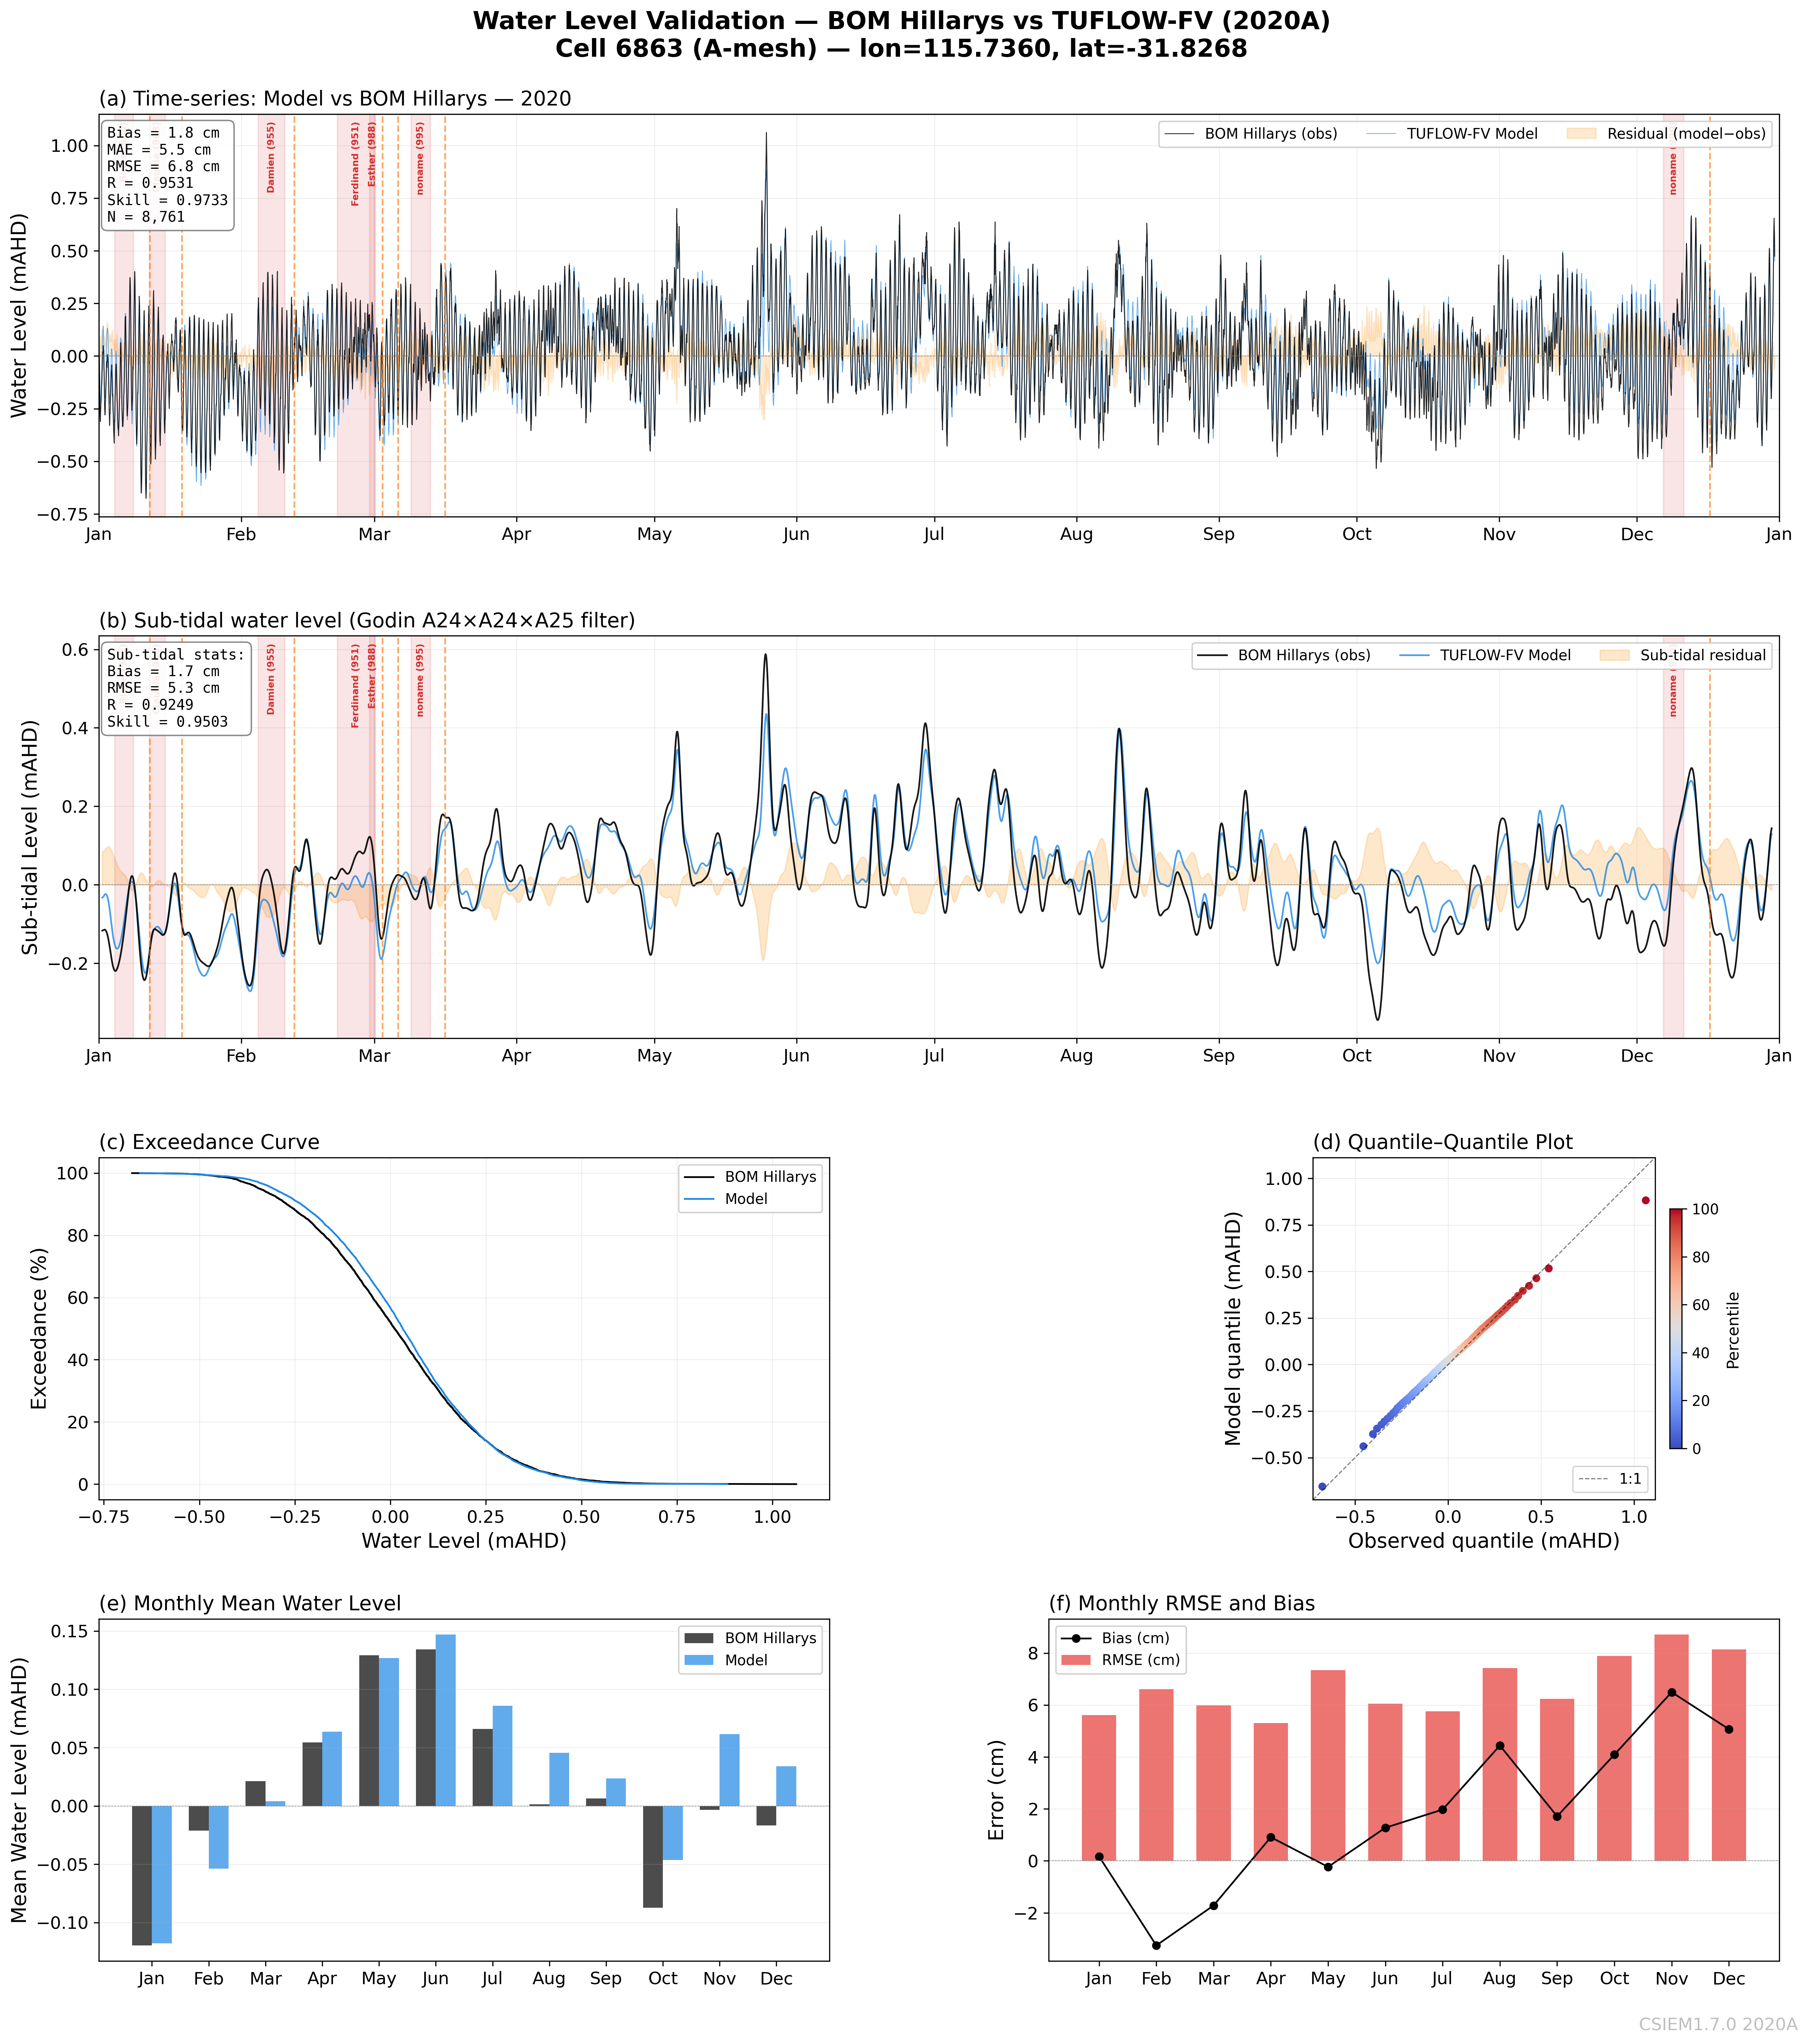
Hillarys — 2020A (A-mesh) — RMSE 6.8 cm, Skill 0.973
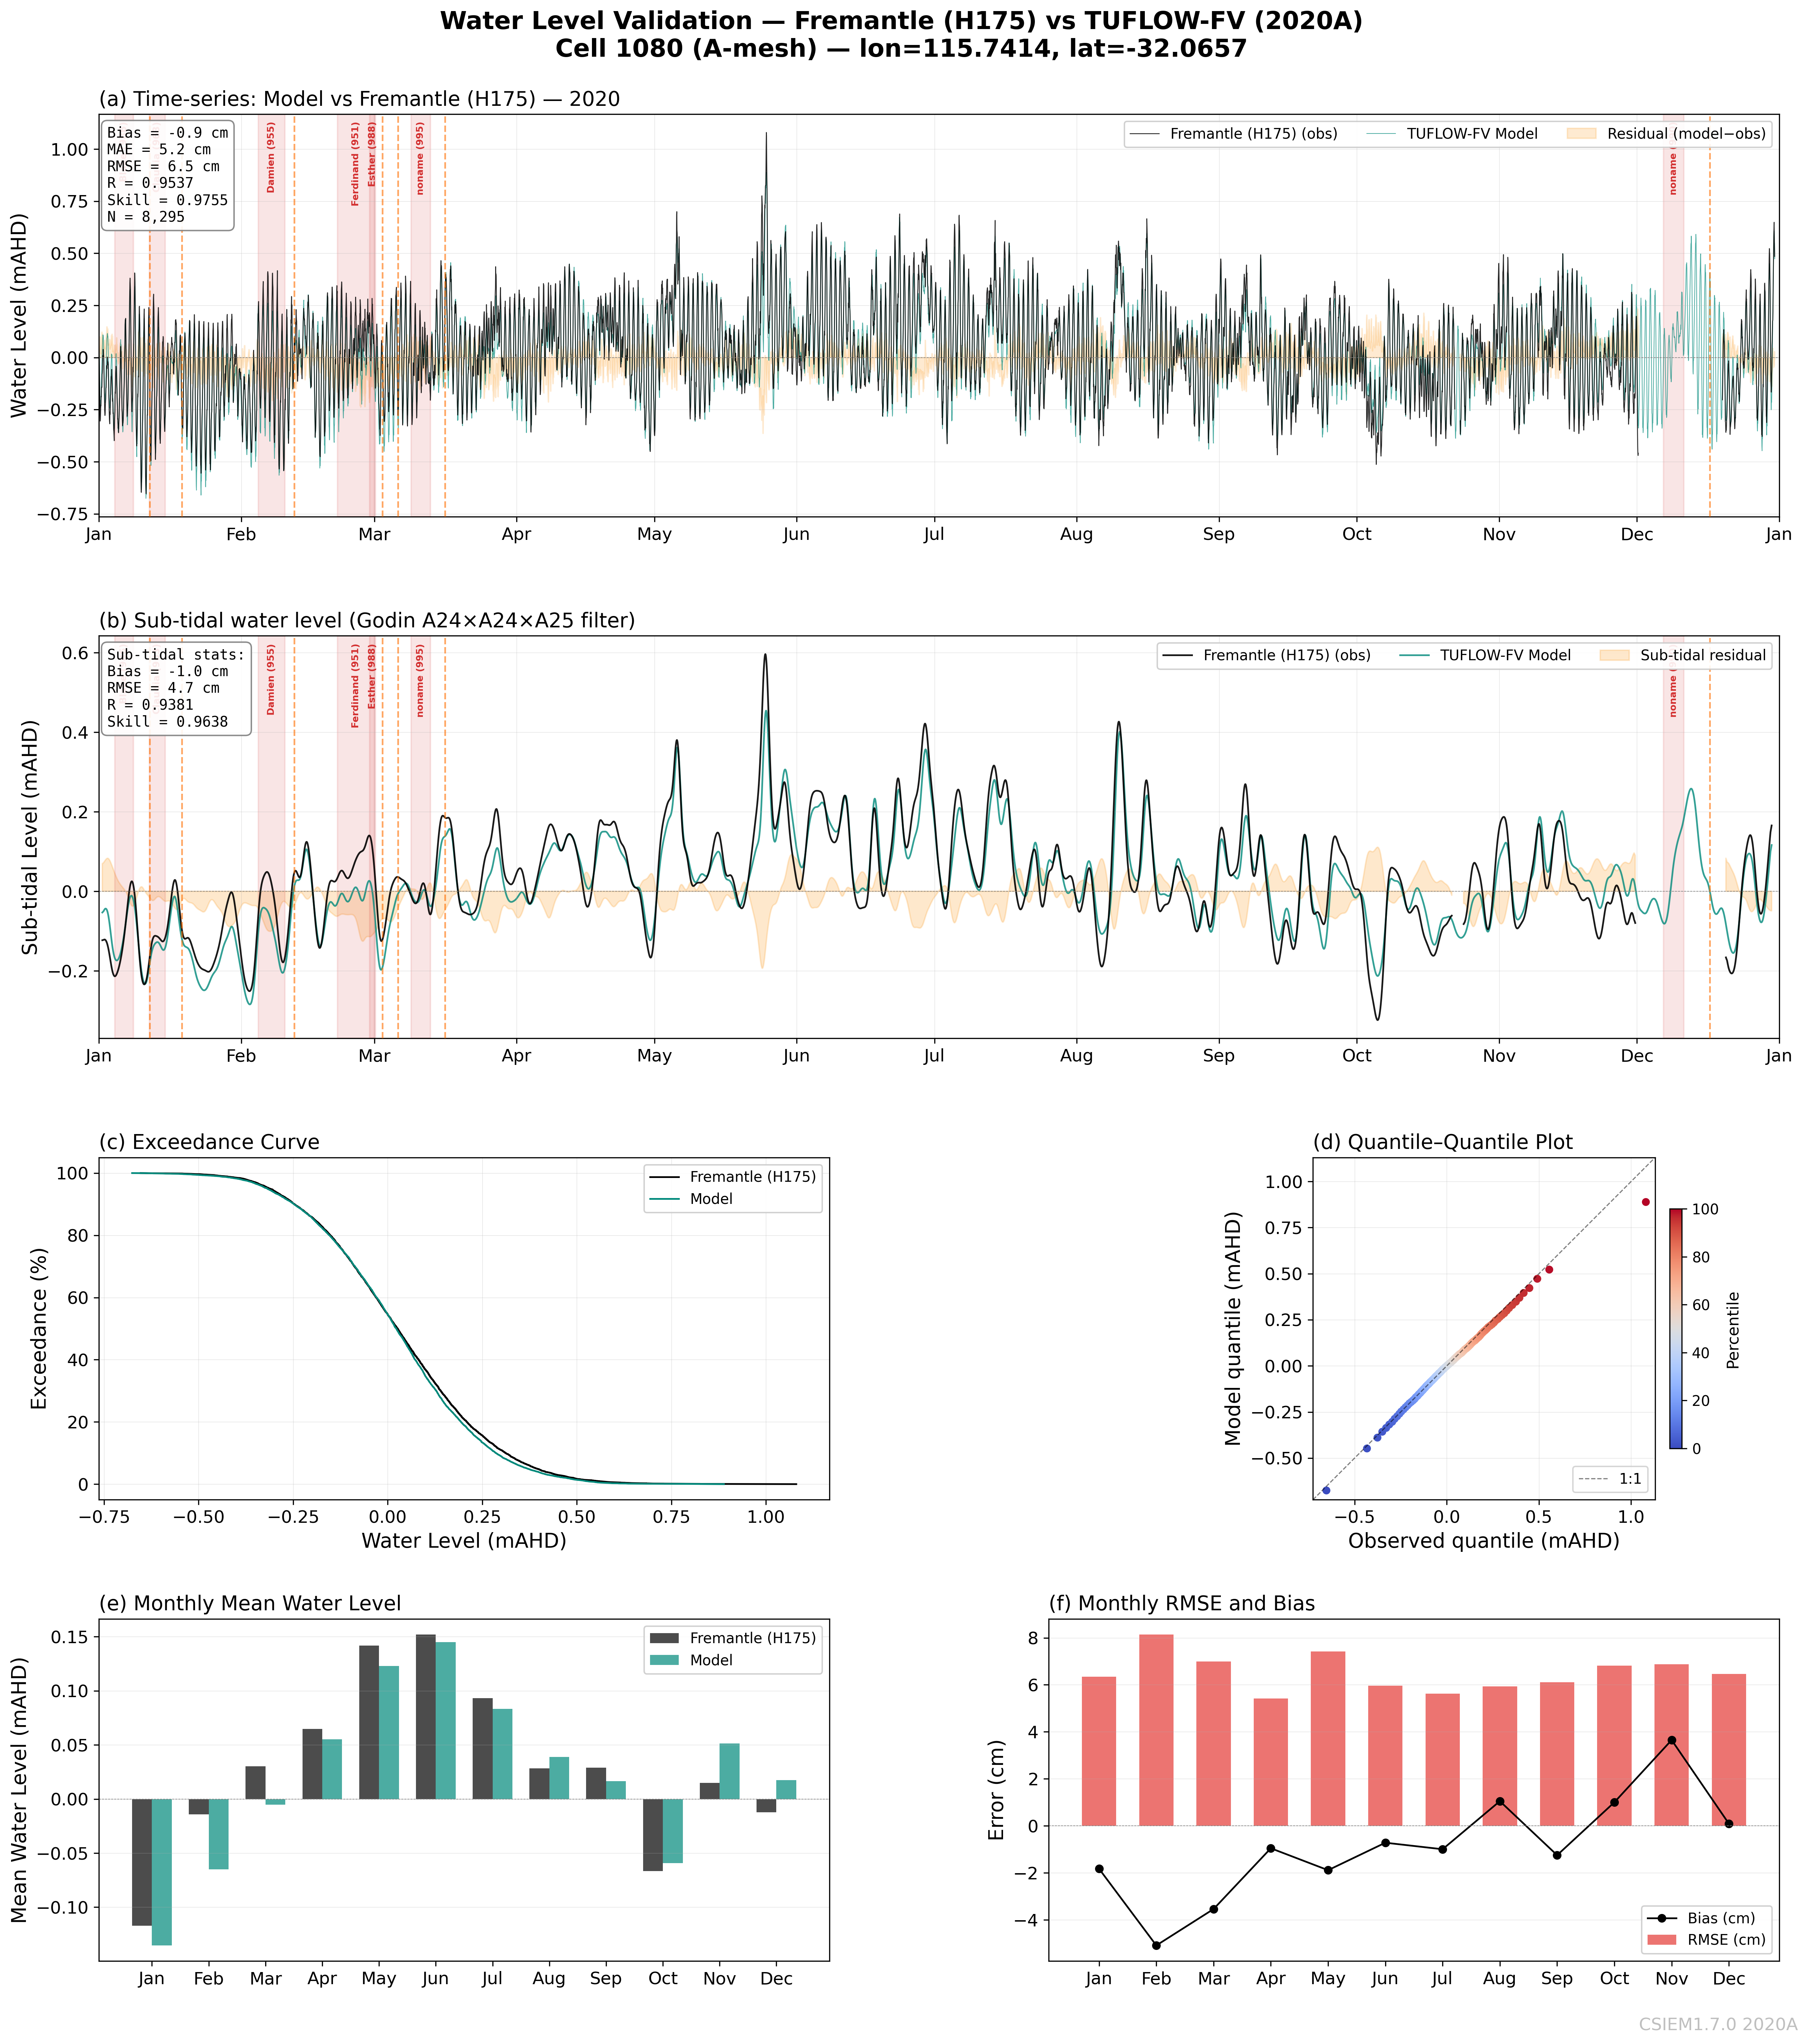
Fremantle — 2020A (A-mesh) — RMSE 6.6 cm, Skill 0.976
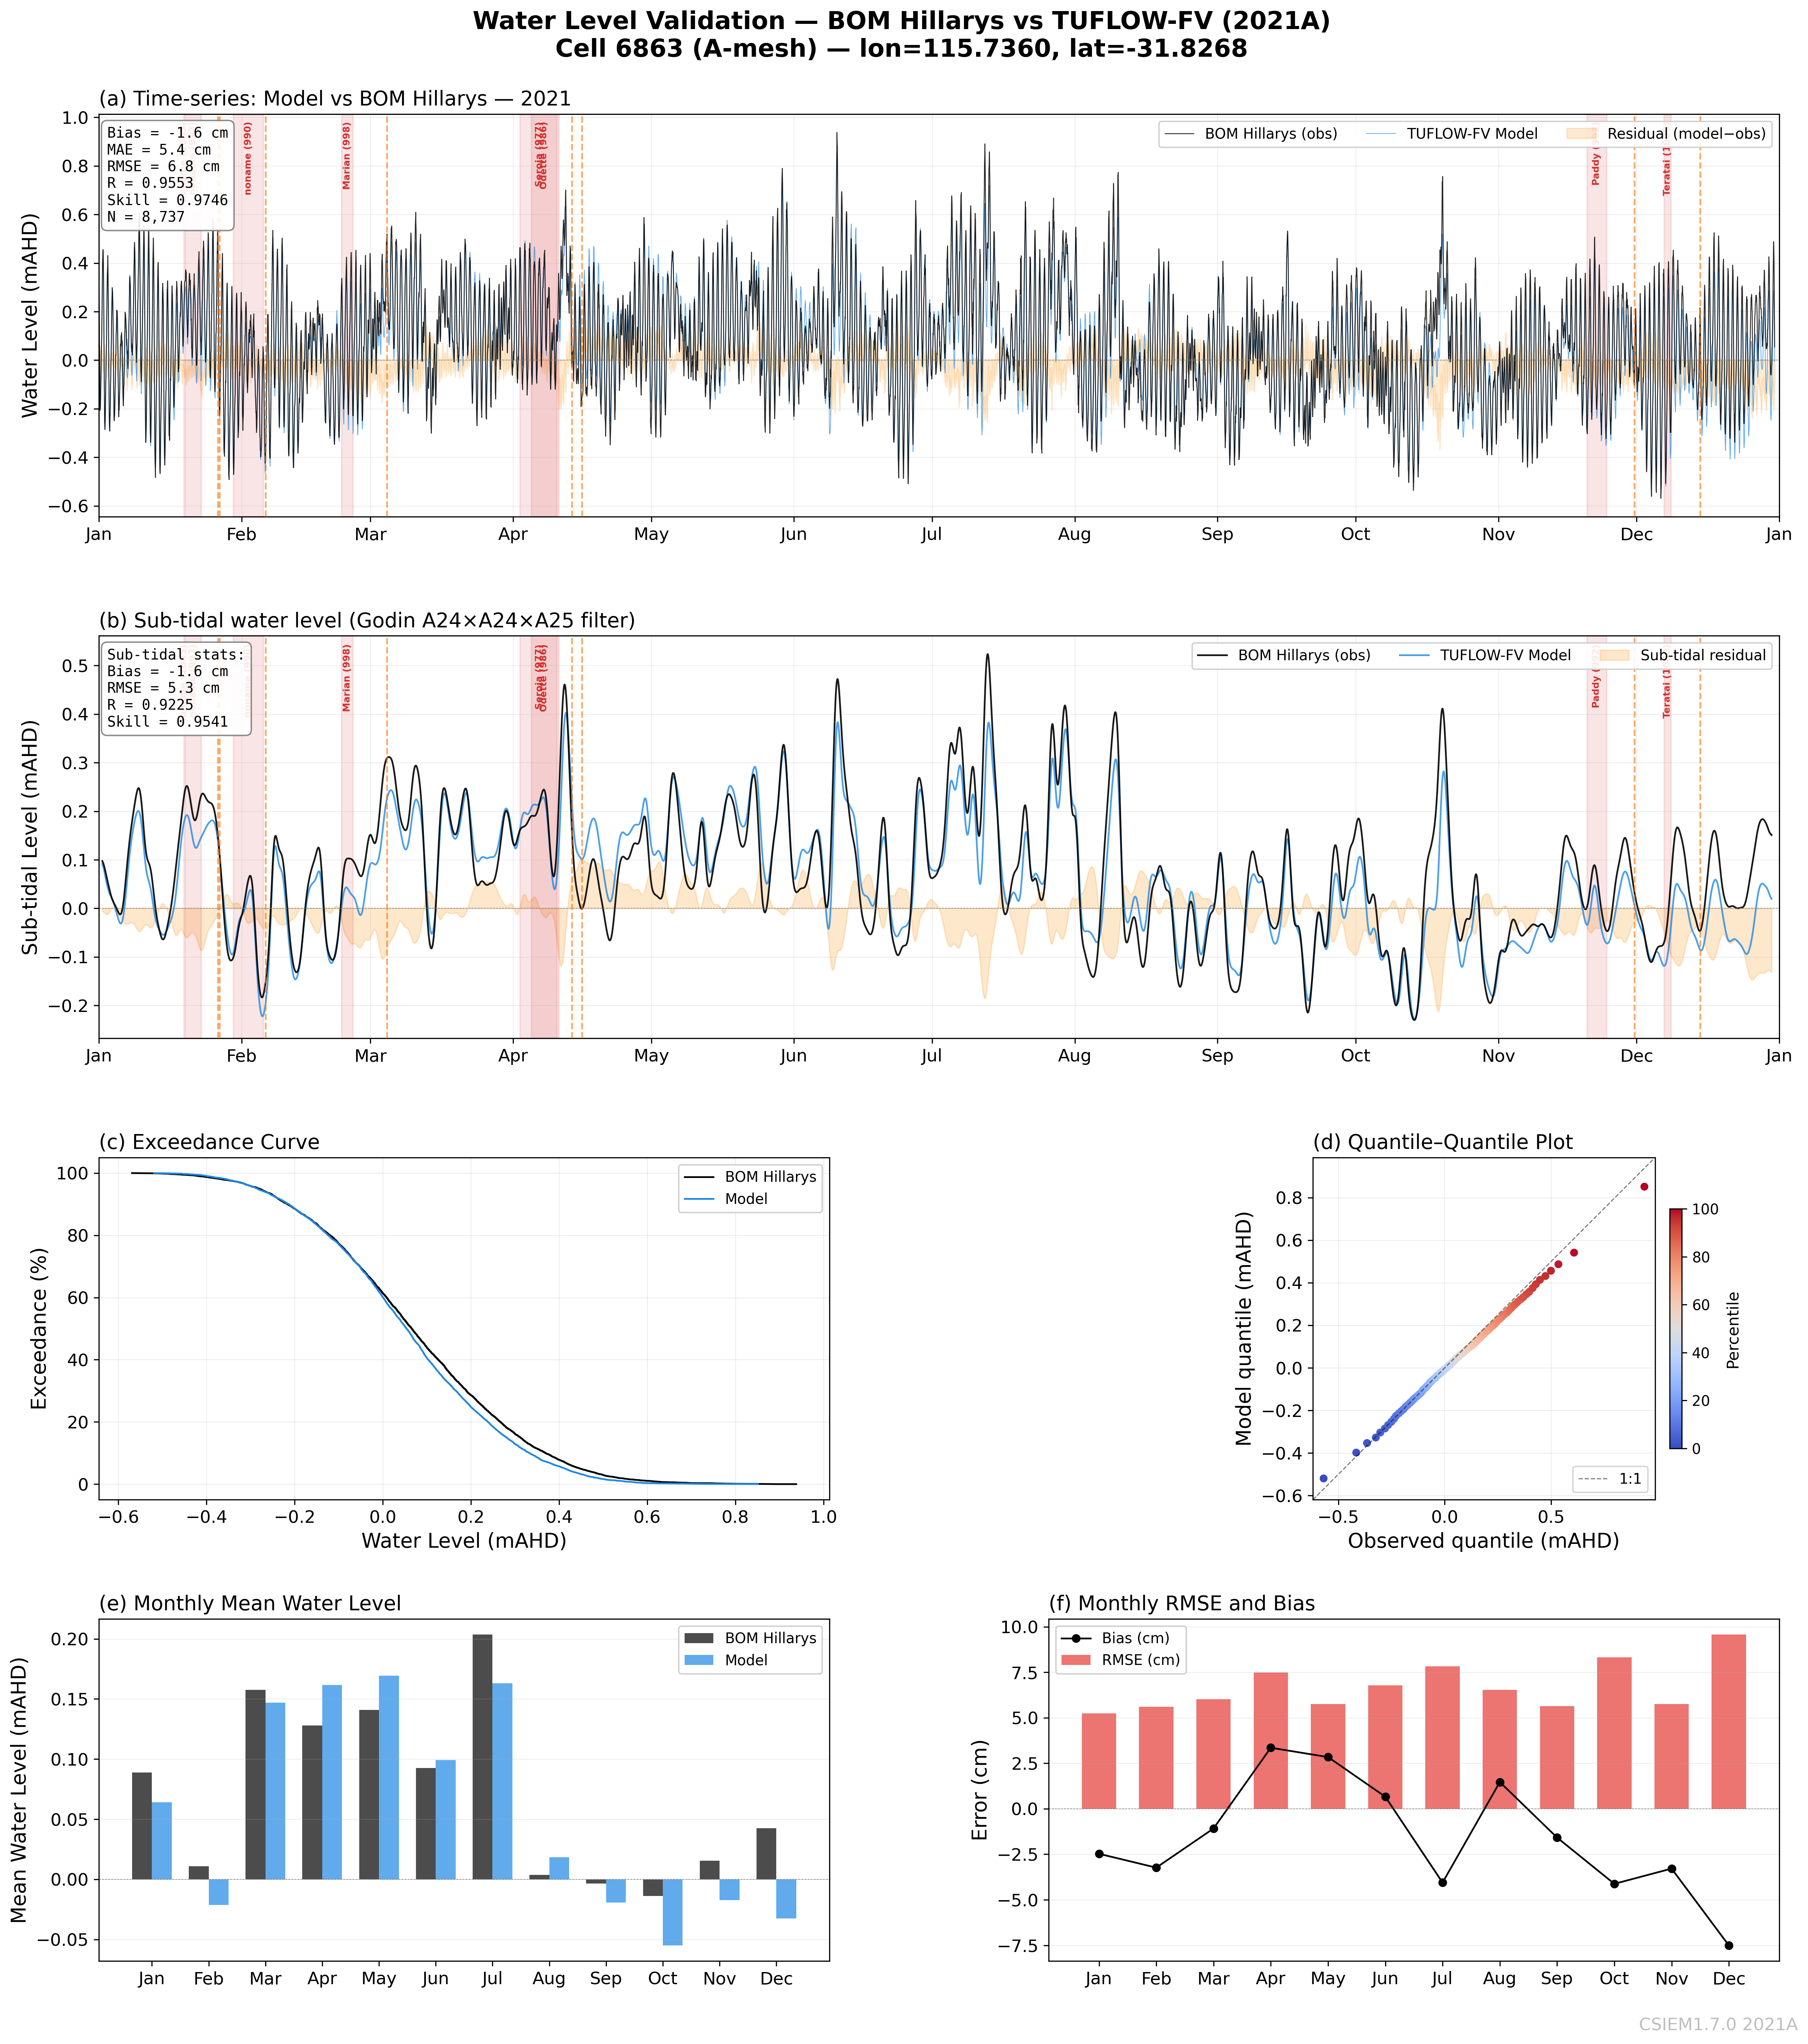
Hillarys — 2021A (A-mesh) — RMSE 6.8 cm, Skill 0.975
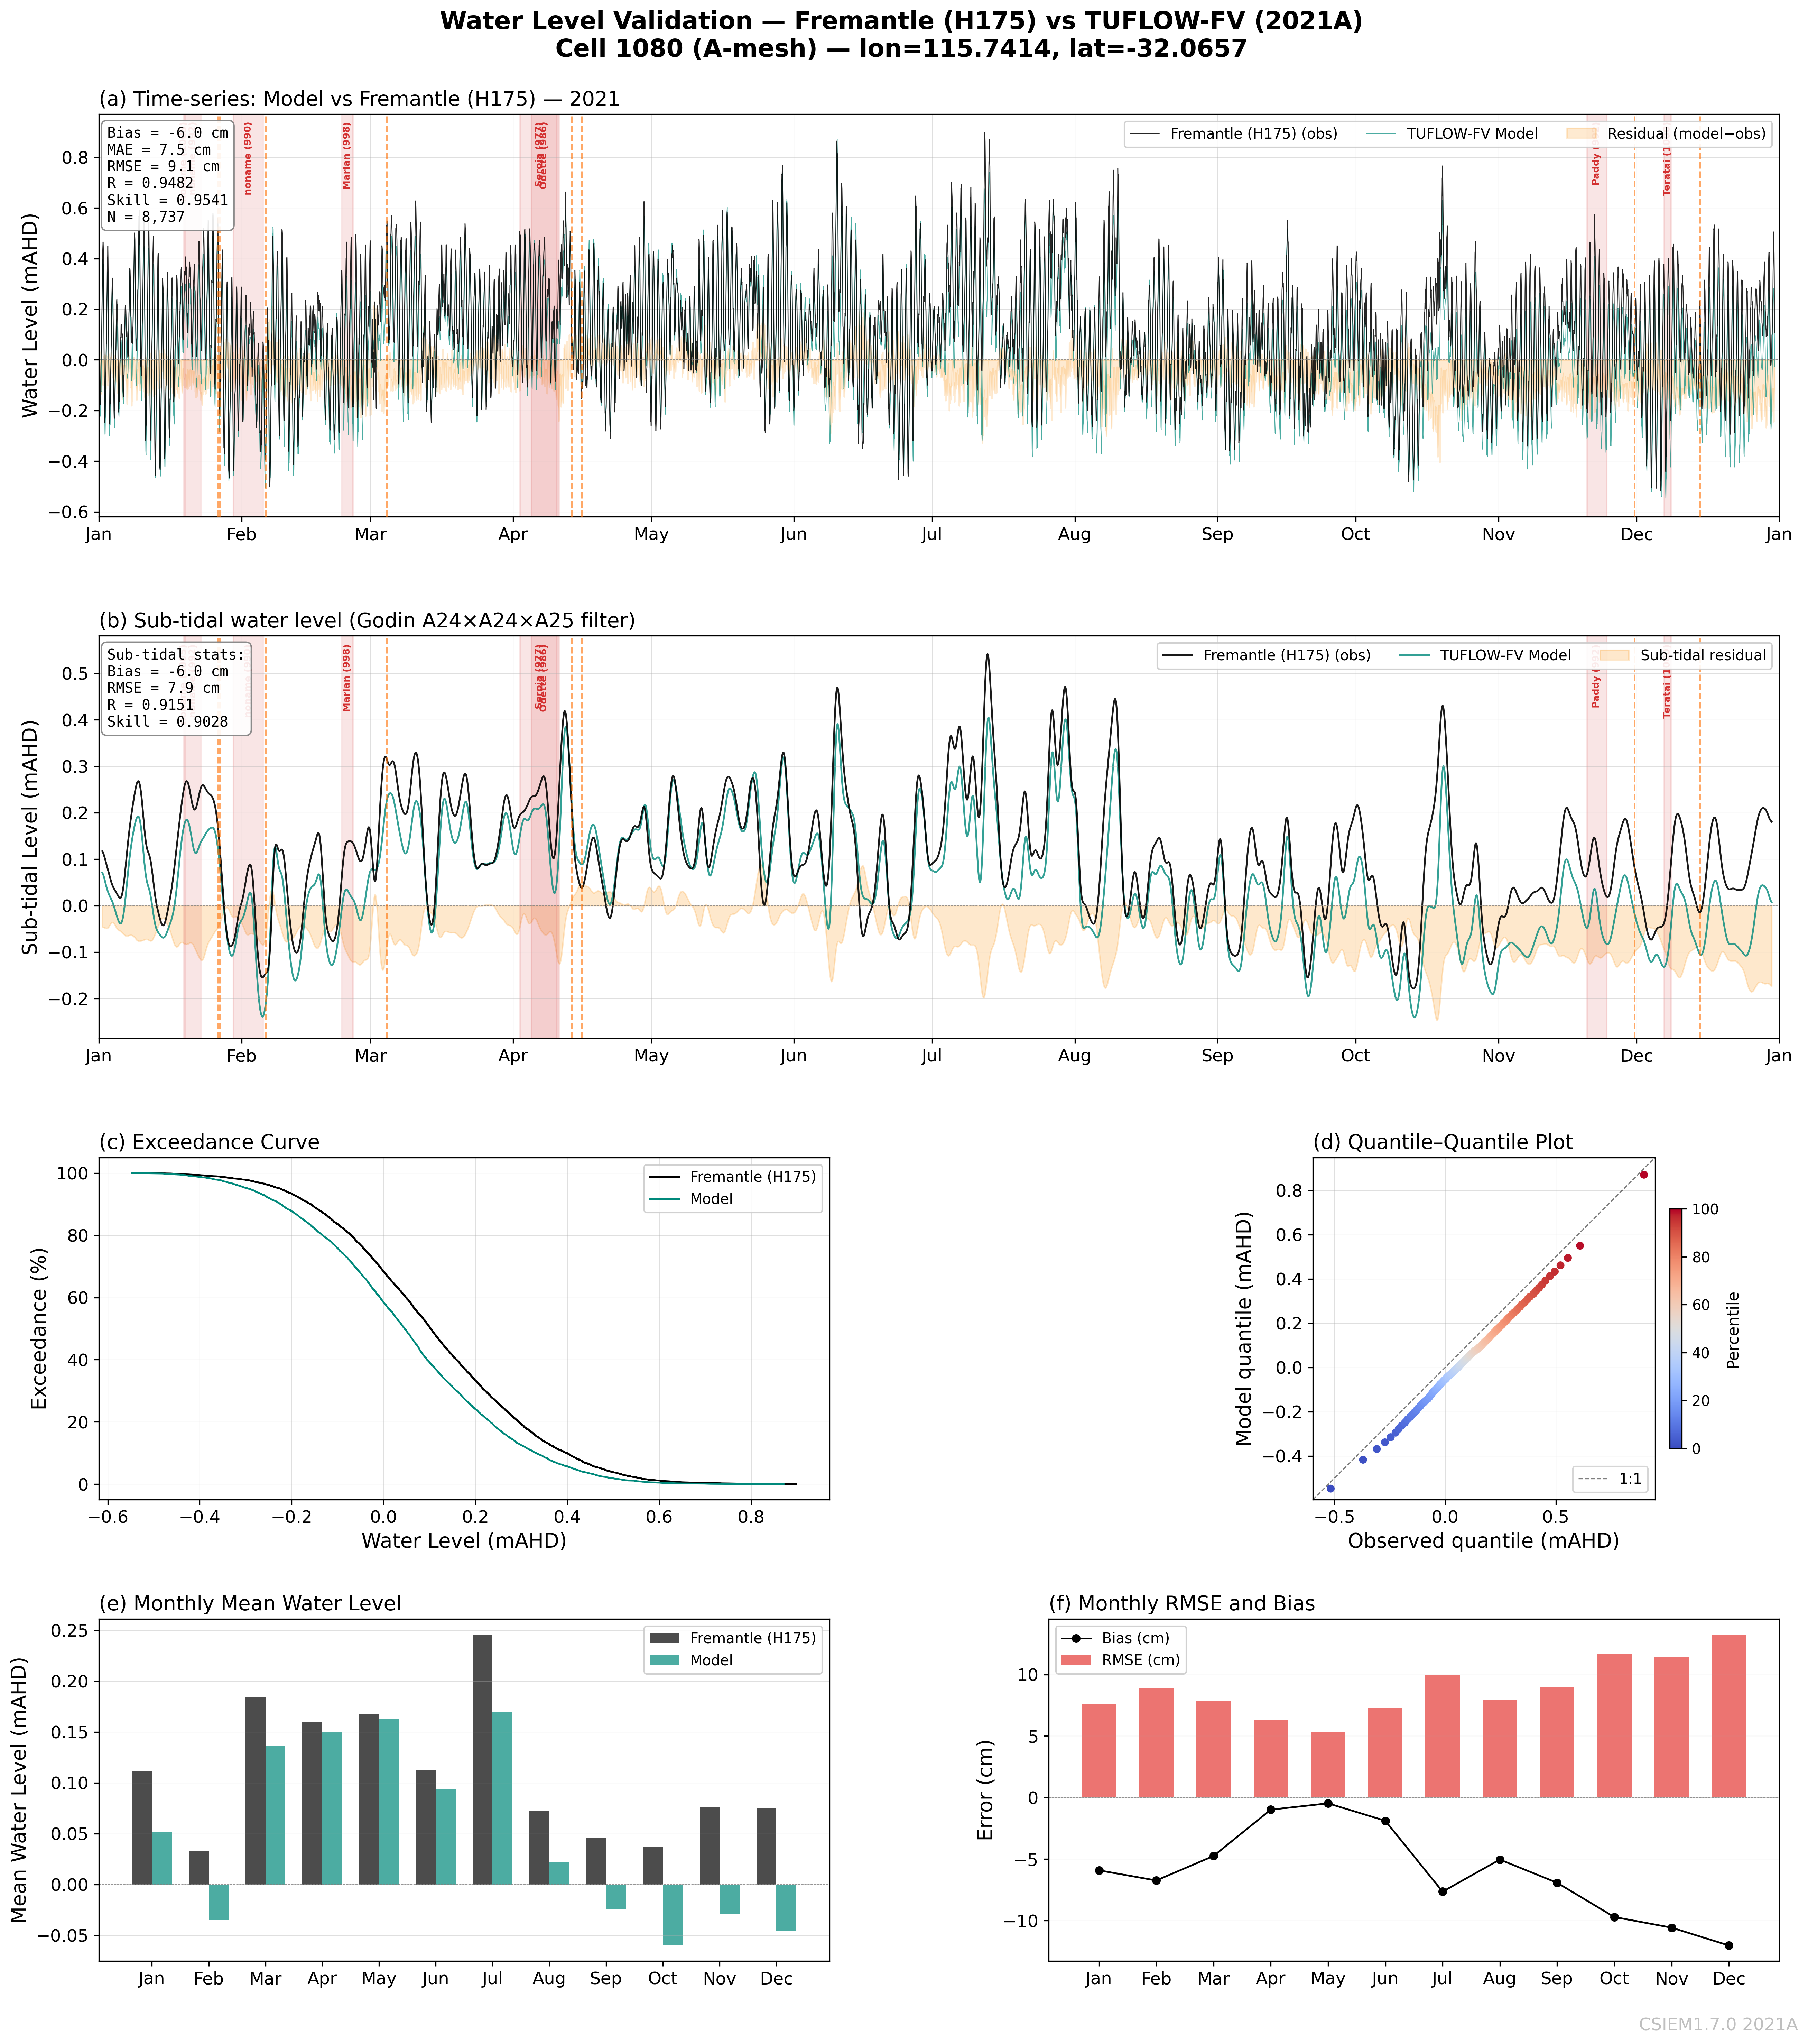
Fremantle — 2021A (A-mesh) — RMSE 9.2 cm, Skill 0.954
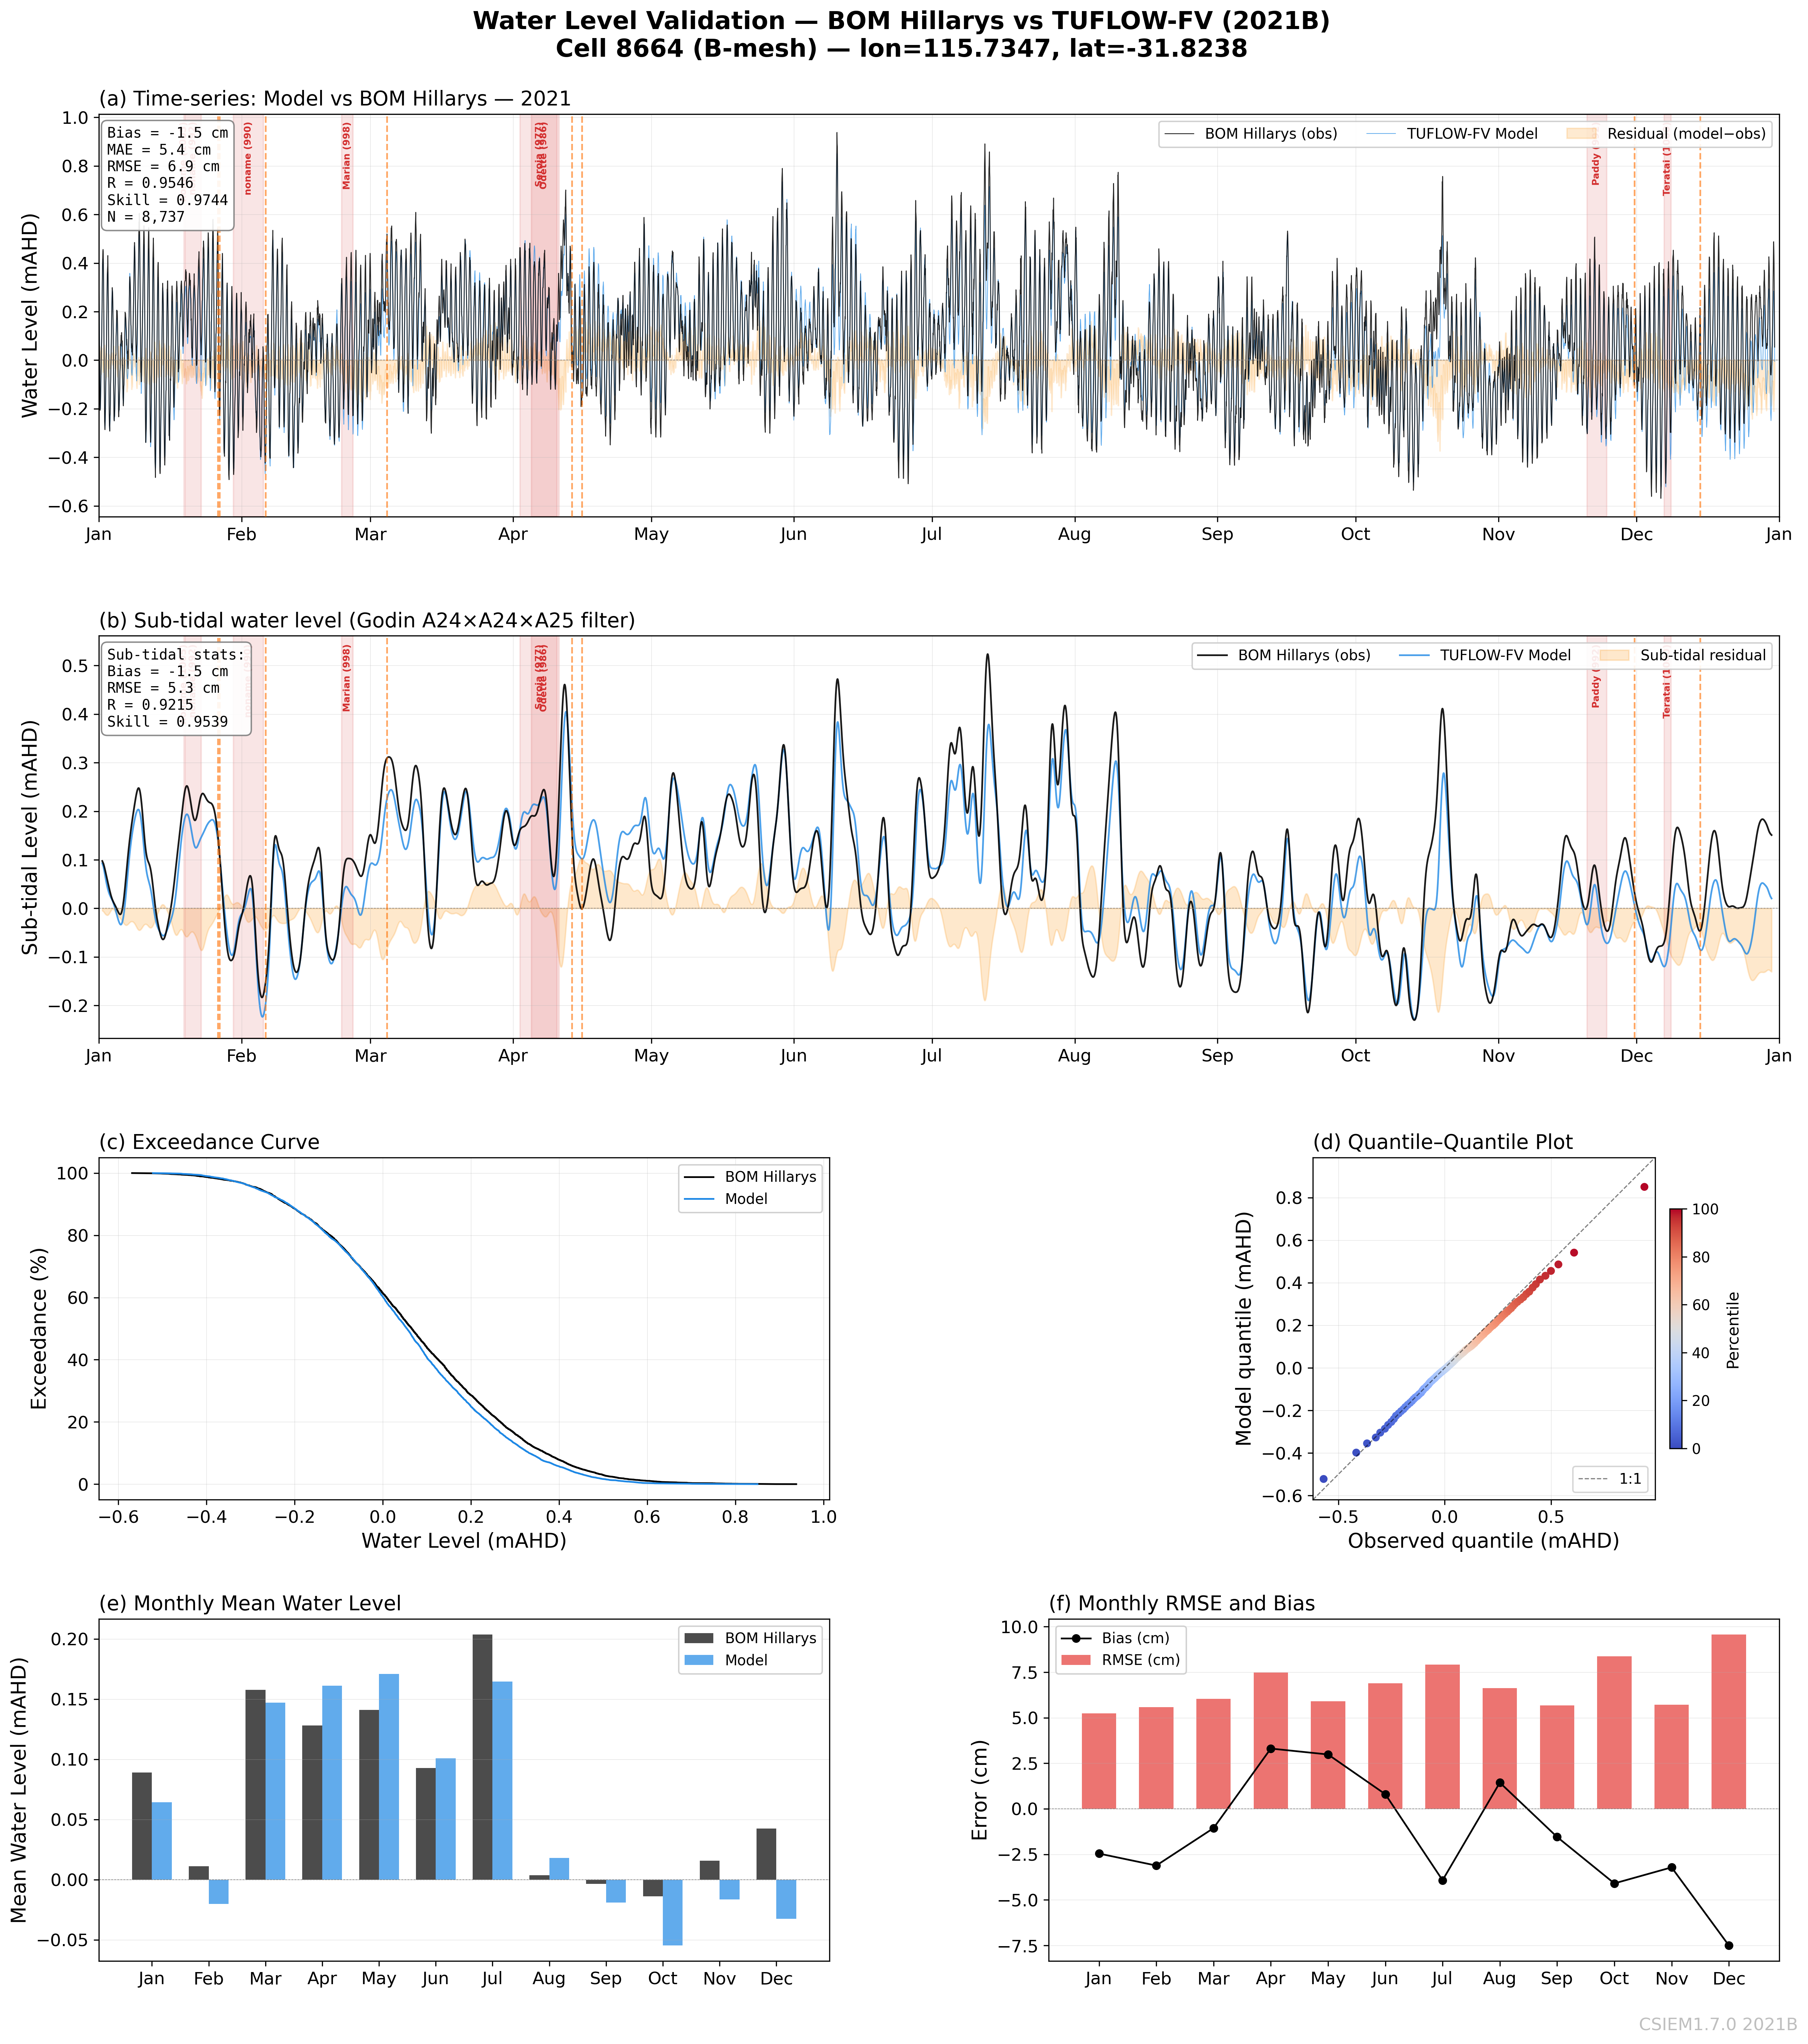
Hillarys — 2021B (B-mesh) — RMSE 6.9 cm, Skill 0.974
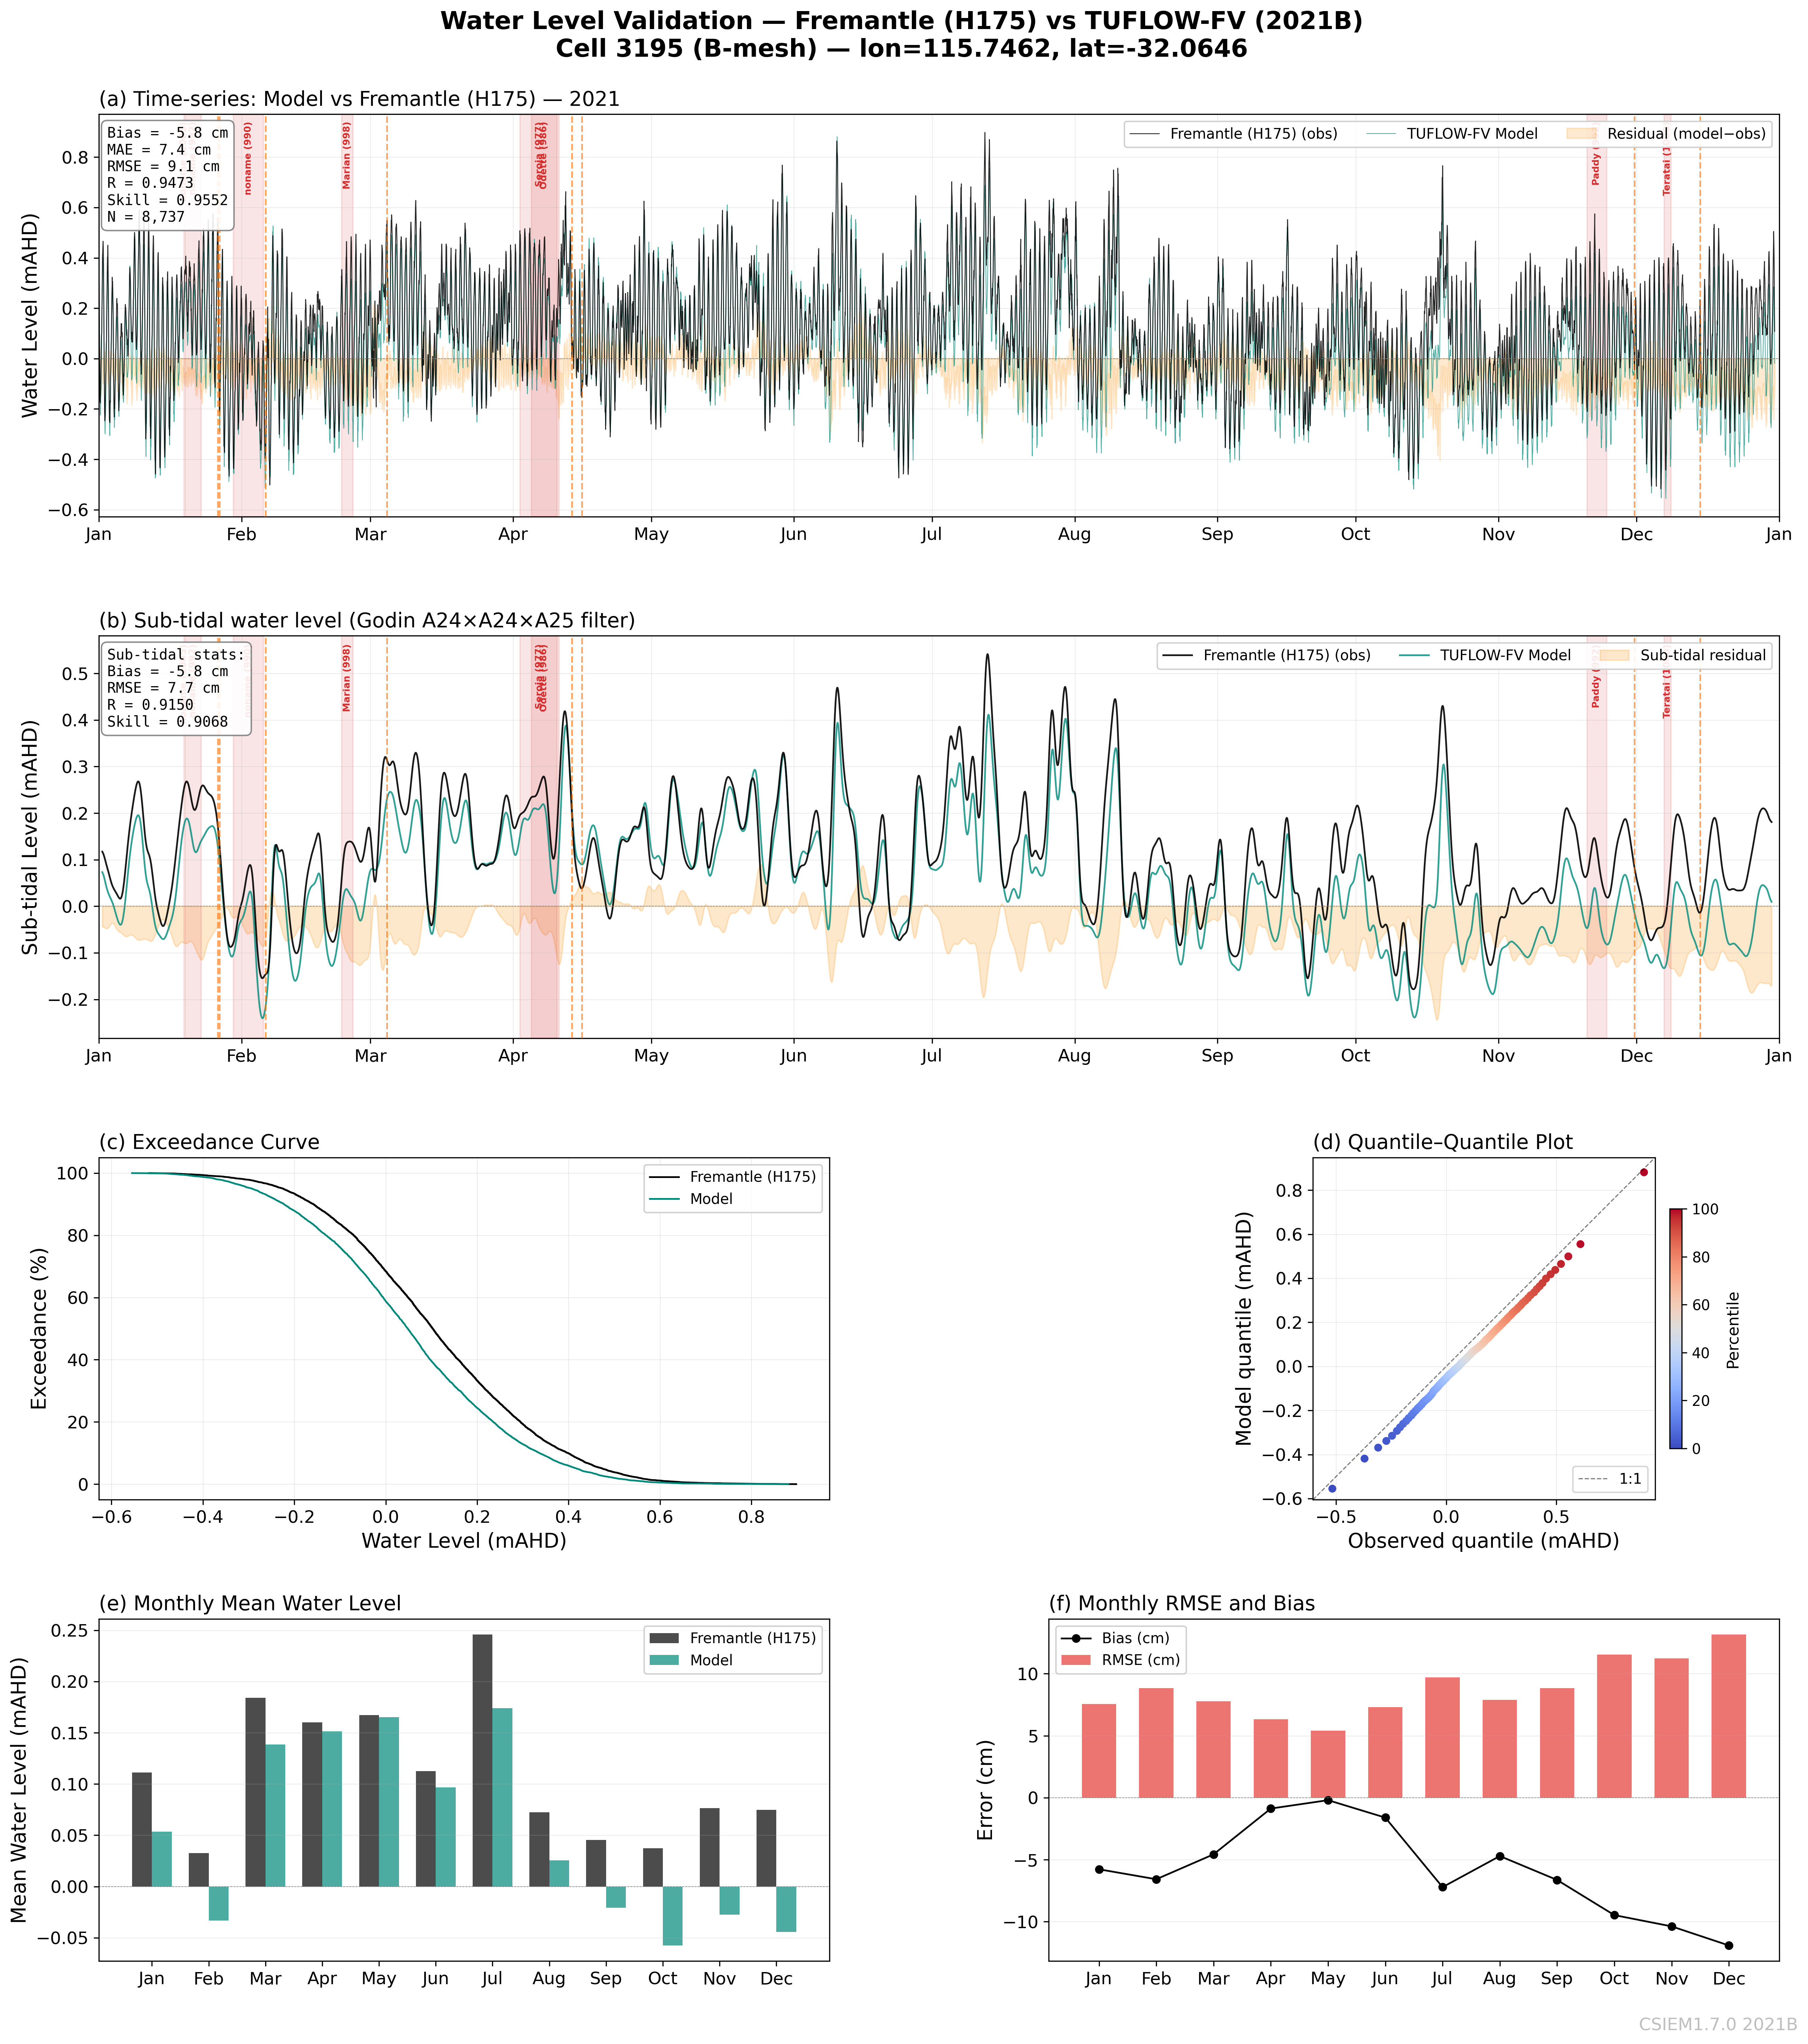
Fremantle — 2021B (B-mesh) — RMSE 9.1 cm, Skill 0.955
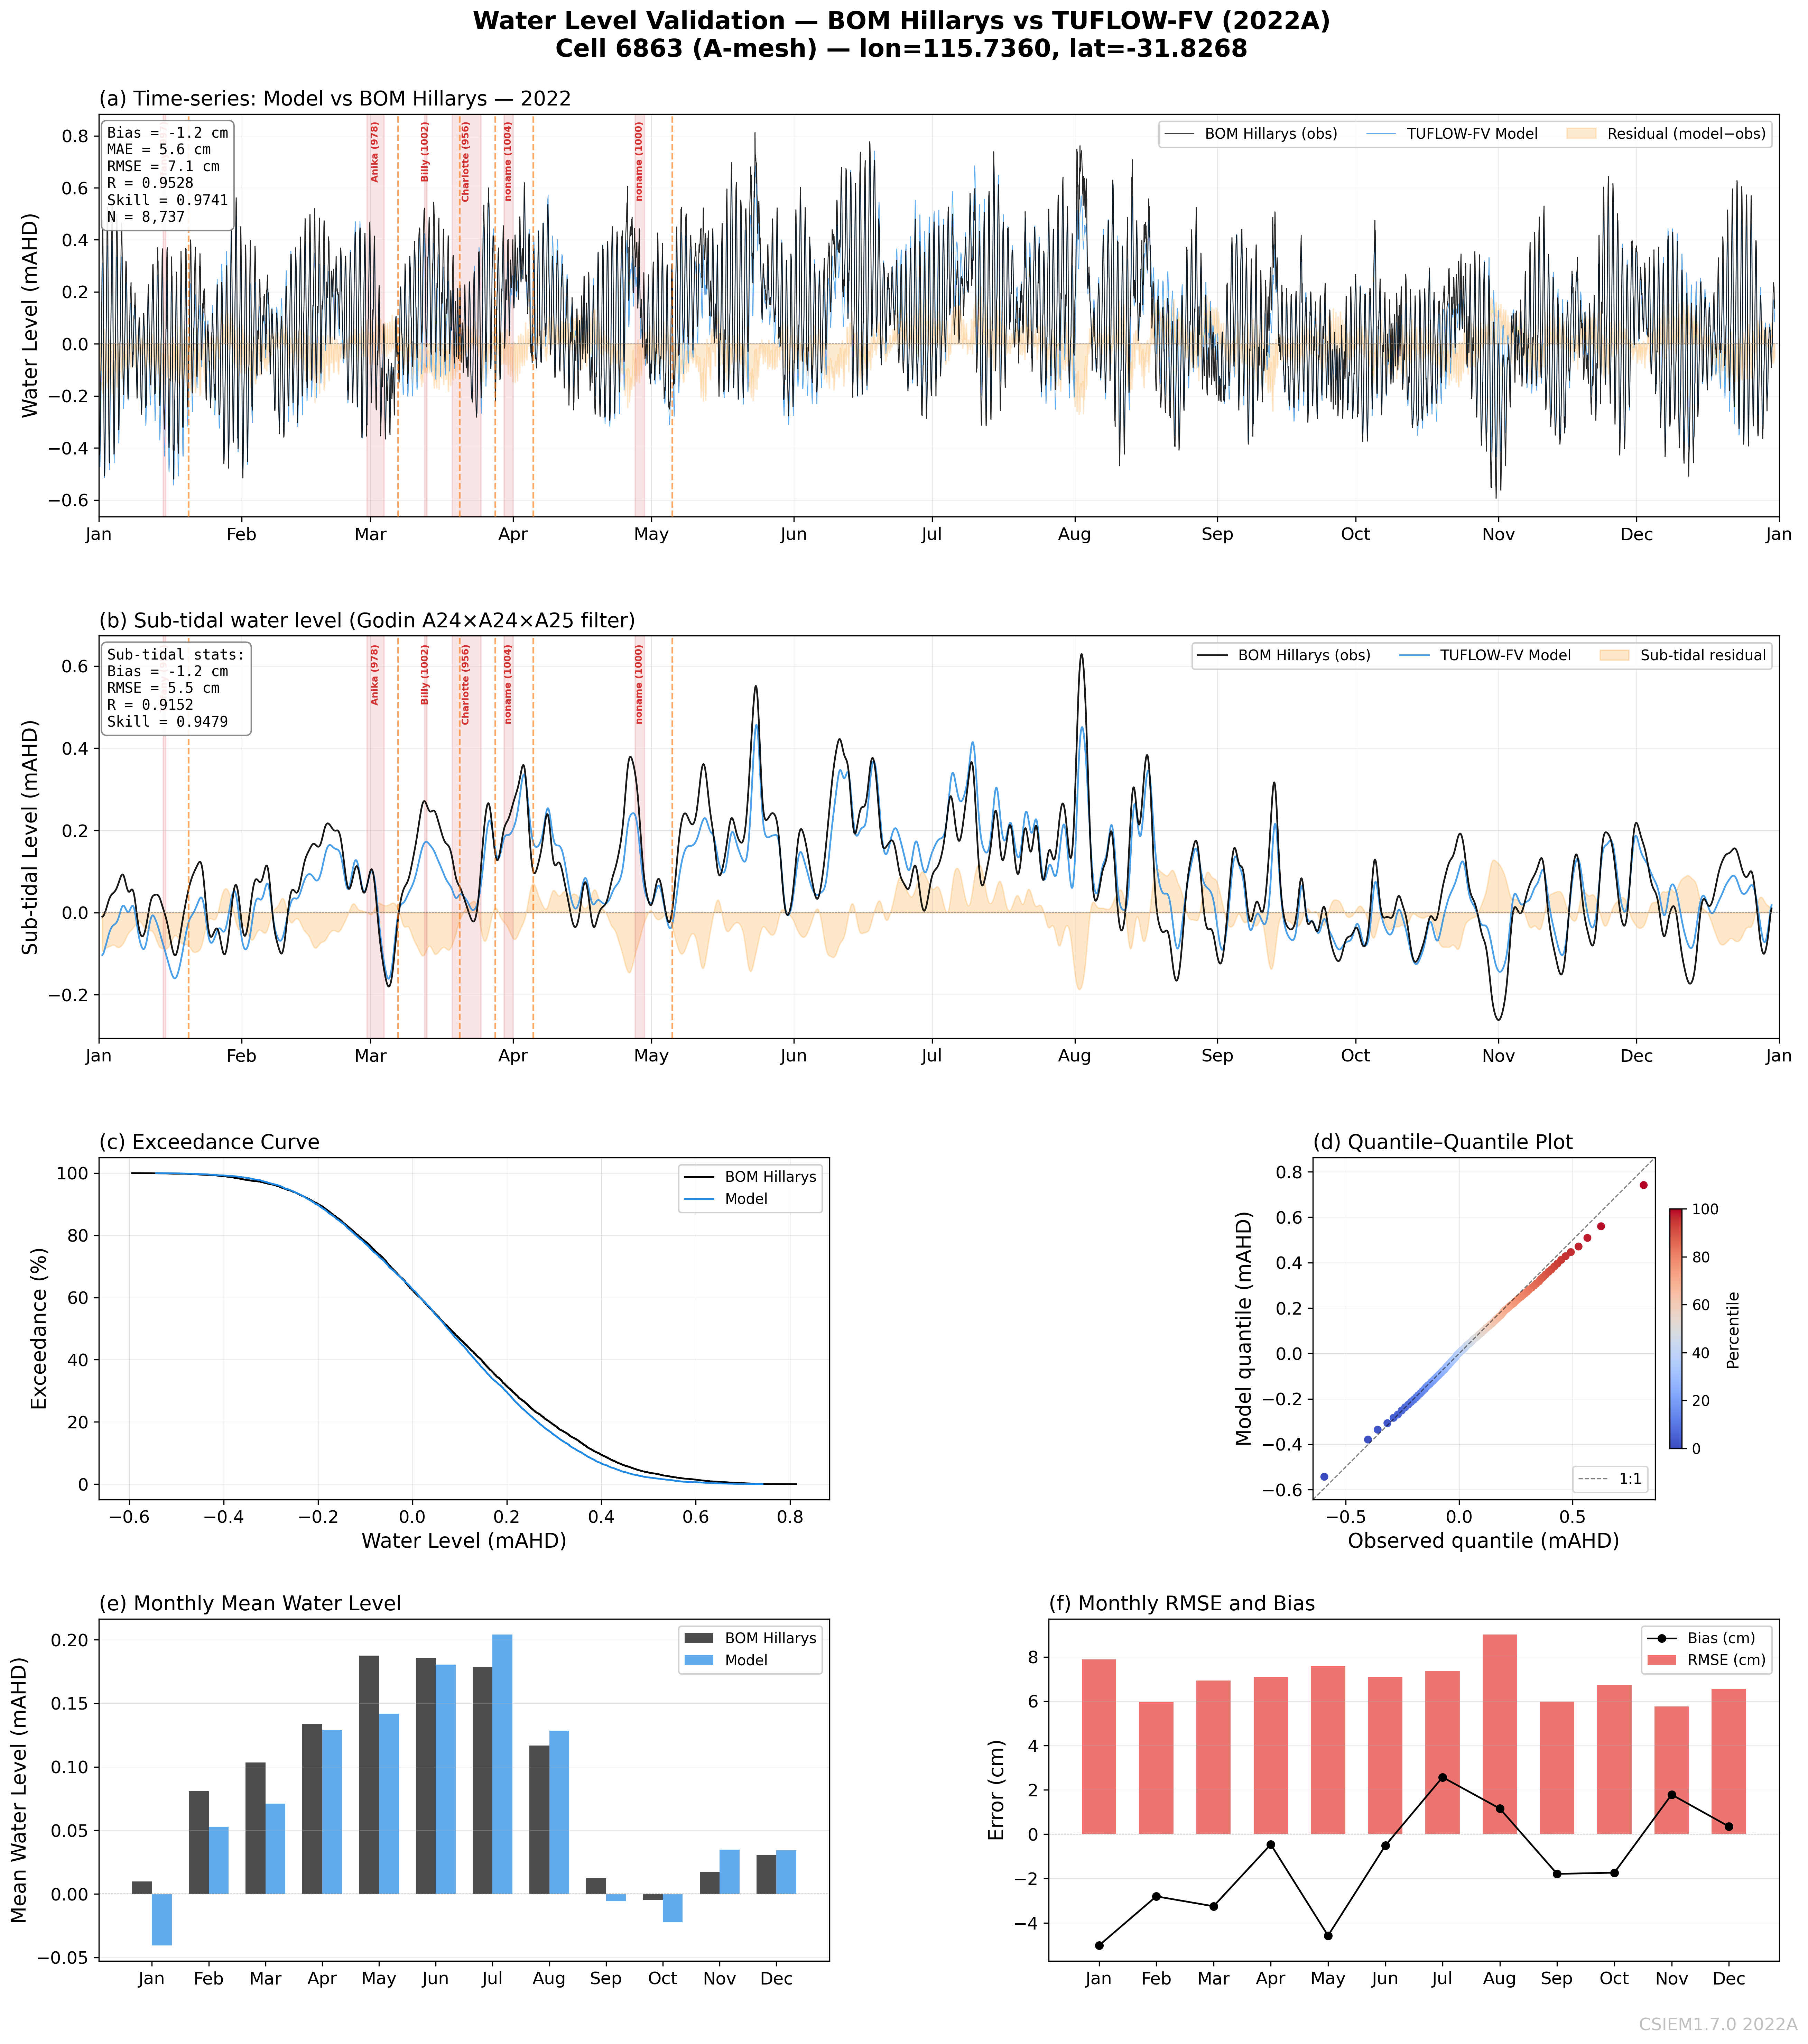
Hillarys — 2022A (A-mesh) — RMSE 7.1 cm, Skill 0.974
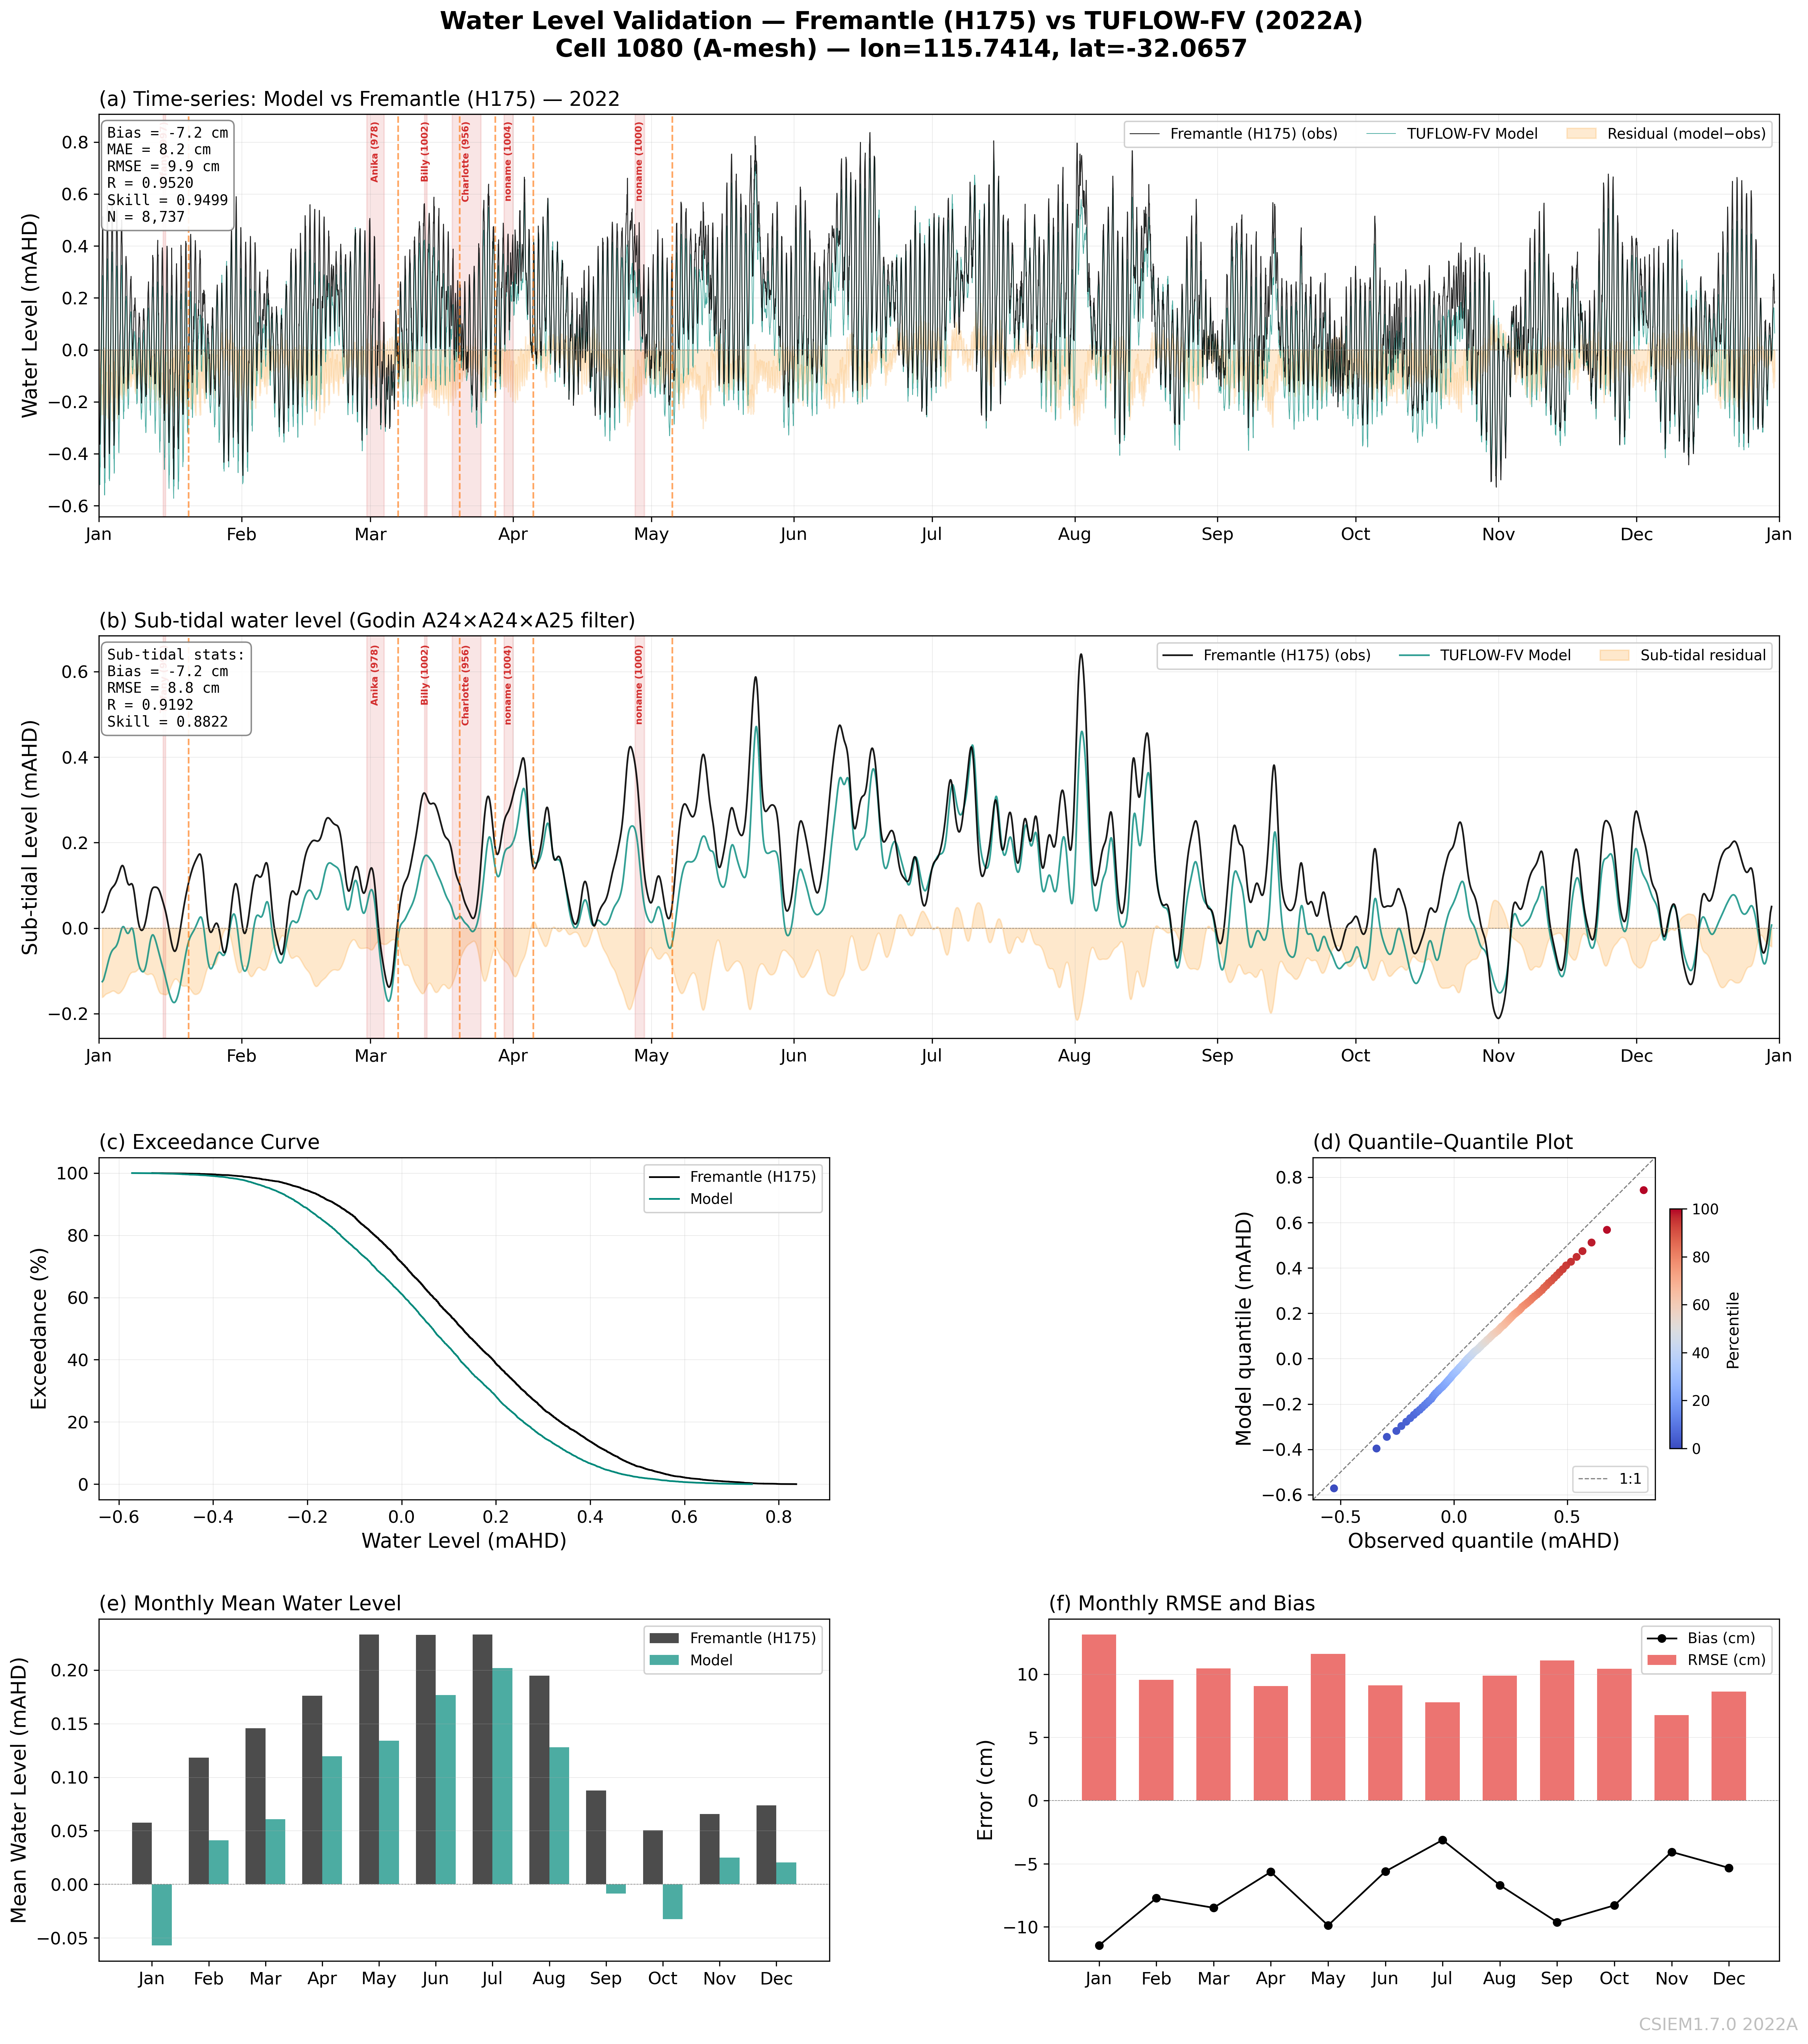
Fremantle — 2022A (A-mesh) — RMSE 9.9 cm, Skill 0.950
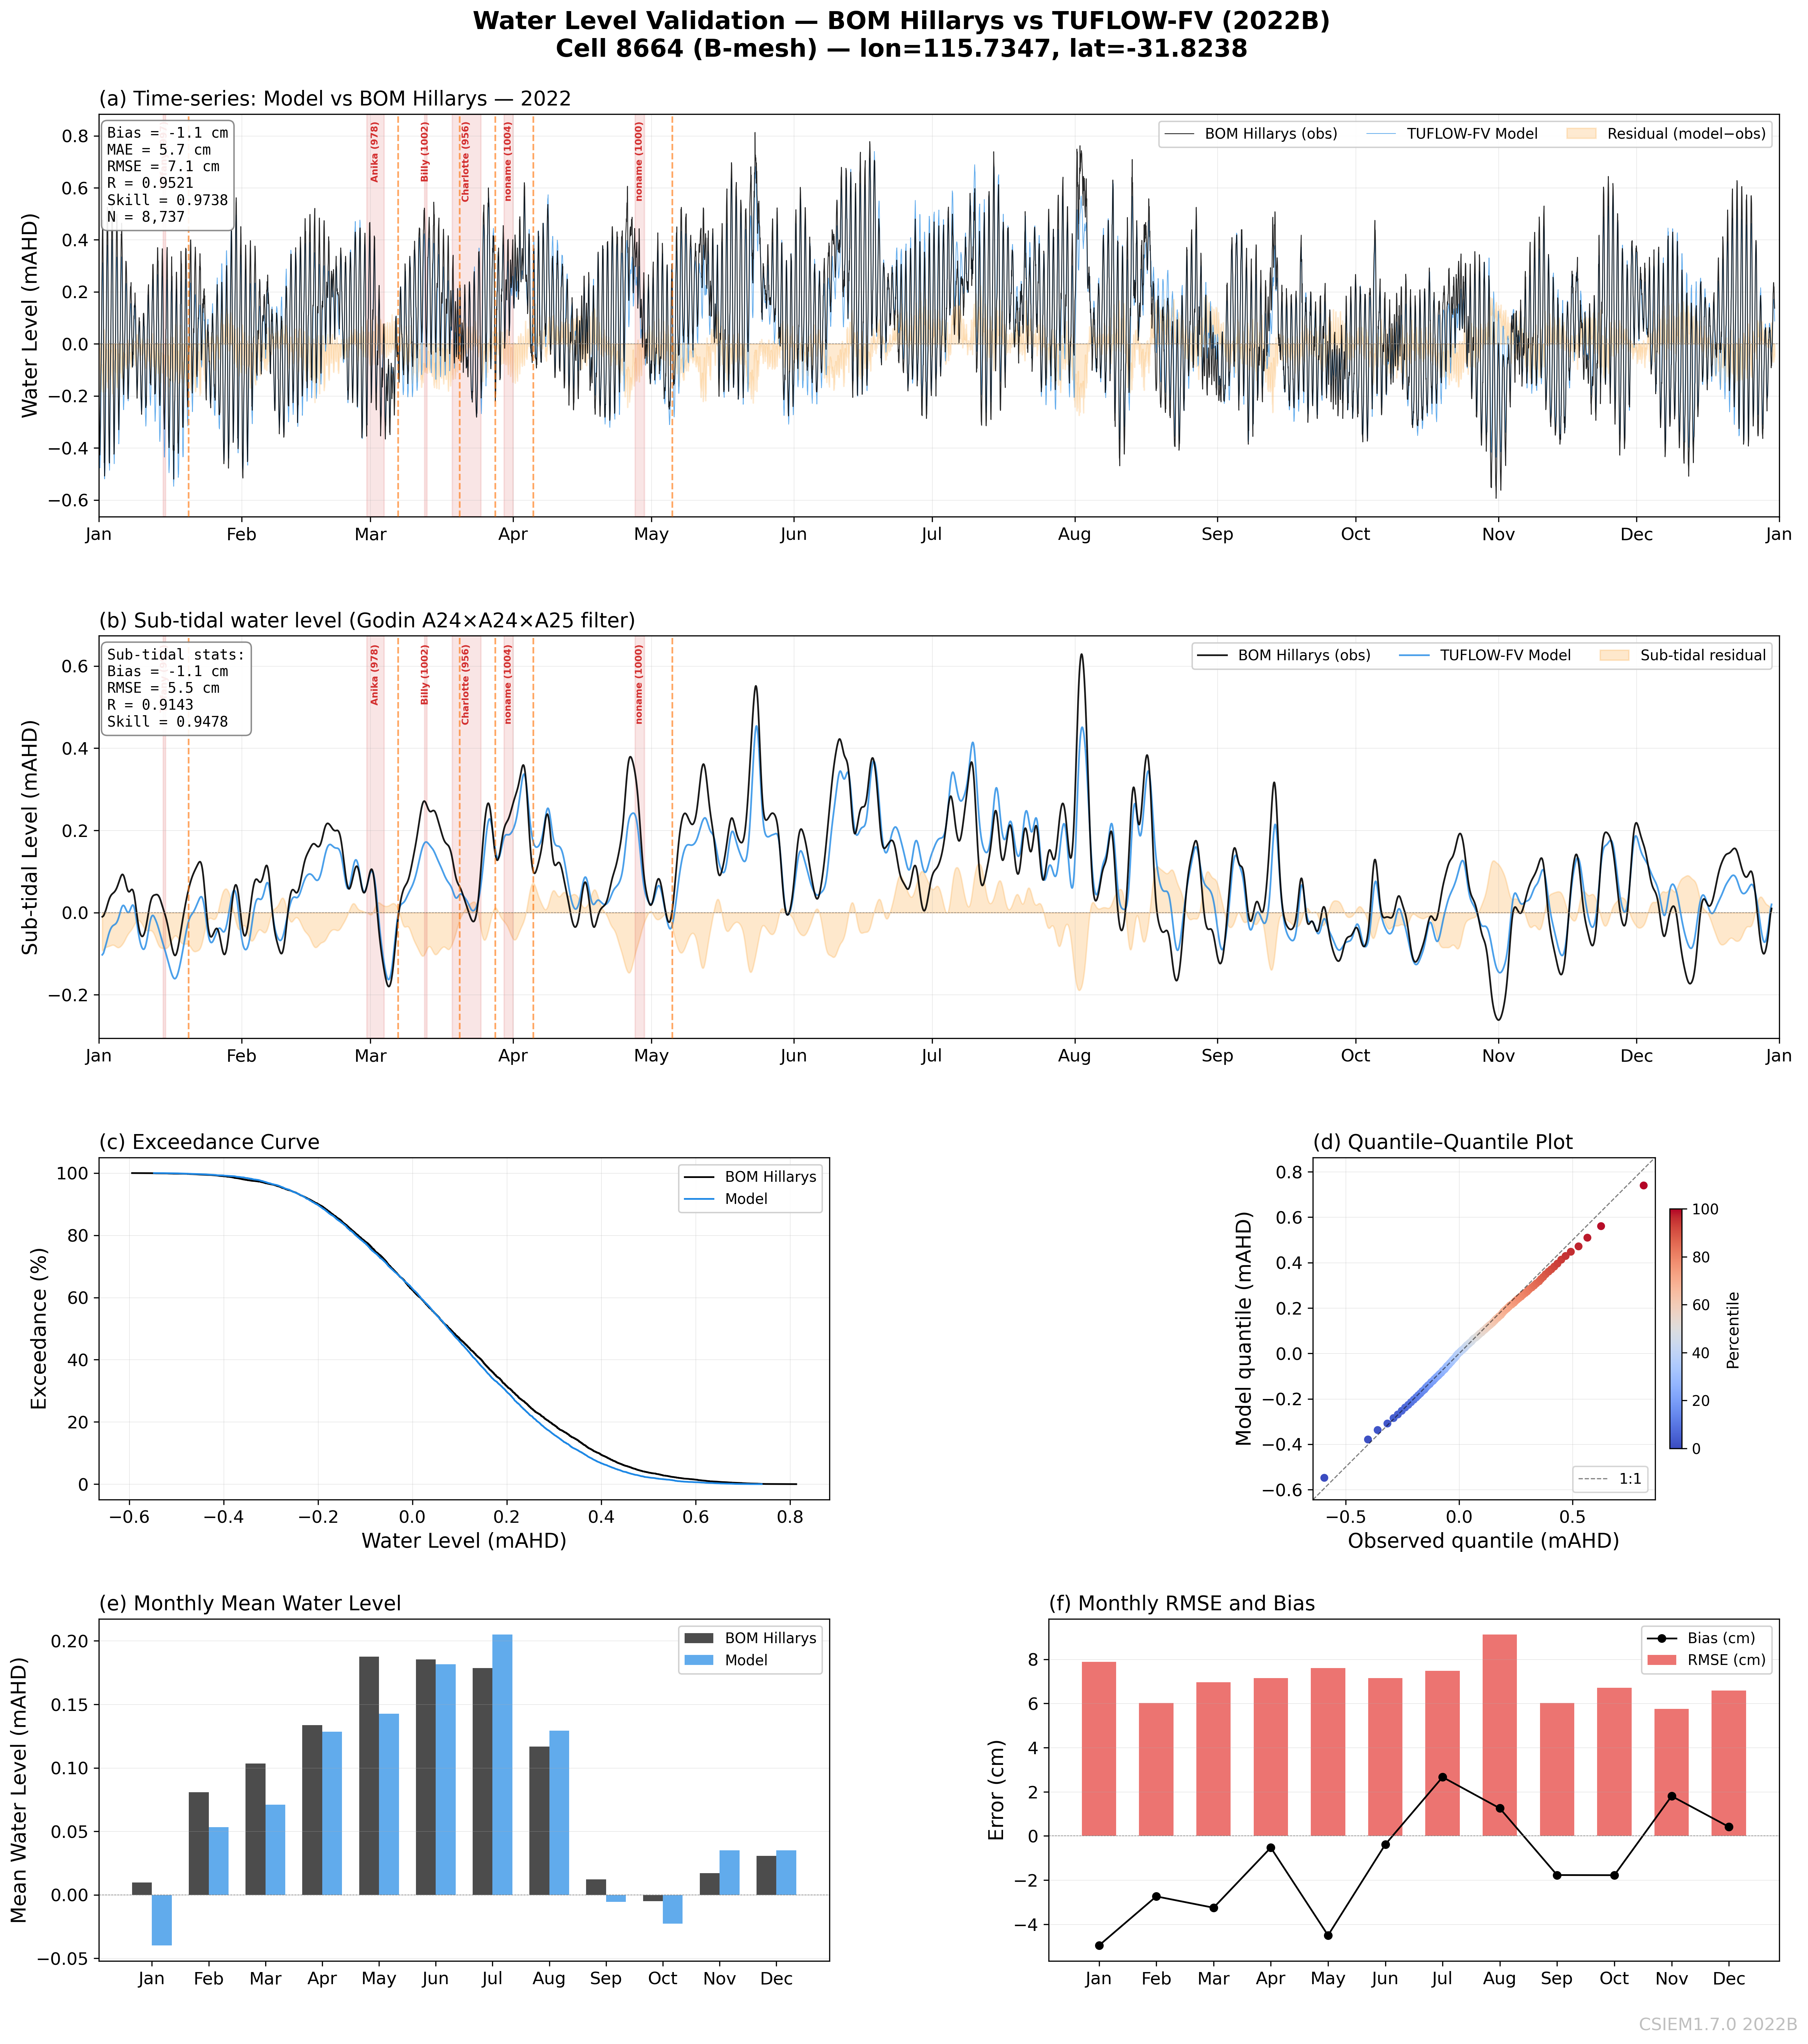
Hillarys — 2022B (B-mesh) — RMSE 7.1 cm, Skill 0.974
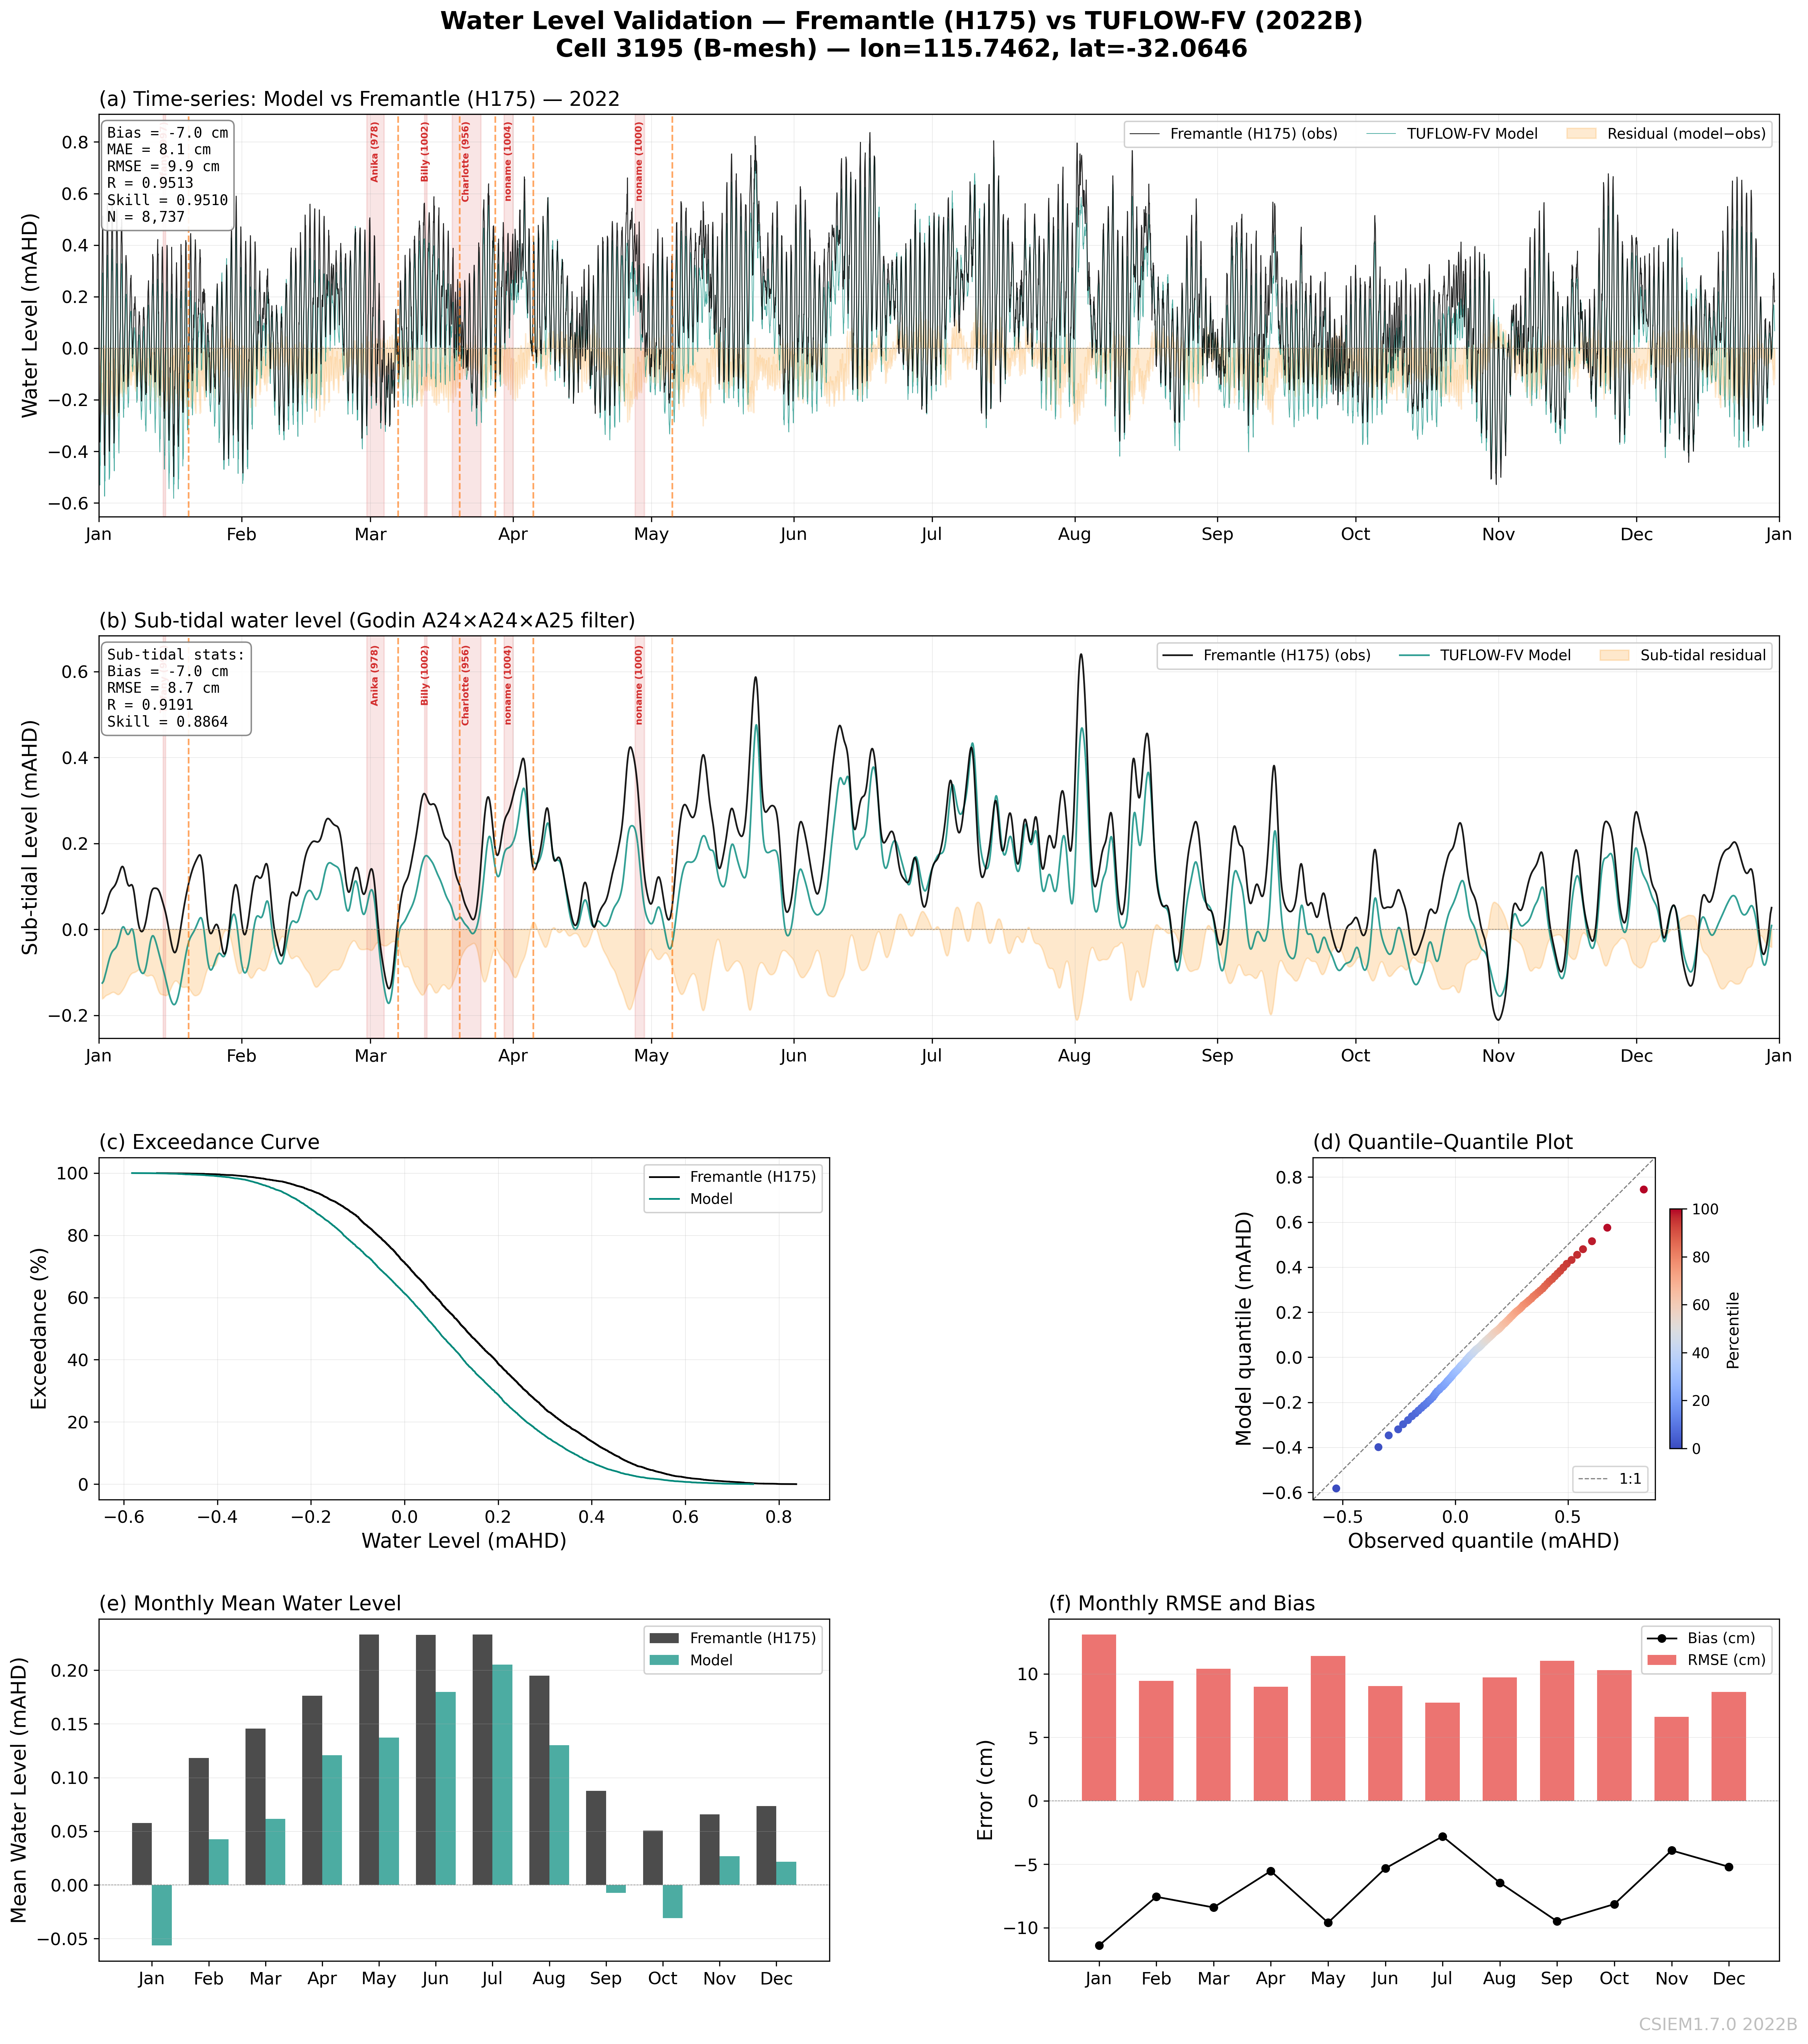
Fremantle — 2022B (B-mesh) — RMSE 9.9 cm, Skill 0.951
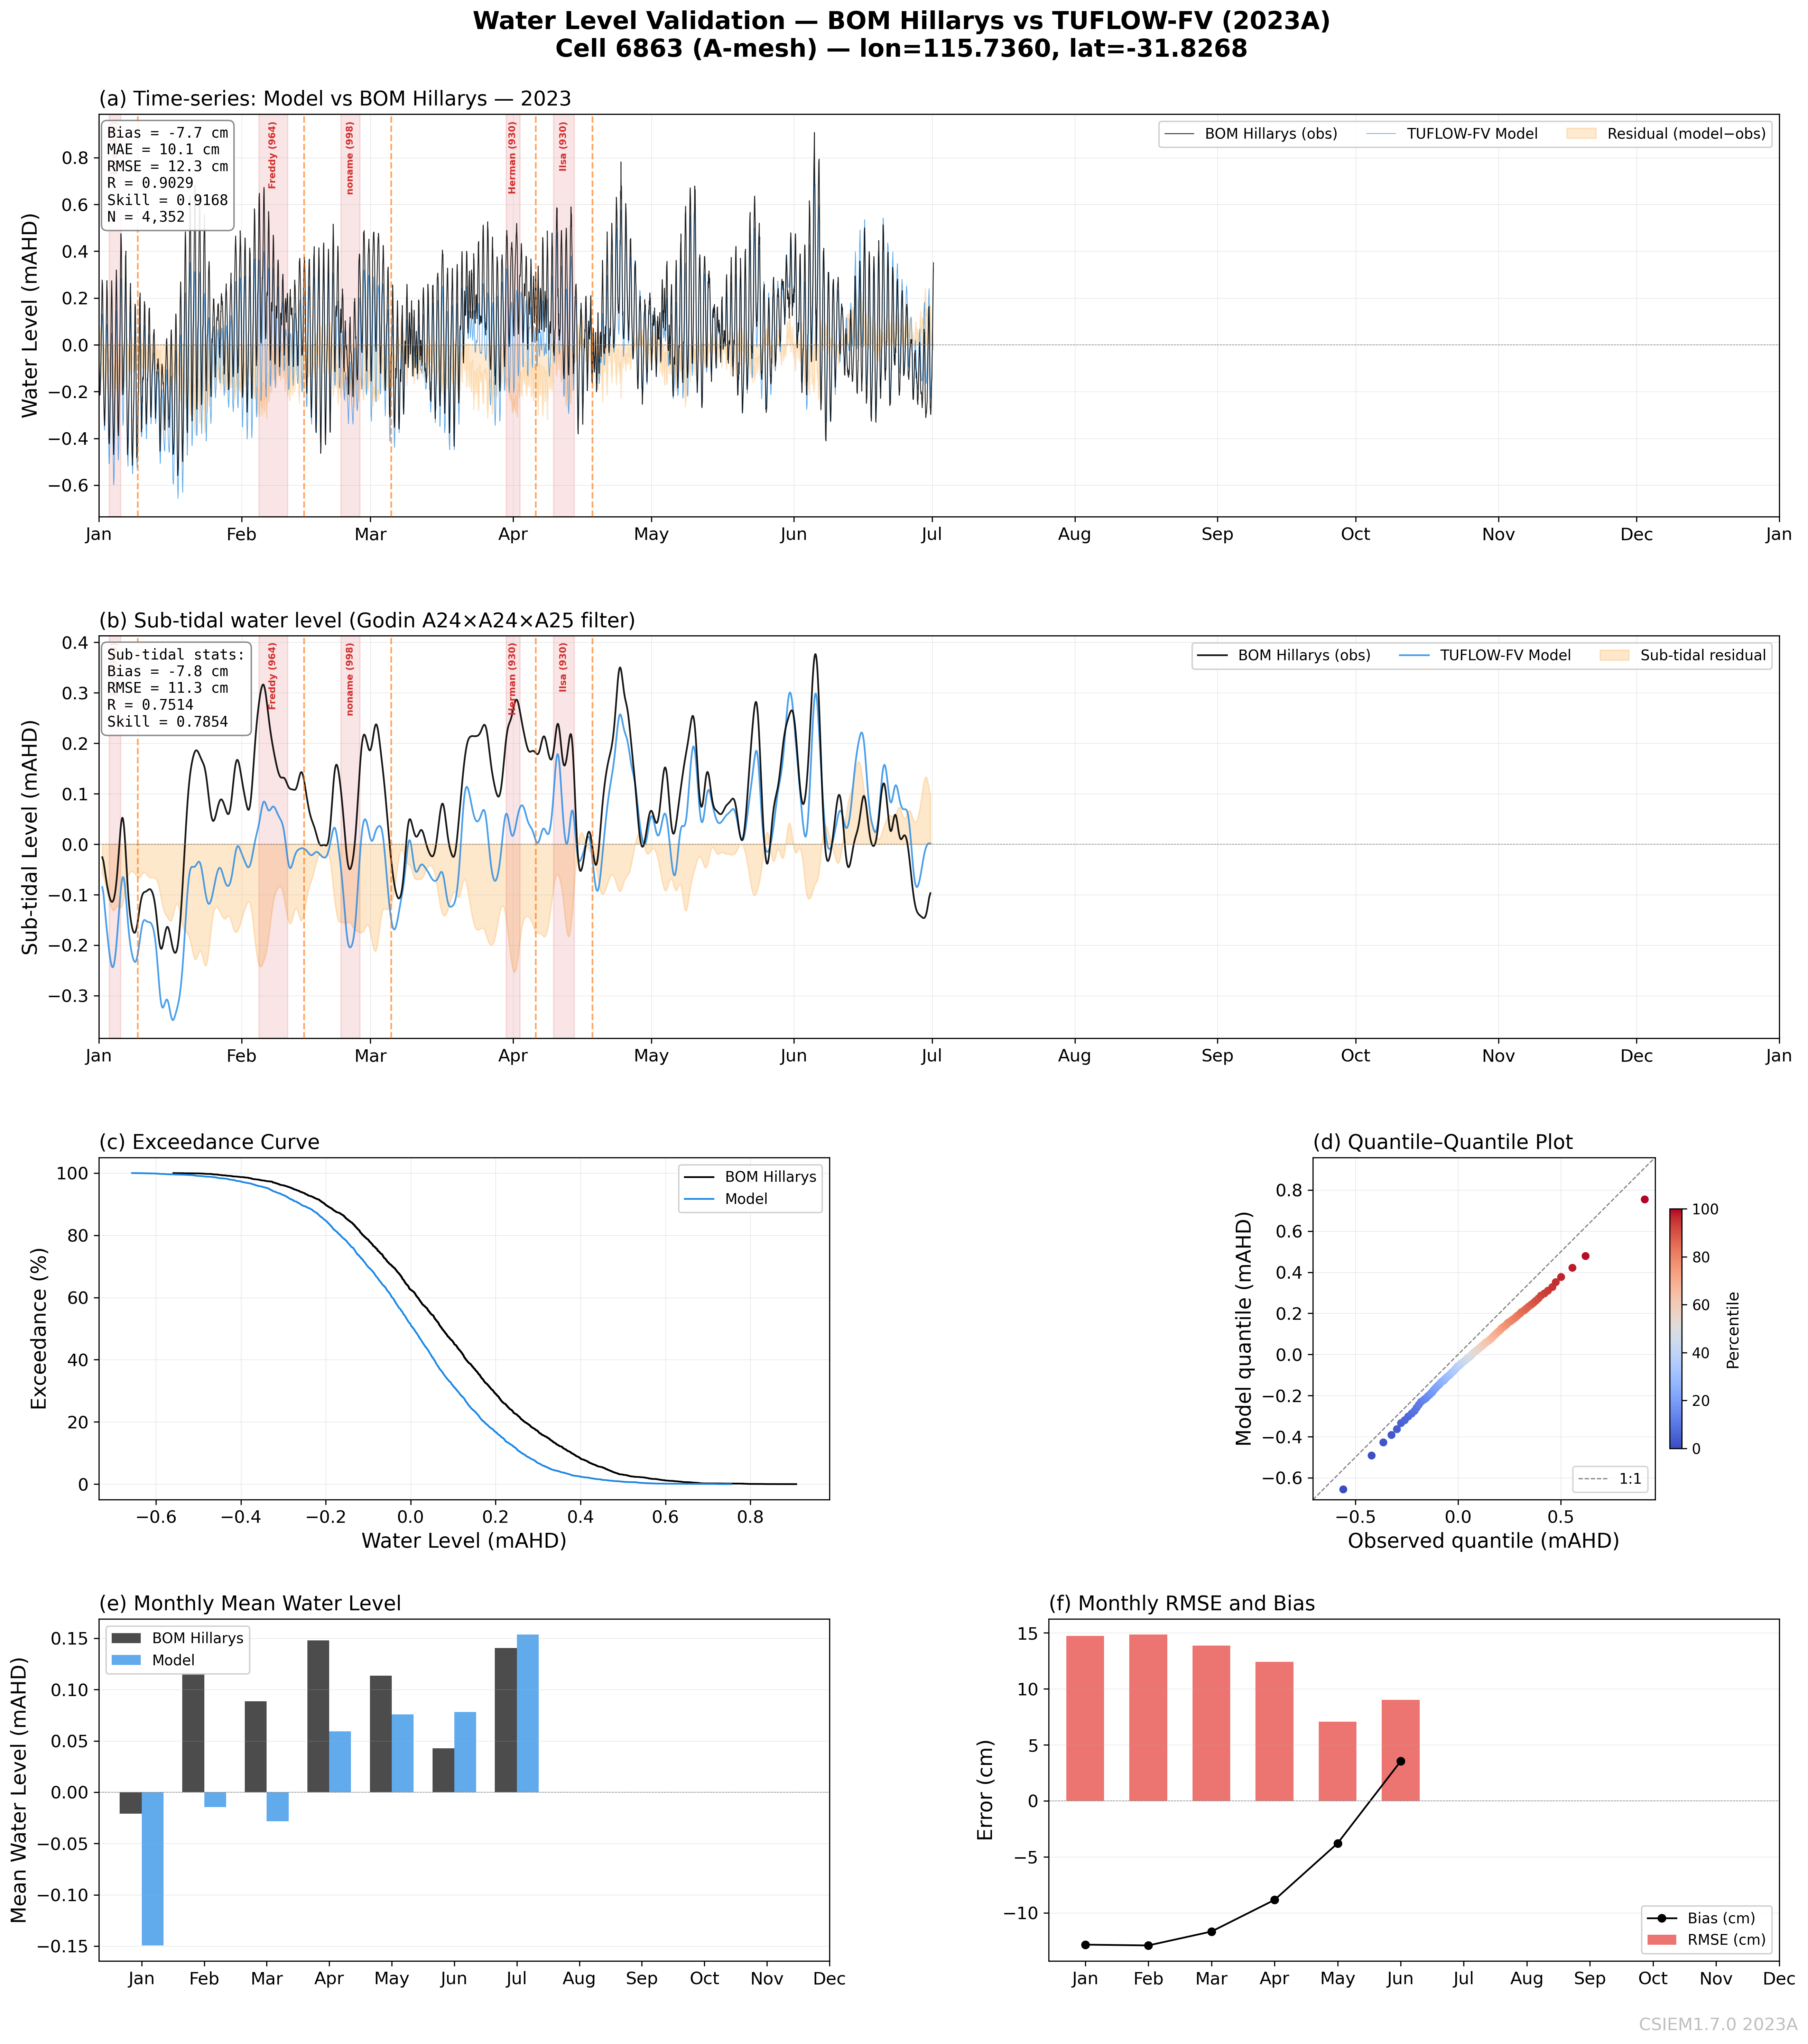
Hillarys — 2023A (A-mesh) — RMSE 12.3 cm, Skill 0.917
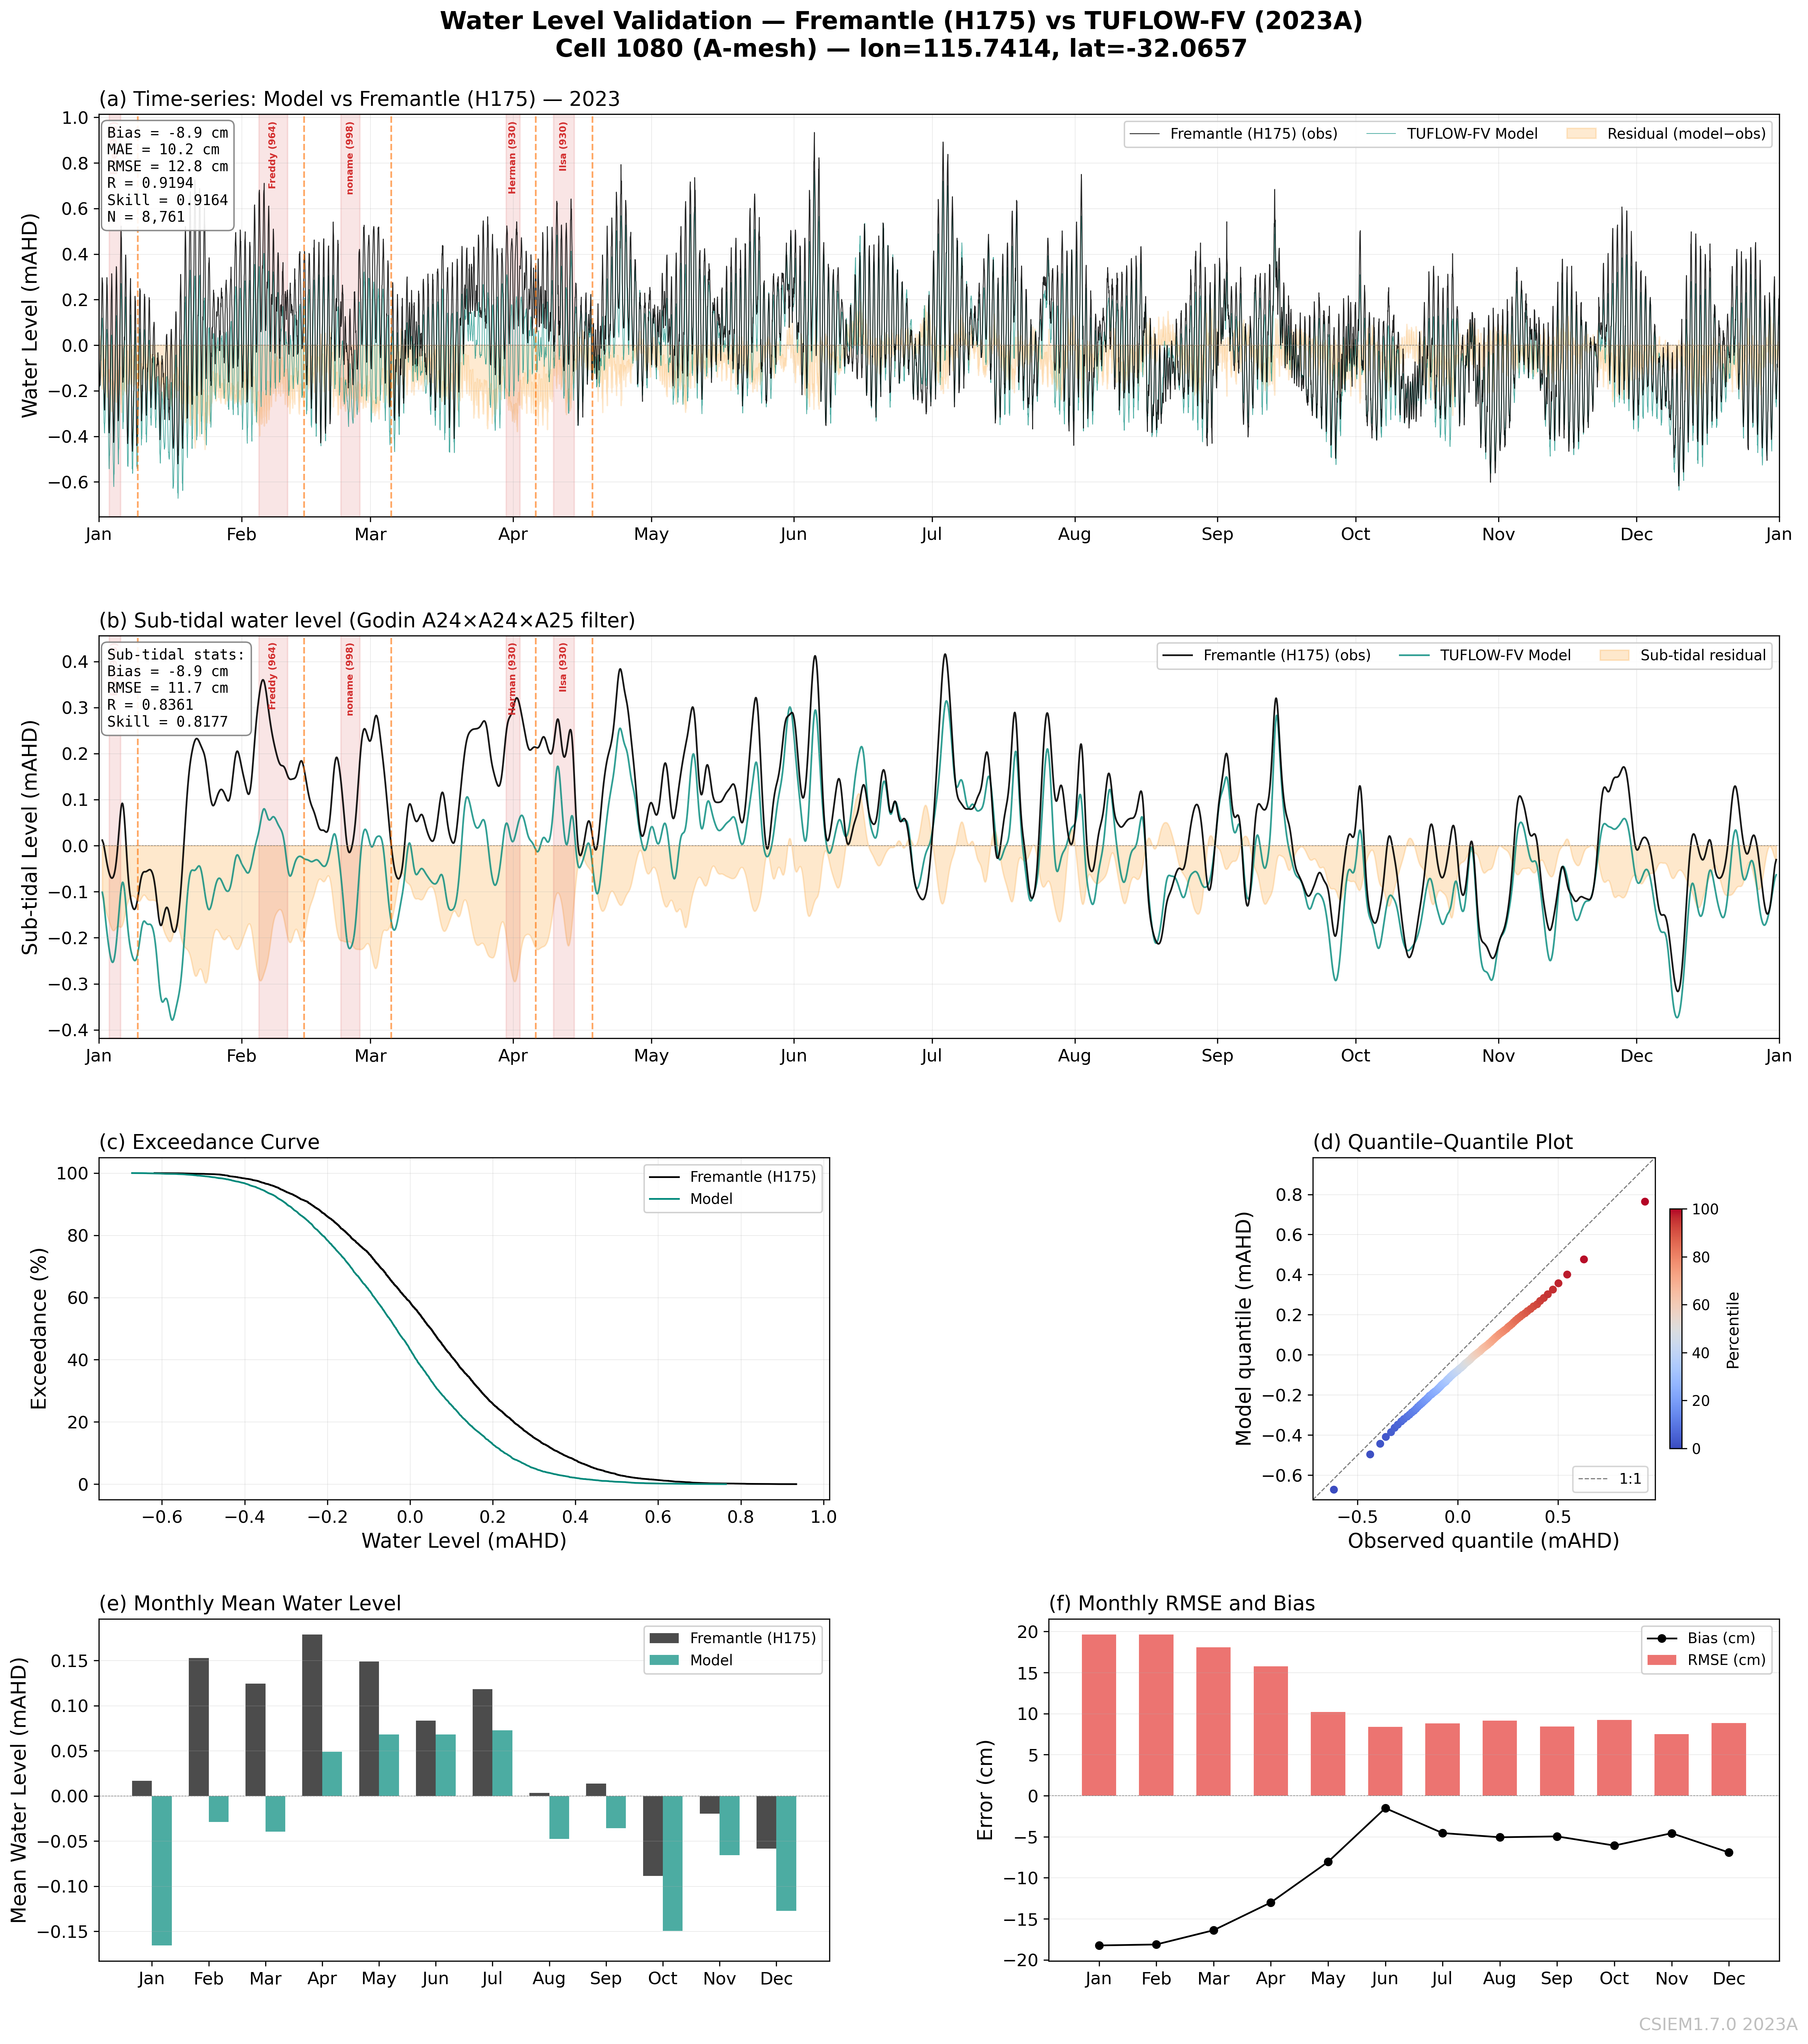
Fremantle — 2023A (A-mesh) — RMSE 12.8 cm, Skill 0.916
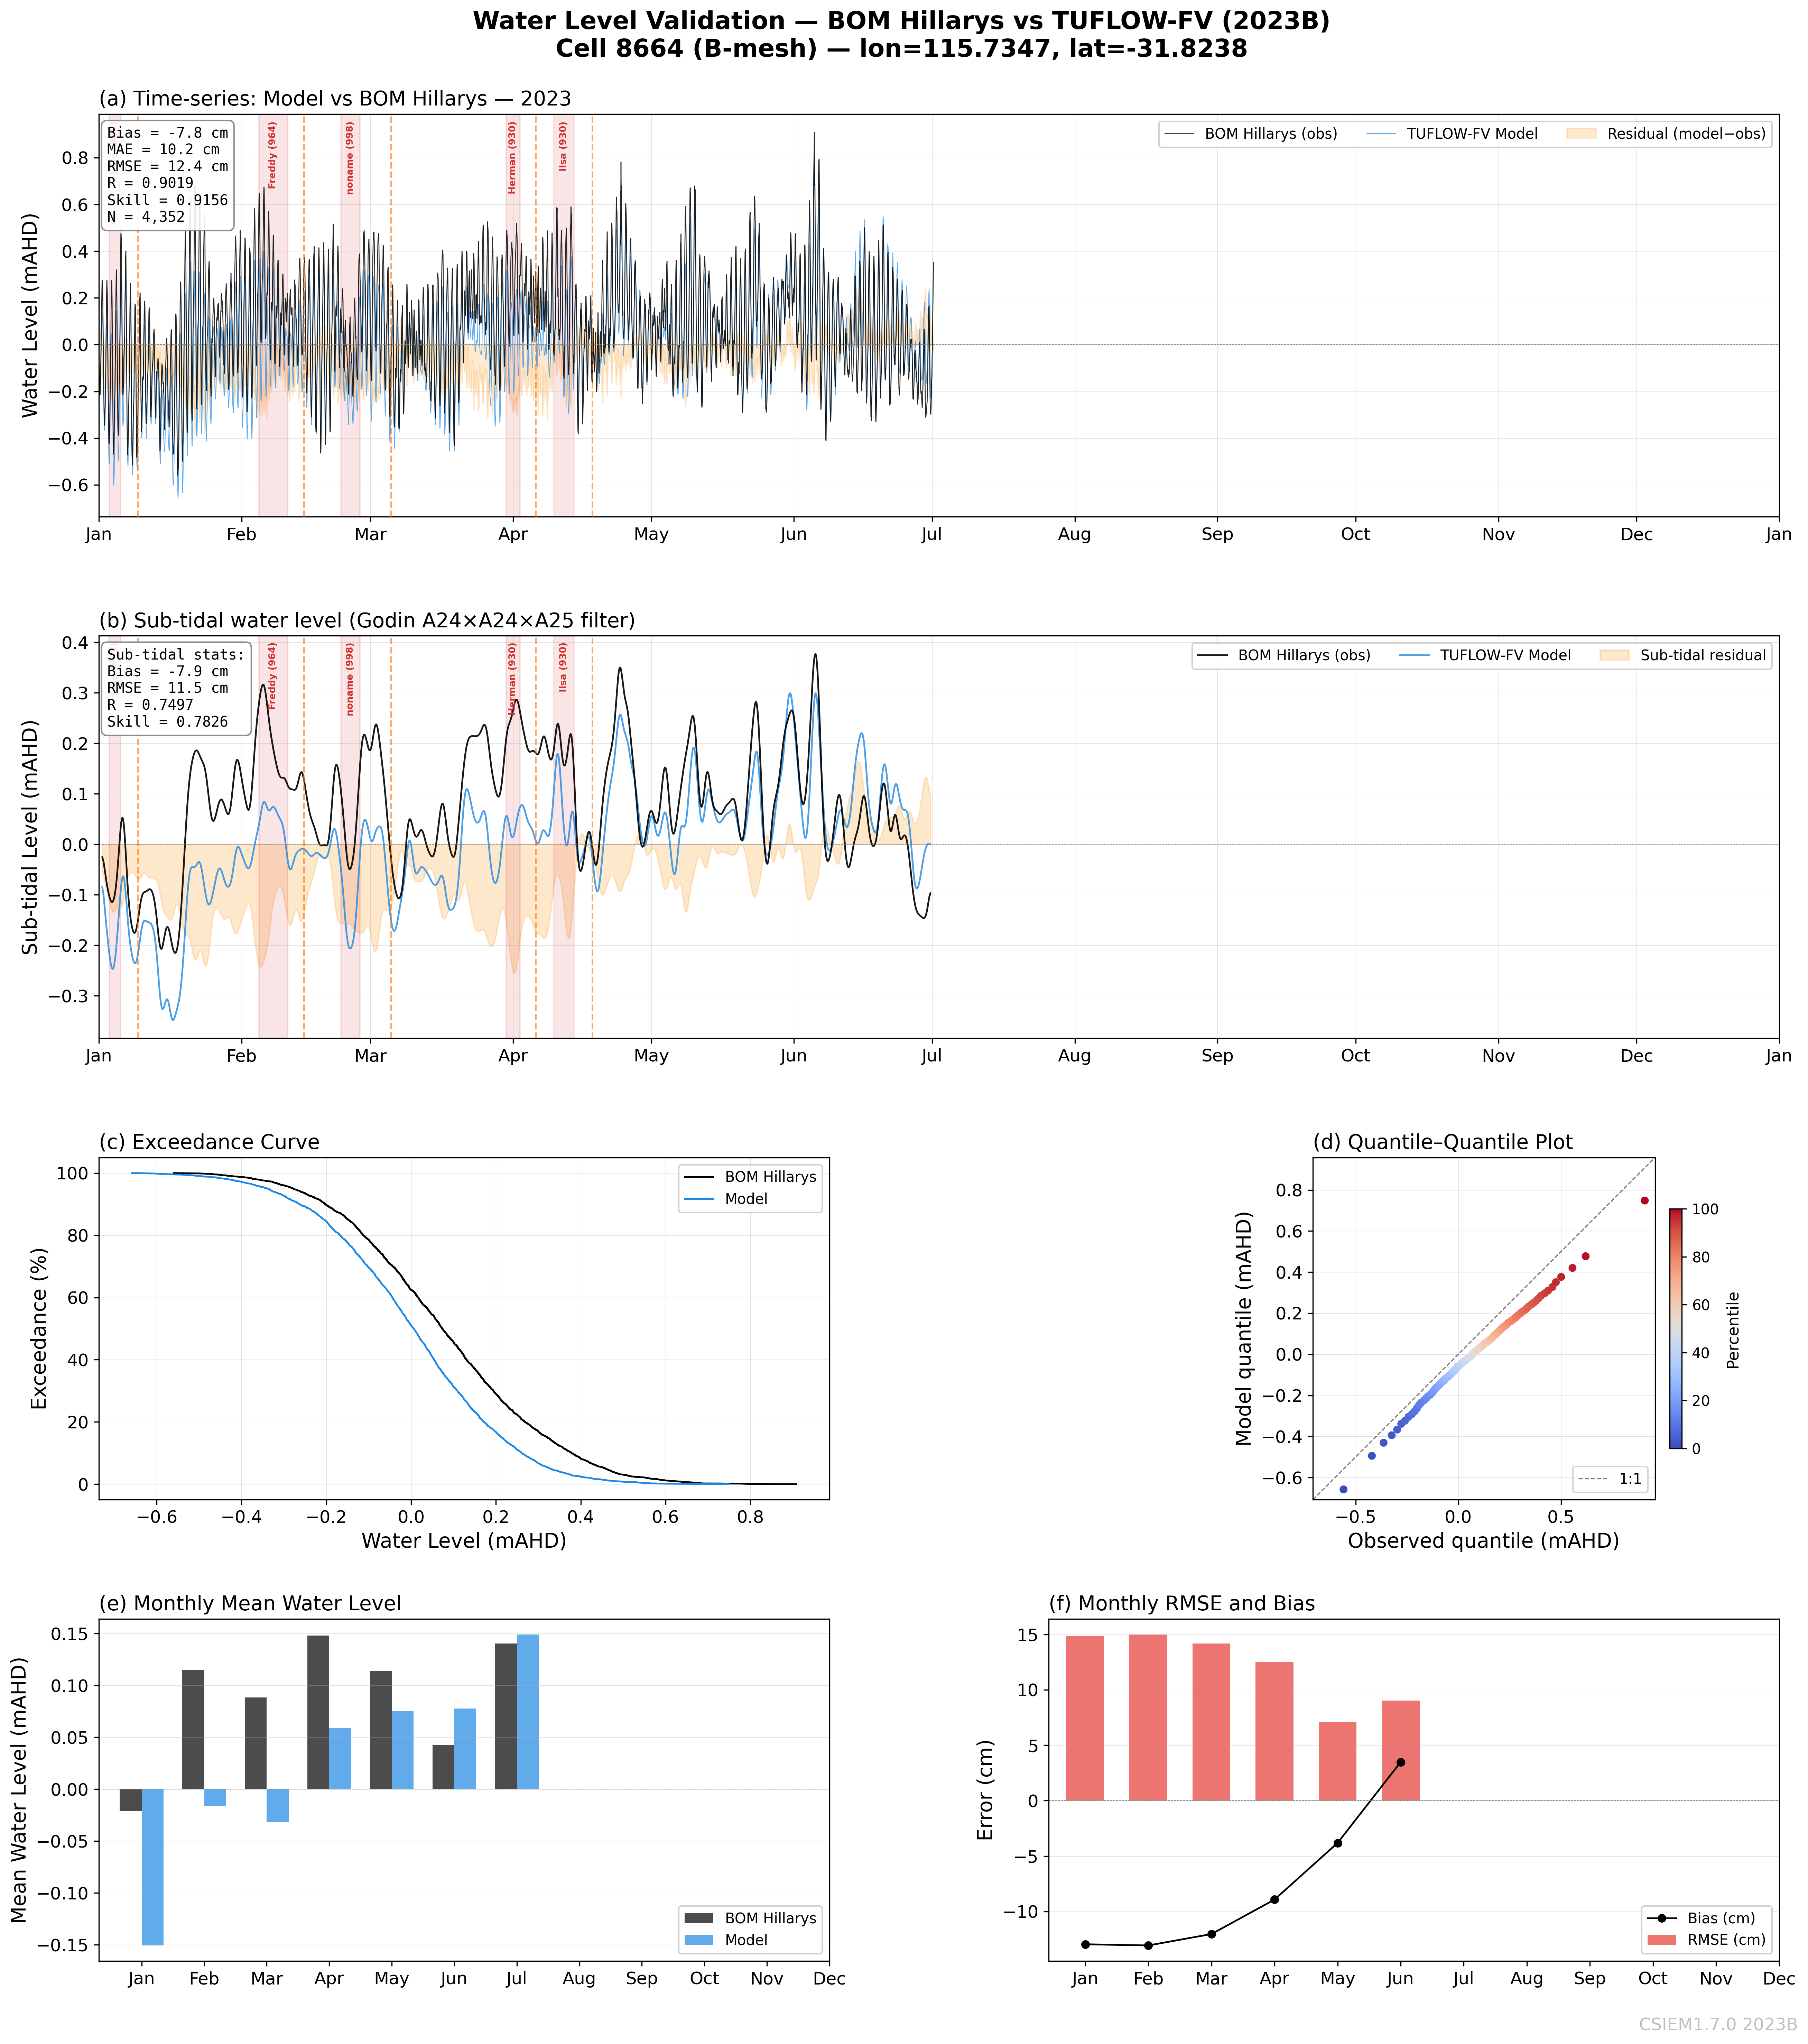
Hillarys — 2023B (B-mesh) — RMSE 12.4 cm, Skill 0.916
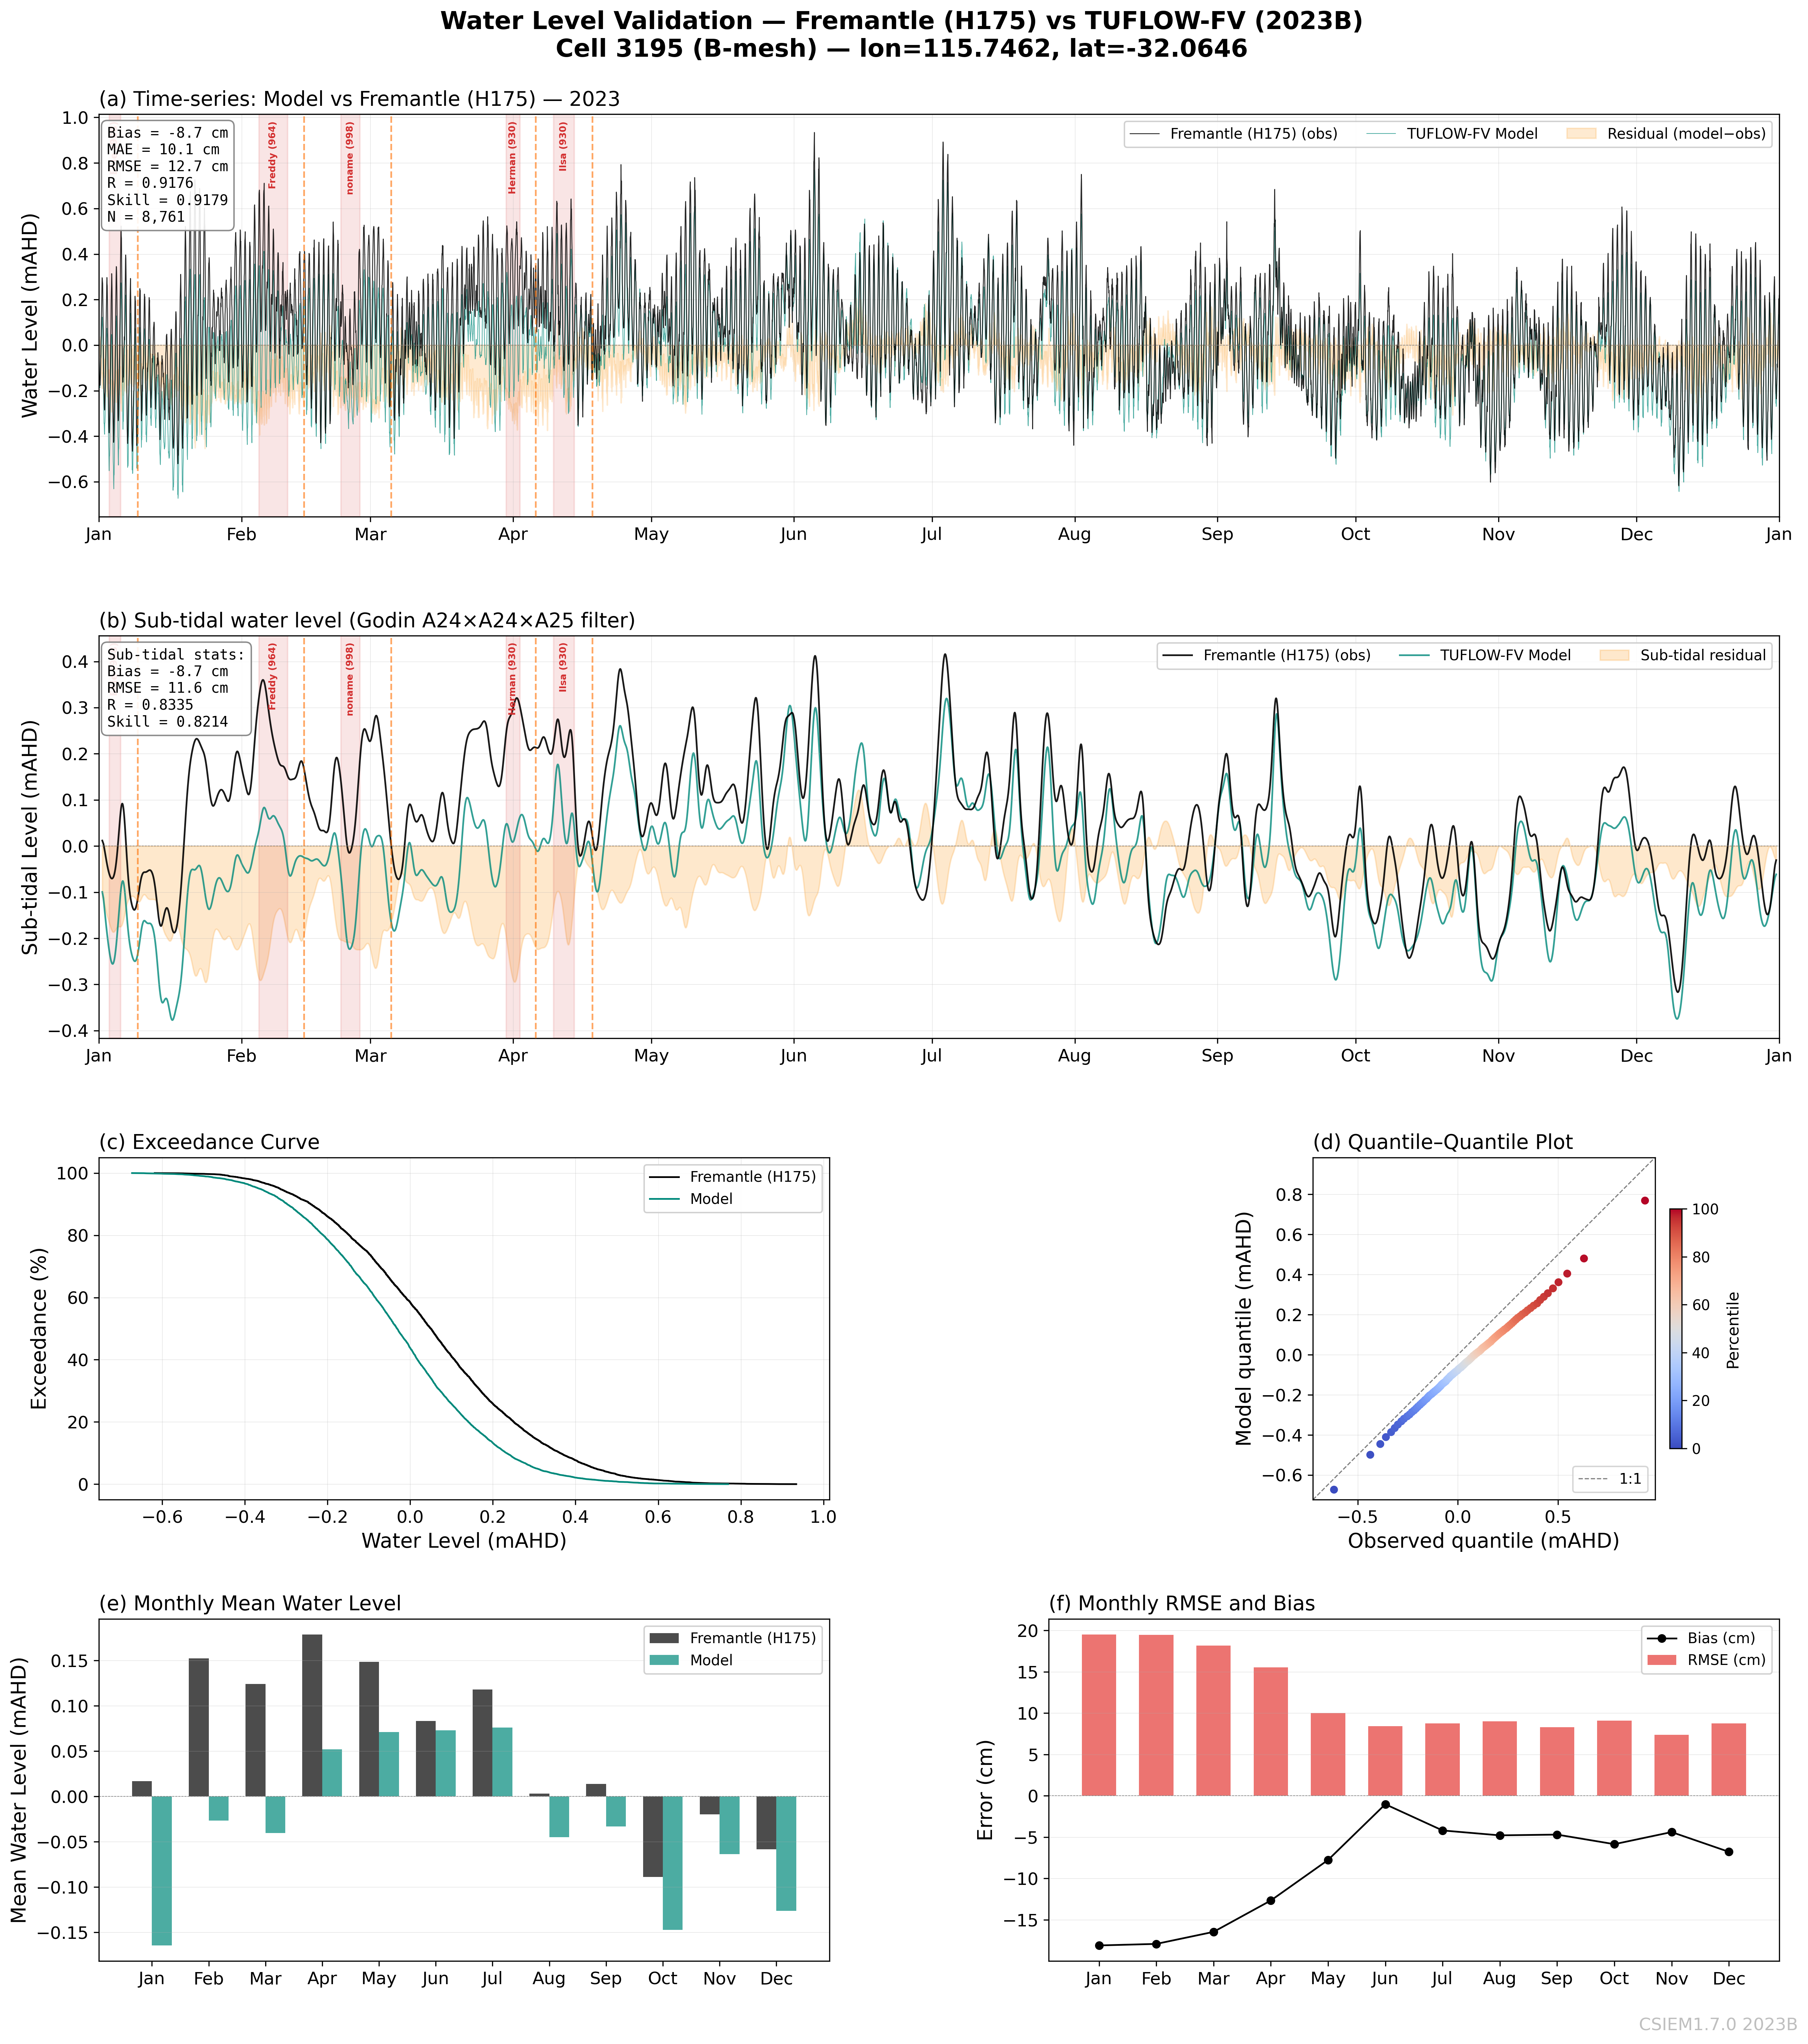
Fremantle — 2023B (B-mesh) — RMSE 12.7 cm, Skill 0.918
Annual Validation Plots
Per-year sub-tidal water level at Hillarys and Fremantle, annotated with tropical cyclone active periods and estimated CSW arrival times.
2013
2020
2021
2022
2023
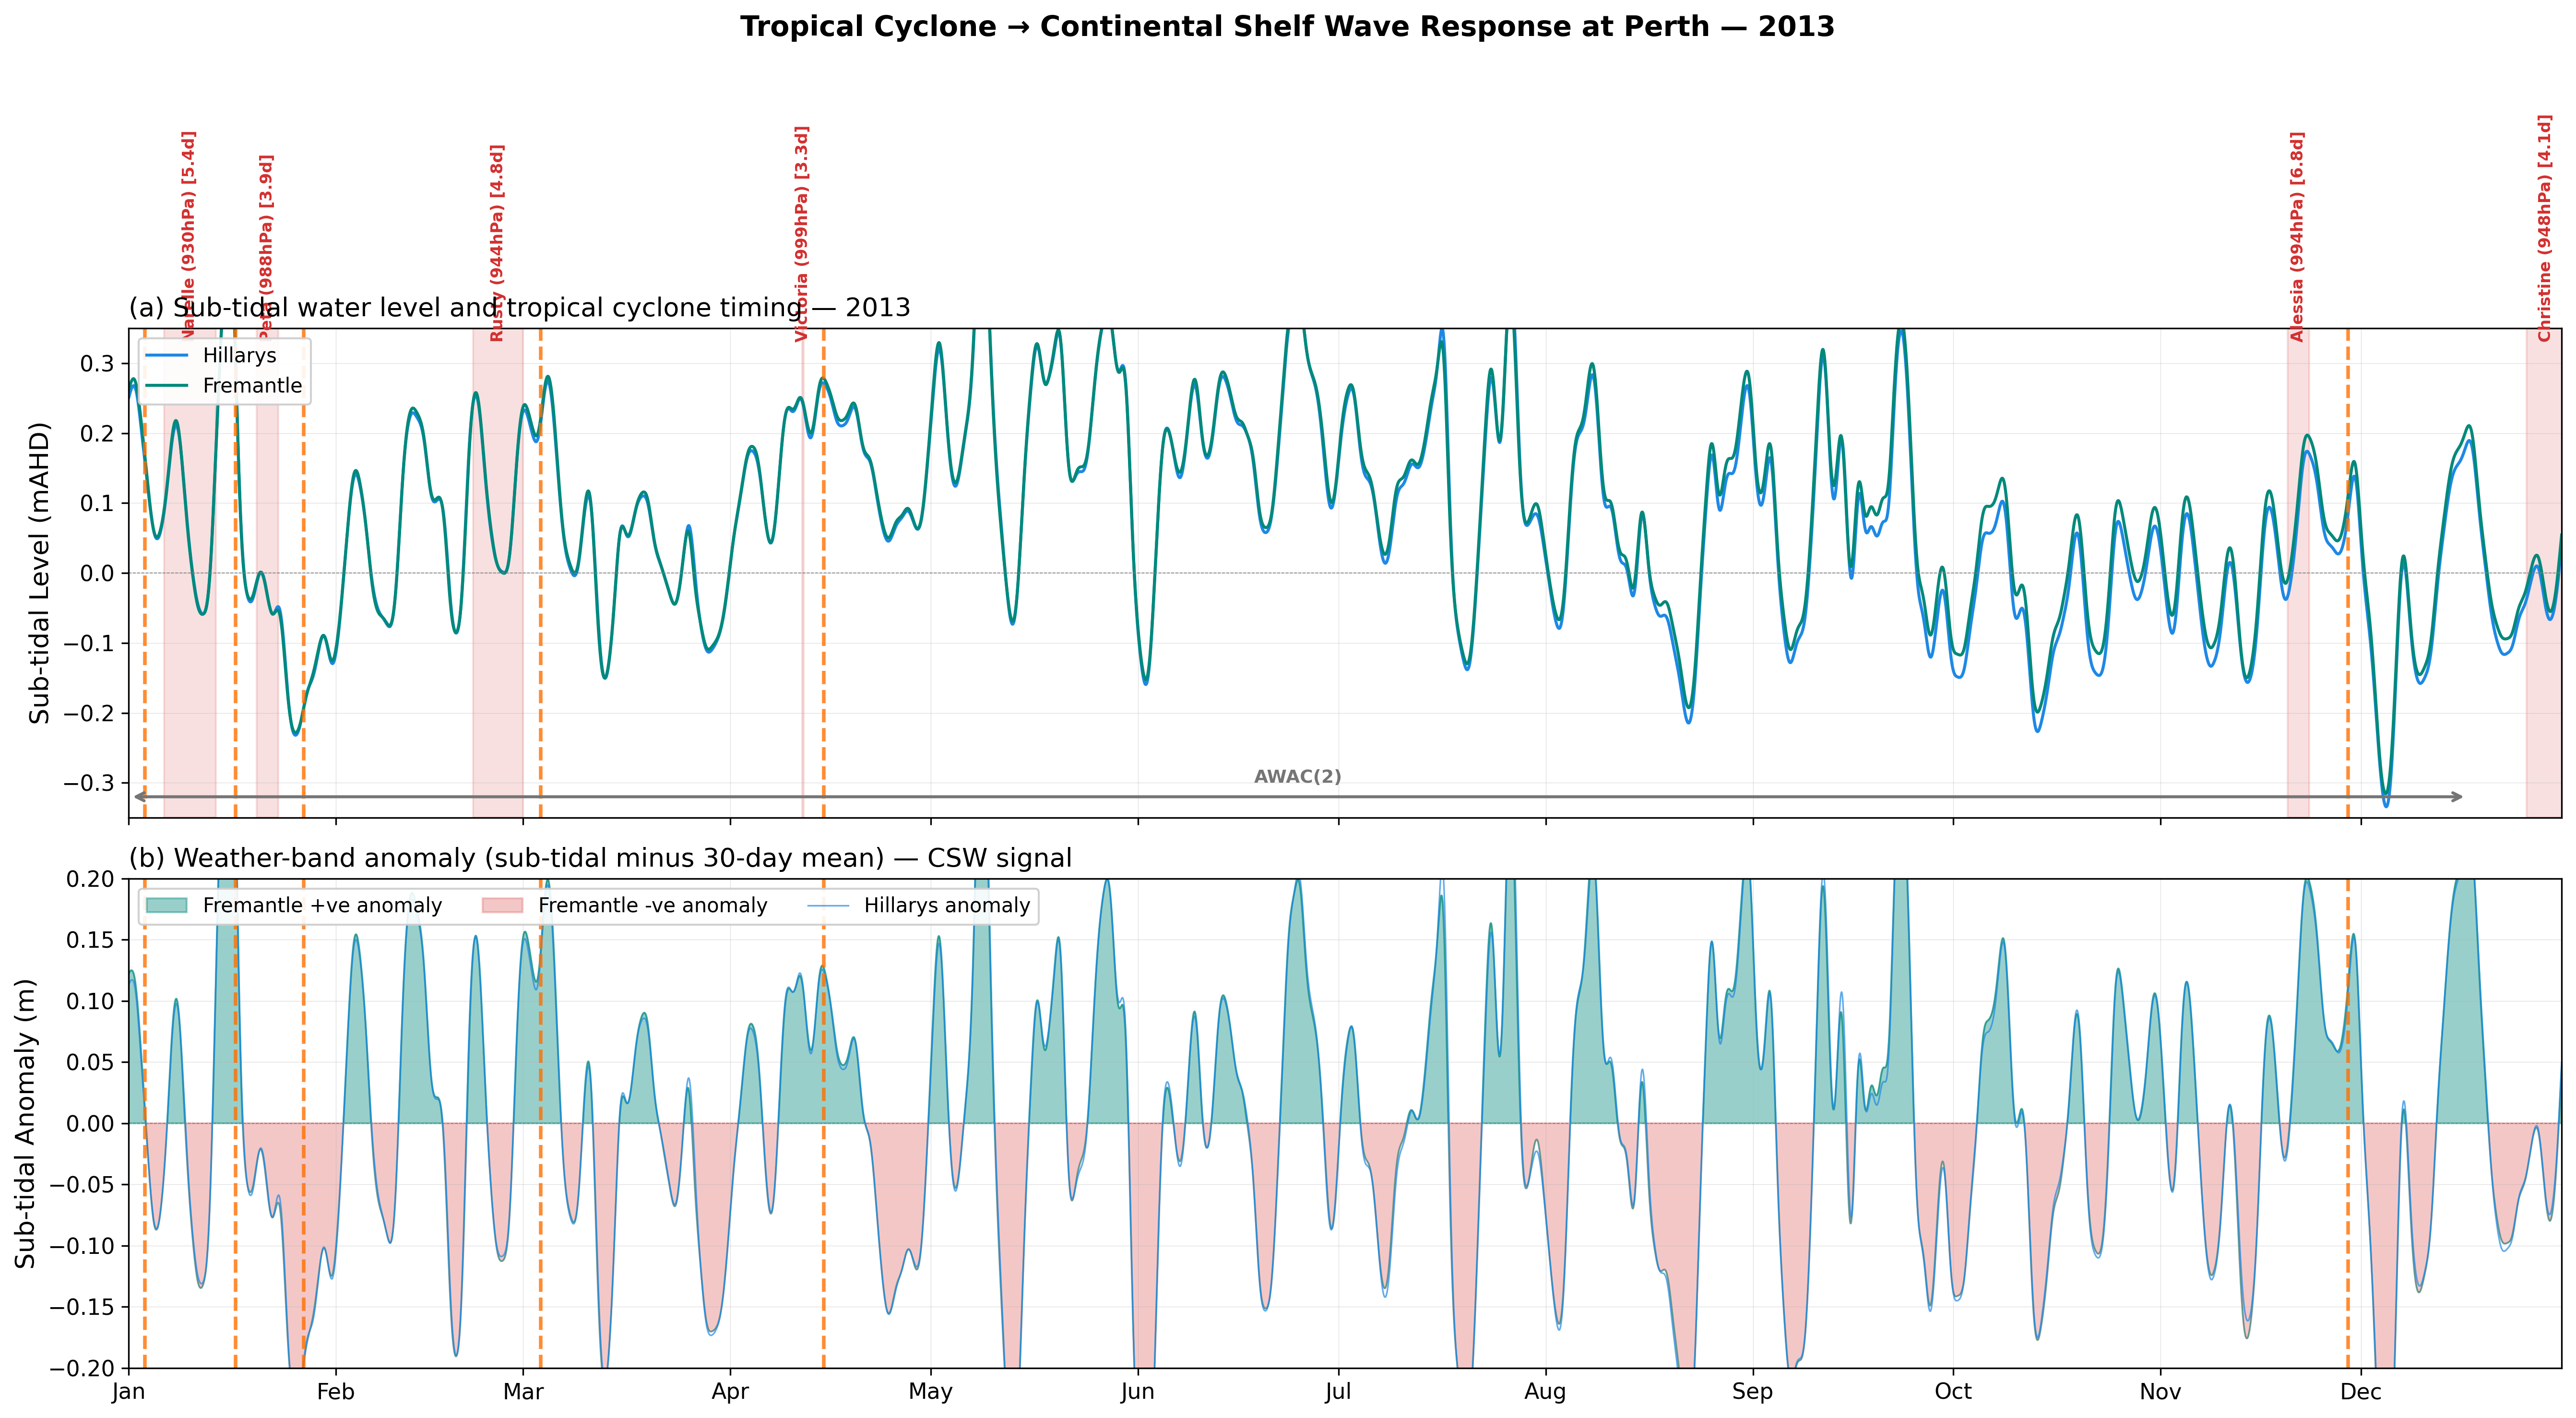
2013 — Sub-tidal water level with TC annotations
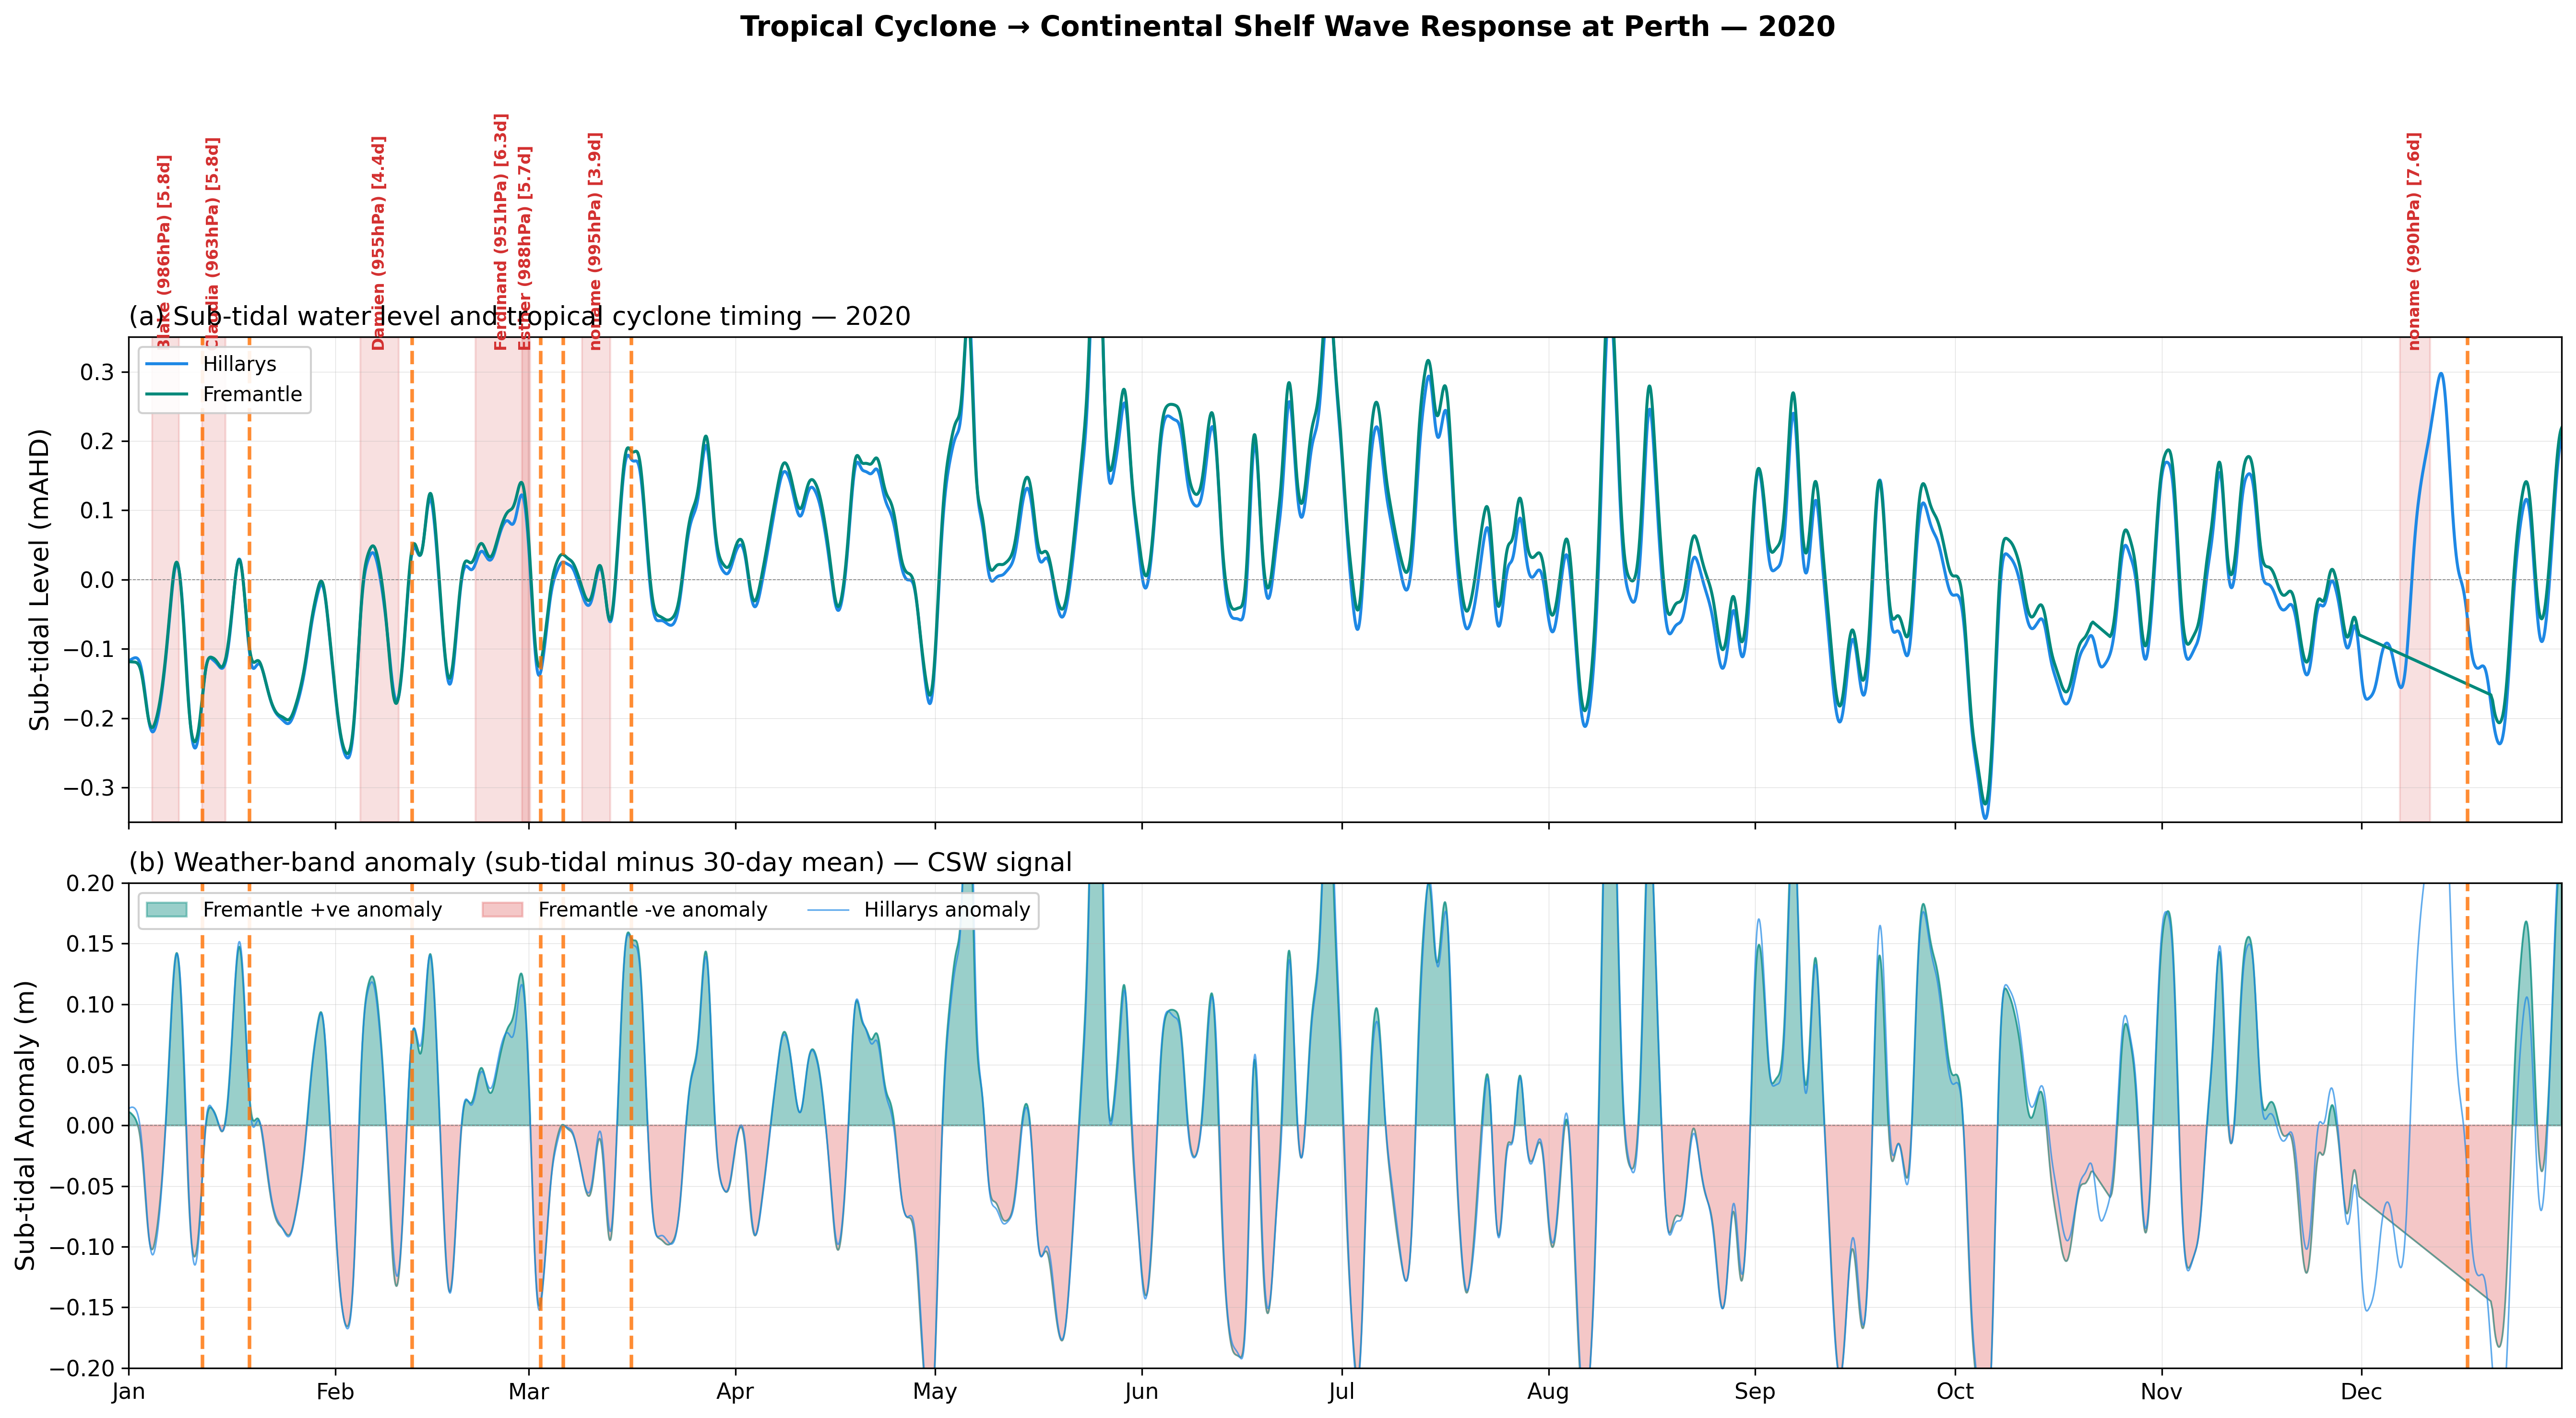
2020 — Sub-tidal water level with TC annotations
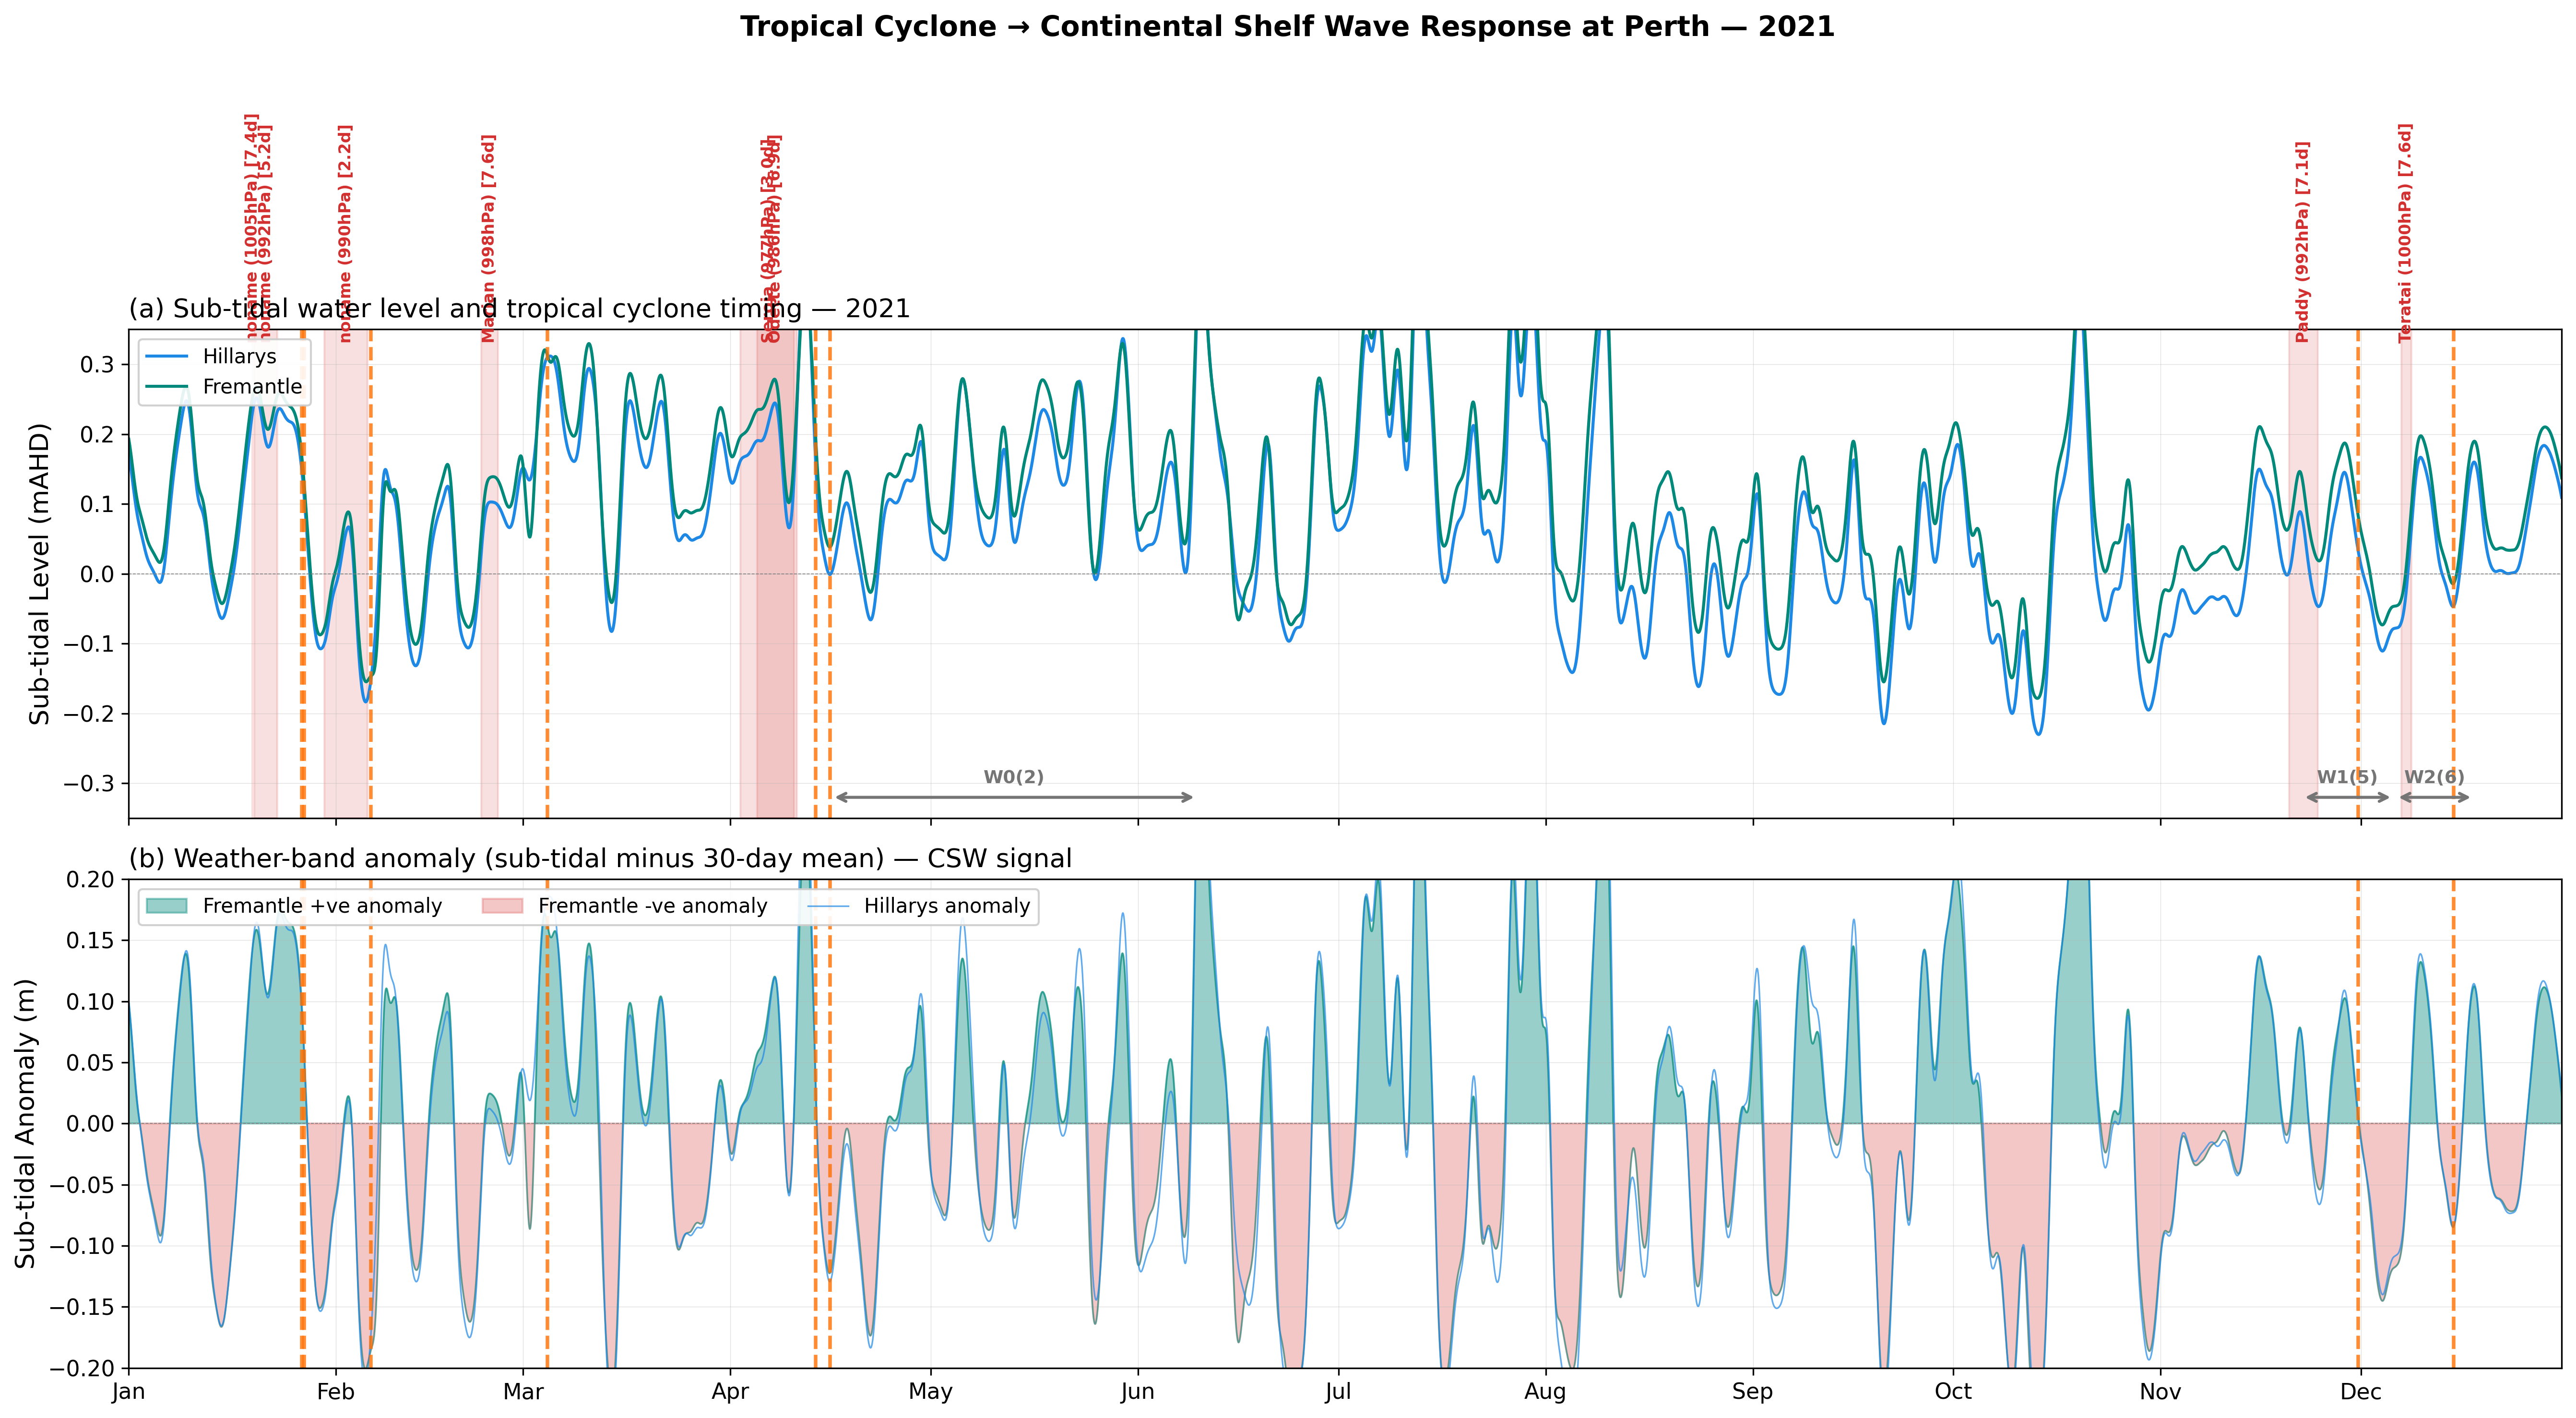
2021 — Sub-tidal water level with TC annotations
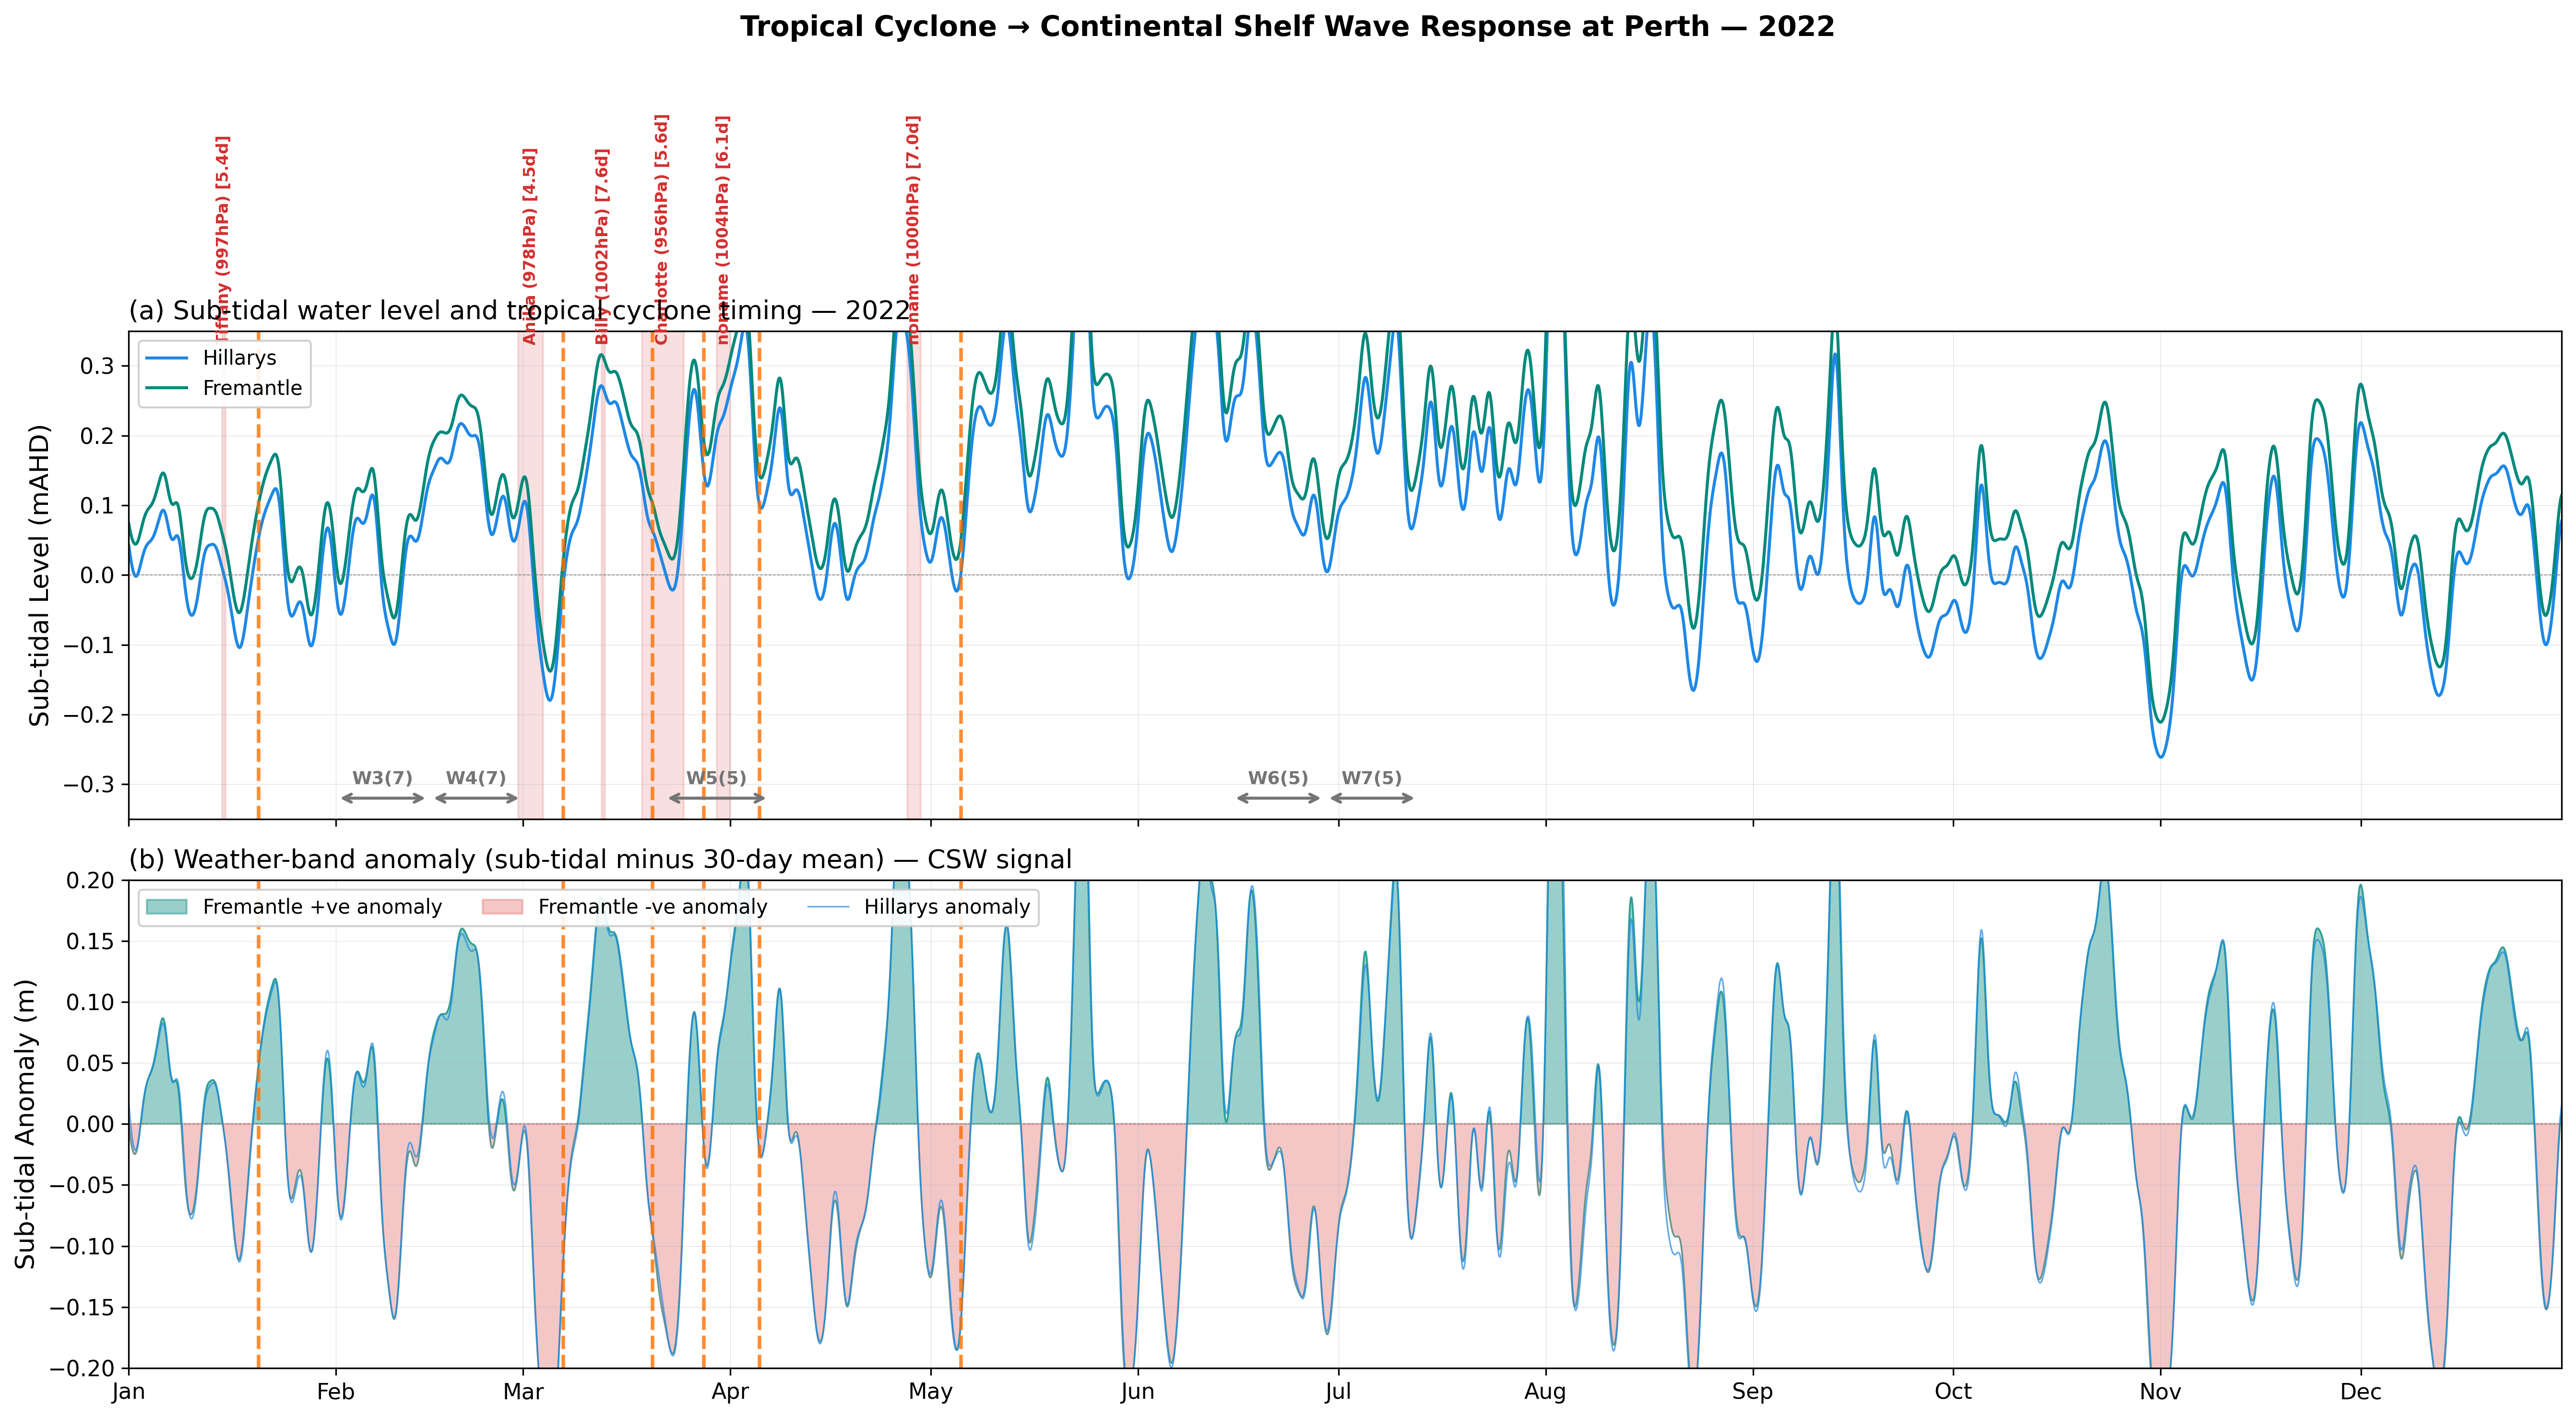
2022 — Sub-tidal water level with TC annotations
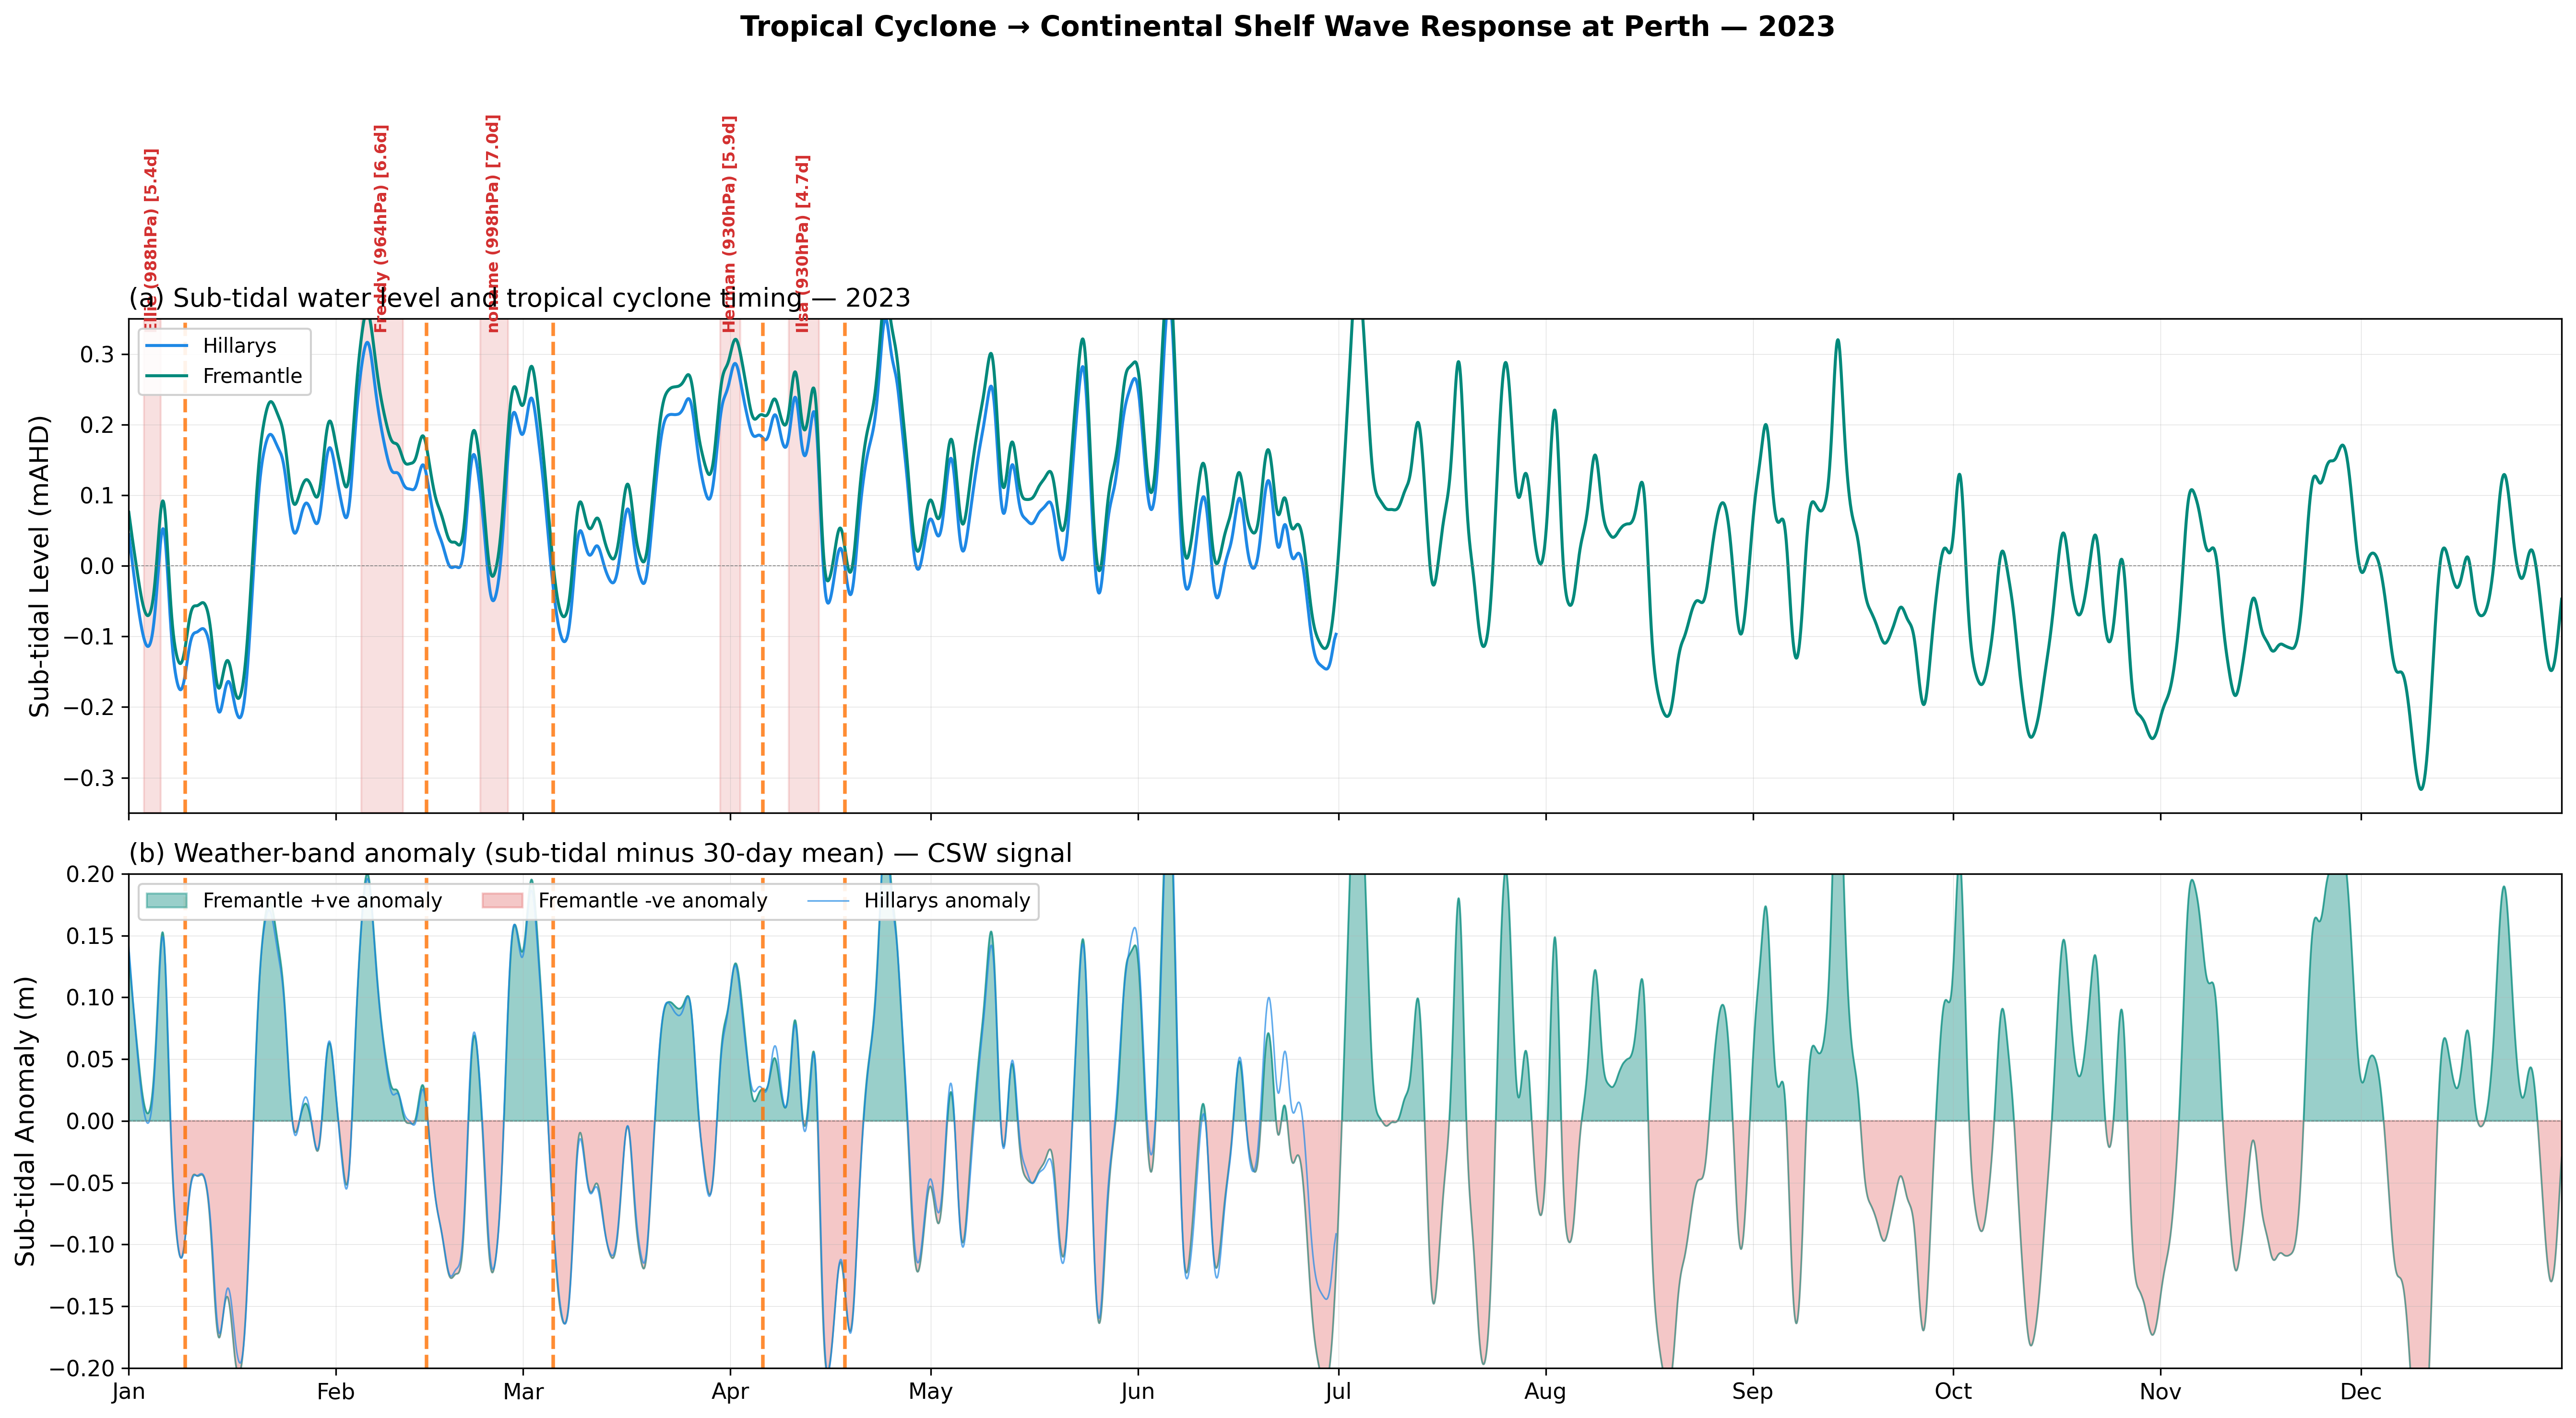
2023 — Sub-tidal water level with TC annotations
Key Findings
Model Skill
- Water level is well reproduced at both stations, with Willmott skill scores consistently above 0.95 for 2013–2022 runs and above 0.91 for 2023.
- Correlation (R) ranges from 0.90 to 0.96 — the model captures tidal phasing and amplitude well.
- Best performance at Hillarys (median RMSE 7.0 cm); Fremantle shows slightly larger errors (median RMSE 9.1 cm), likely due to its location near the Swan River mouth and harbour geometry.
Bias Patterns
- 2013A shows a positive bias at both stations (+3 to +5 cm) — model water levels sit too high.
- 2020–2022 runs show near-zero bias at Hillarys (−1 to +2 cm) but growing negative bias at Fremantle (−1 to −7 cm).
- 2023 runs show the largest negative bias at both stations (−8 to −9 cm), coinciding with degraded skill. This may relate to boundary condition quality or interannual sea-level variability not captured in the ROMS forcing.
Mesh Sensitivity
- A-mesh and B-mesh produce near-identical water level results (e.g., 2021A vs 2021B: RMSE 6.8 vs 6.9 cm at Hillarys, 9.2 vs 9.1 cm at Fremantle).
- The refined B-mesh does not significantly improve water level prediction — the boundary forcing is the dominant control.
Data Sources & Processing
Observations
- Hillarys: Bureau of Meteorology station 71012, hourly water surface height in mAHD, QC-filtered (flag "N" = good).
- Fremantle: Station H175, hourly tide gauge in mm relative to Chart Datum. Converted to mAHD by subtracting 0.811 m. UTC → AWST (+8 h).
Model
- TUFLOW-FV unstructured mesh, variable H (water surface elevation, mAHD), hourly output.
- Hillarys cells: A-mesh 6863, B-mesh 8664. Fremantle cells: A-mesh 1080, B-mesh 3195 (west of harbour entrance).
- Statistics: bias, RMSE, Pearson R, Willmott (1981) skill score on aligned hourly data.
- Sub-tidal: Godin (1972) A24×A24×A25 sequential rolling mean filter.